Introduction
Since the Allvisatos group first fabricated light-emitting diodes using cadmium selenide nanocrystals (NCs) and a semiconducting polymer in 1994 [Reference Colvin, Schlamp and Allvisatos1], quantum dots light-emitting diodes (QLEDs) have achieved great development in the fields of display and illumination in the past 20 years thanks to their excellent advantages compared with organic light-emitting diodes (OLED) such as high color purity, saturated emission, low threshold voltage, and so forth [Reference Huang, Pan, Zhang, Chen, Tao, He, Zhou, Tu and Lei2, Reference Pan, Chen, Zhao, Huang, Khan, Liu, Tao, Zhang and Lei3]. Traditionally, QLEDs with a sandwich structure is composed of organic carrier transport layers, quantum dots (QDs) emitting layer, and metal or metal oxide electrodes [Reference Liang, Zhu and Dong4, Reference Jo, Kim, Lee, Han, Jang, Do and Yang5]. Usually, owing to the unstable characteristic of organic materials in air, the assembly route of QLEDs not only should be operated in a glove box filled with nitrogen (O2 < 0.1 ppm, H2O < 0.1 ppm) but also need to be encapsulated by an ultraviolet (UV) curing adhesive and sliding glass to cover the assembled QLED device to isolate from the water and oxygen in the air. Therefore, it is still a big challenge to seek proper stable inorganic carrier transport materials to replace the organic ones to facilitate the QLEDs assembling process to meet the large-scale commercial applications.
In 2008, the Bawendi group first reported all-inorganic QLEDs using NiO and ZnO: SnO2 as the hole transport layer (HTL) and electron transport layer (ETL), respectively, by the sputtering method. The external quantum efficiency (EQE) and luminance was 0.09% and 1500 cd/m2, respectively, at an applied voltage of 13.8 V [Reference Caruge, Halpert, Wood, Bulovic and Bawendi6]. Following this structure, Mashford et al. fabricated all-inorganic QLEDs based on a sol–gel NiO HTL to obtain a maximum electroluminescence (EL) brightness of 249 cd/m2 at the voltage of 8 V [Reference Mashford, Nguyen, Wilson and Mulvaney7]. However, all inorganic QLEDs exhibit low luminescence efficiency, low brightness, and high threshold voltage due to the imbalance carrier transportation between the ETL of ZnO and HTL of NiO, leading to the accumulation of excess electrons in QDs emitting layer, luminescence quenching by QD charging, Auger nonradiative recombination and leakage current [Reference Li, Shao, Chen, Wang, Li and Zhang8], which hinder the commercialization process of all-inorganic QLEDs.
Although there are odd valence electrons in a single NiO crystal cell, it should be an excellent conductor according to the energy band theory [Reference Zhang, Zuo, Li, Gao, He and Zheng9]; actually, it is a kind of Mott insulator with a resistivity of 1013 Ω cm at room temperature due to the quantum entanglement effect between the electrons [Reference Shi, Ren and Zhang10], which is still a great bottleneck in the application of all-inorganic QLEDs because of its high resistivity and low carrier mobility [Reference Jang, Lu, Hwang, Hsiung and Wang11]. On the one hand, the high resistivity of NiO films can lead to a higher average electric field across the QLED device and more Joule heating, which will seriously deteriorate QLED device performance [Reference Wood, Panzer, Halpert, Caruge, Bawendi and Bulovic12]. On the other hand, low hole carrier mobility of the NiO film will make carrier transportation more imbalanced, inducing excess electrons into the QD layer, leading to an increased electron leakage current and a recombination zone close to the anode [Reference Wood, Panzer, Caruge, Halpert, Bawendi and Bulovic13]. Furthermore, lattice defects including nickel vacancy and interstitial oxygen will play a carrier trap role to limit hole transportation [Reference Nguyen, Jeong, Park, Ahn and Lee14]. As a result, the threshold voltage is relatively high in previous reports (more than 6 V), since most of the voltage is applied in the NiO layer.
In order to improve the electric properties of NiO, monovalent atoms such as Li+ and K+ were incorporated into the NiO crystal lattice by the magnetron sputtering method due to the increasing number of Ni3+ ions and interstitial oxygen by the formation of nickel vacancies [Reference Jang, Lu, Hwang and Chen15, Reference Yang, Pu, Zhou and Zhang16]. For example, the resistivity of NiO can be decreased to 1 Ω cm after doping a certain amount of Li and K atoms. Fominykh et al. [Reference Fominykh, Chernev, Zaharieva, Sicklinger, Stefanic, Doblinger, Muler, Pokharel, Bocklein, Scheu, Bein and Rohifing17] reported the Fe-doped NiO NCs to enhance the ability to produce hydrogen by electrochemical water splitting due to the decrease of polarization voltage after doping Fe ion. Zhao et al. fabricated Cu-doped NiO thin film by the electrochemical method, exhibiting enhanced electrochromic performance and fast response time due to the increased conversion speed between Ni2+ and Ni3+ [Reference Zhao, Su, Liu, Cao, Wang, Dong and Song18]. Yang et al. fabricated Cu-doped NiO deposited by the pulsed plasma deposition (PLD) method, showing that the dopant Cu on Ni site increased the concentration of holes, and thus, the film’s conductivity was enhanced [Reference Yang, Shi, Feng, Pu, Li, Zhou and Zhang19]. More recently, the Jen group [Reference Kim, Liang, Williams, Cho, Chueh, Glaz, Ginger and Jen20] applied a Cu-doped NiO thin film as the HTL of perovskite solar cells, showing enhanced conductivity compared with pure NiO film, leading to enhanced open circuit voltage, fill factor, short circuit current, and EQE. Kim et al. also applied the Cu-doped NiO hole injection layer (HIL) for solution-processed hybrid organic–inorganic LEDs. Cu-doped NiO films exhibits a more than four times higher vertical current in comparison with NiO films in the conductive atomic force microscopy (C-AFM) configuration due to the increased amount of Ni vacancy. Further, the hole injection ability of Cu-doped NiO films is improved as well [Reference Kim, Joo, Kim, Choi, Lee, Lee, Cho, Lee, Park, Cho, Cho, Lee, Jeon and Kwon21]. However, few works have reported the solvothermal Cu-doped NiO films and their application in all-inorganic QLEDs as HTL.
In this work, we first study the effect of the amount of Cu doping on the EL performance of the Cu-doped NiO NCs-based all-inorganic QLEDs to overcome the problems mentioned above. Copper was chosen as the dopant due to its outstanding advantages: (i) Cu has the nearly the same ionic radius as Ni, leading to the formation of substitutional ions in the NiO crystal lattice to decrease the nickel vacancy defects [Reference Manouchehri, Mehrparvar, Moradian, Gholami and Osati22]. (ii) Cu, as a transition metal element, has two chemical states: Cu2+ and Cu+, which can enhance the conductivity of NiO during the conversion between the two states [Reference Yang, Pu, Zhou and Zhang16]. (iii) The hybrid orbit can be formed between the Cu 3d 10 and the top of NiO valence band, which can attenuate the locality effect of hole carriers by the O 2p 6 energy level, so as to enhance the carrier mobility of NiO [Reference Kawazoe, Yasukawa, Hyodo, Kurita, Yanagi and Hosona23]. (iv) Cu can appropriately adjust the valence band position of the NiO film to decrease the hole injection potential barrier between NiO and QDs.
Results and discussion
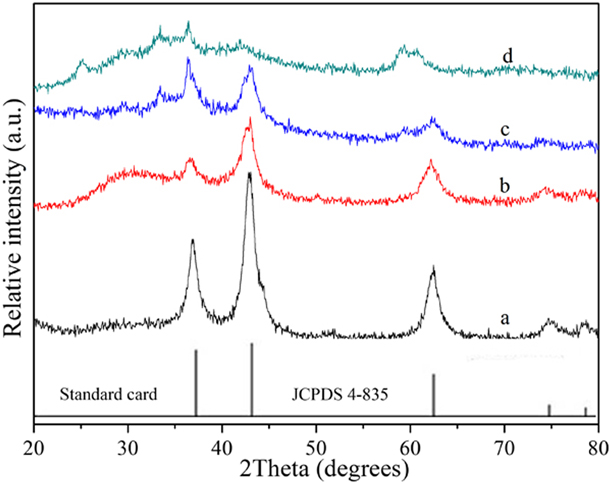
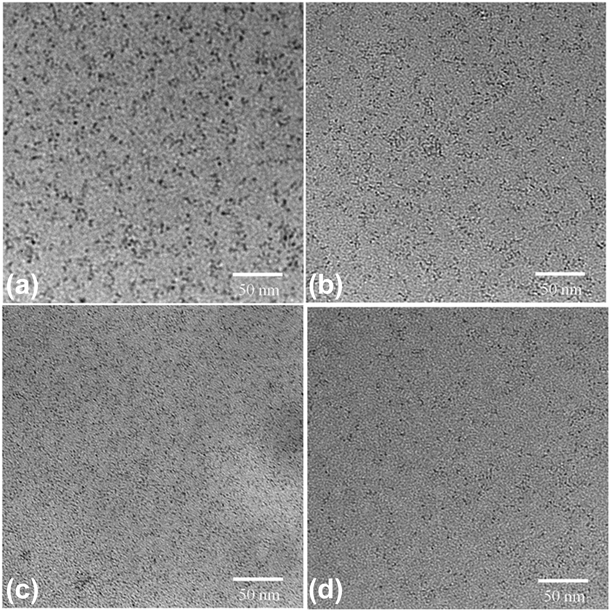
Figure 1 displays the X-ray diffraction (XRD) patterns of the obtained Cu-doped NiO coating on quartz substrate. The diffraction peaks at 37.26, 43.31, and 62.98° were assigned to the (111), (200), and (220) planes, which is well matched with the bunsenite cubic structural NiO in the space group Fm3m (NaCl-type), (JCPDS card 4-835). With the increase of the Cu doping, the full width at half maximum (FWHM) of diffraction peaks was obviously broadened; on the contrary, intensity of the diffraction peaks decreased, indicating a certain amount of Cu doping can inhibit the growth of NiO NCs. However, excess doping will prevent the formation of NiO NCs. Transmission electron microscopy (TEM) images of the Cu-doped NiO NCs were shown in Fig. 2, showing that the size of the sample a, b, c, and d is 3.8, 2.6, 1.5, and 2.3 nm, respectively.
XRD patterns of the obtained Cu-doped NiO films and standard card (JCPDS 4-835).

TEM images of Cu-doped NiO NCs, (a) NiO, (b) 1% Cu-doped NiO, (c) 5% Cu-doped NiO, and (d) 10% Cu-doped NiO.

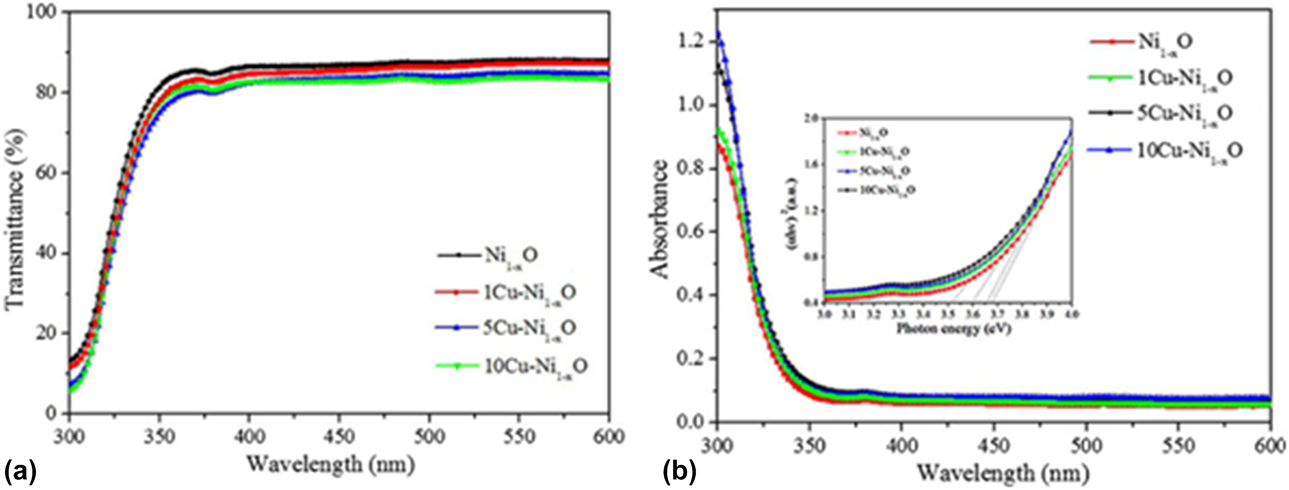
Figures 3(a) and 3(b) show the optical transmittance and absorbance of the Cu-doped NiO thin film on quartz substrate, respectively. The average optical transmittance of the sample a, b, c, and d is ∼86%, 84%, 82%, and 81%, respectively, i.e., with the increased amount of Cu doping, the transmittance of the Cu-doped NiO NCs thin films is decreased. The inset of Fig. 3(b) shows the band gap of the prepared Cu-doped NiO thin film, which is determined by the extrapolation method. The optical band gap of bulk NiO of the sample a, b, c, and d is 3.67, 3.65, 3.64, and 3.63 eV, respectively.
Transmittance (a), absorbance (b), and the band gap (inset b) of the Cu-doped NiO NCs film.

In order to further get the information of the as-prepared NiO film in a small scale, two-dimensional (2D) AFM surface height morphologies of NiO film on ITO substrate were obtained with a scanning area of 1 × 1 µm, as shown in Fig. S3. The root-mean-square (RMS) roughness of the Cu-doped NiO thin films of sample a, b, c, and d was 0.85, 0.68, 0.42, and 1.34 nm, respectively, which can meet the basic demanding of the QLED device. Obviously, with the increase of Cu doping, the roughness of the sample decreases; however, excess doping will cause increased roughness probably due to the phase separation or impurity phases.
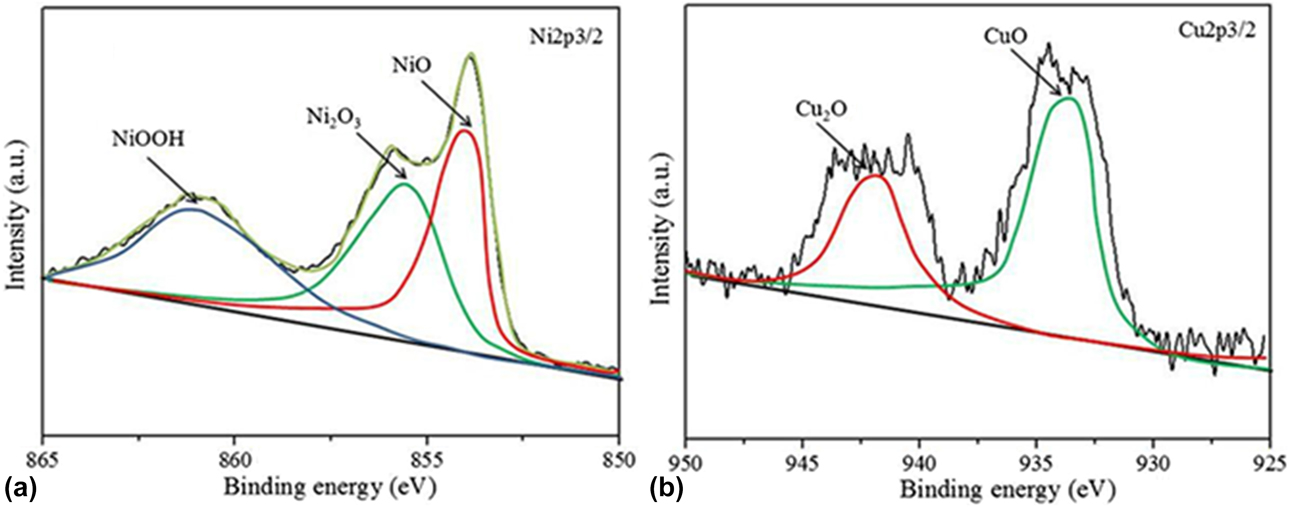
The surface chemical compositions and states of the as-prepared Cu-doped NiO NCs of the sample c on quartz substrate were studied by XPS analysis. The peak fitting of the XPS data shows that the Cu and Ni elements were existed with multivalent states, such as Cu2+ and Cu+, Ni3+ and Ni2+, as shown in Fig. 4. The peak of 856.6 and 854.8 eV is ascribed to Ni2O3 and NiO, respectively, as shown in Fig. 4(a). The binding energy of Cu2+ and Cu+ is 934.3 and 932.5 eV, respectively, as shown in Fig. 4(b). To examine the electronic structure and work functions of Cu-doped NiO NCs, ultraviolet photoelectron spectroscopy (UPS) was carried out in the secondary electron cutoff and Fermi regions for the NiO NCs, as shown in Fig. S4. The cutoff region of secondary electrons and Fermi region were determined by the intersection of two tangential lines extended from the background and downward cutoff curves. The work function (ϕ) was evaluated by subtracting the secondary electron cutoff position from the photon energy of the UV source (21.22 eV), according to the formula: ϕ = hν − (E cutoff − E Fermi) [Reference Park, Doh, Shin, Seo, Kim, Kim, Choi and Hong24]. The valence band edge of the NiO NCs of sample a, b, c, and d is 6.29, 6.25, 6.82, and 6.07 eV, respectively. Figure S5 shows the distribution of total density of states (DOS) and local state density. The top of the valence band is mainly composed of the lower valence band of −8 to 3 eV and the upper valence band of −3 to 0 eV. Due to the antiferromagnetic properties of NiO, the state density diagram is symmetric above and below, as shown in Fig. S5(a). After doping, the state density of NiO was significantly changed, and the Fermi energy level of NiO was obviously shifted to low energy state and entered its valence band top, showing the energy band characteristics of typical p-type semiconductor. The upper valence band is mainly formed by Ni 3d and Cu 3d states, while the lower valence band is mainly contributed by O 2p states. State for the quality of the conduction band comes mainly from Ni 4s. No deep level states were introduced in the forbidden band of NiO after Cu doping, indicating that good hybridization effect happens between Cu 3d and the top valence band of NiO, so as to achieve better p-type doping effect to improve the conductivity of p-type NiO, as showing in Fig. S5(b).
XPS analysis of the NiO NCs of Ni 2p 3/2 (a) and Cu 2p (b) for the sample c.

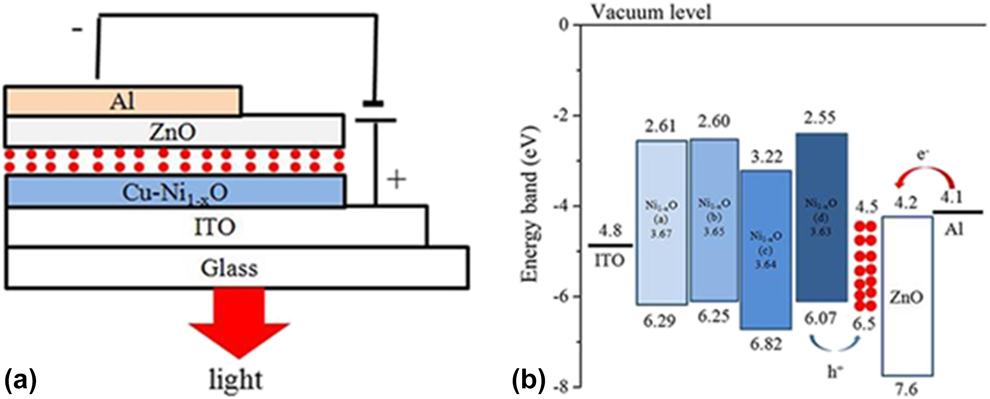
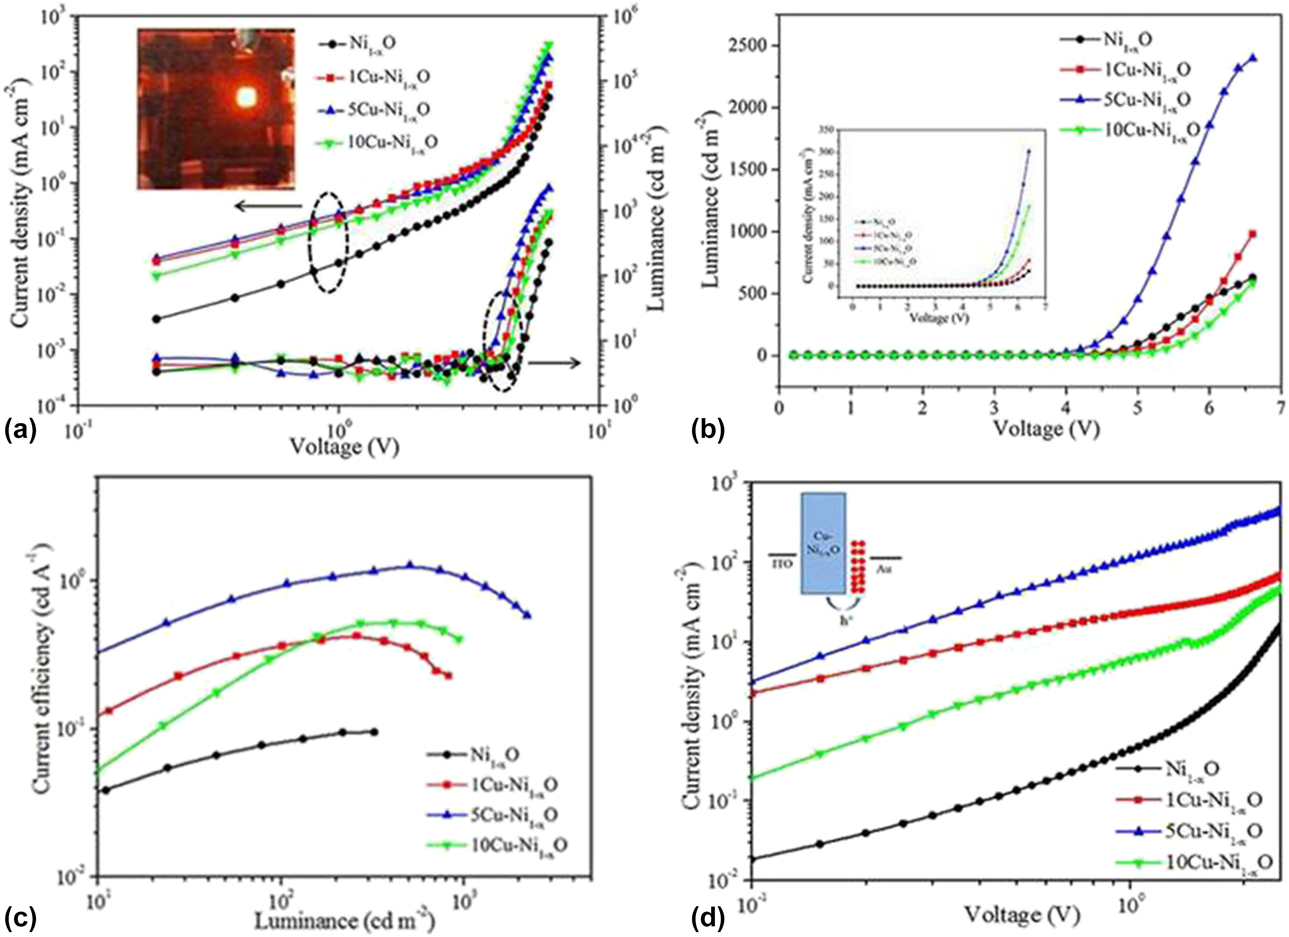
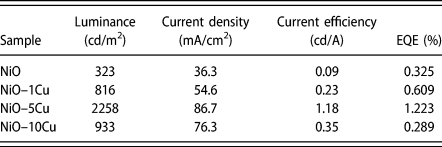
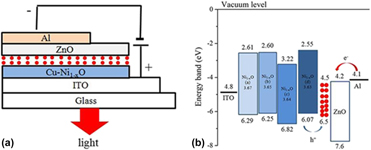
The structure of the QLED device is schematically shown in Fig. 5(a), considering the all-inorganic characteristic of the QLED device, and encapsulation process is removed in the device. Specifically, the multilayer structure consisted of ITO, NiO, QDs, ZnO NCs, and Al, in which serve as the anode, HTL, emitting layer, ETL, and cathode, respectively. Figure 5(b) illustrates the corresponding energy diagram of the QLED according to the valence band edge by UPS calculation and the actual band gap by UV analysis. Figure 6(a) displays the QLED characteristic double logarithmic plots of the current-density (J) and luminance (L) versus driving voltage (V). Obviously, the sample c obtains the lowest threshold voltage (3.4 V) and the highest current density probably due to the decreased resistivity after proper copper doping, indicating that the interface potential barrier of the all-organic QLED device is low enough to operate at low voltage, which implies that the Cu-doped NiO NCs film is an excellent HTL in all-inorganic QLED device. However, the luminance of sample d-based QLED device decreases compared with that of sample a, because of the decreased carrier mobility caused by the scatter effect of the excess doping Cu ions. The inset of Fig. 6(a) is the photograph of the sample c-based all-inorganic QLED at an applied voltage of 5 V, showing excellent monochromaticity. The L–V curves of the QLED are shown in Fig. 6(b). The maximum luminance for the sample a, b, c, and d was 323, 816, 2258, and 933 cd/m2, respectively. The J–V characteristic curves of the QLED are shown in the inset of Fig. 6(b), exhibiting clear electrical rectification characteristic. In Fig. 6(c), the current efficiency of the QLED exhibited the maximum values of 0.09, 0.23, 1.18, and 0.35 cd/A, respectively, as shown in Table I. Assuredly, the current efficiency of our QLED is relatively low compared with the organic–inorganic hybrid QLED device prepared by all-solution process with nitrogen ambient in glove box. However, it provides a new way to fabricate all-inorganic QLED device in air condition, showing promising prospect in all-inorganic QLED device. The hole-only devices of Au/QDs/HTL/ITO structures were further characterized to investigate the holes transport capability of the QLEDs. In this device structure, it is expected that the electron injection from the Au electrode to QDs and HTL is well obstructed by the large transport barrier at Cu–NiO/Au interface. Thus, the holes transport capability can be exclusively characterized by measuring the J–V characteristic curves. The J–V curves of hole-only devices presented different electrical features with that of QLEDs. The sample c-based QLED showed the highest current density with enhanced electric and electroluminescent characteristics, indicating that the sample c Cu–NiO NCs layer contributed to the high holes conduction capability, as shown in Fig. 6(d). Since the hole is the minority carrier in our QLED device, the enhancement of hole currents in the sample c-based QLED will make a better balance between the hole and the electron transport, leading to a substantial luminous-efficiency increase compared to other devices.
Schematic fabrication diagrams of the Cu-doped NiO NCs-based QLED (a) and energy level alignment of the QLED (b).

J–V and L–V characteristic curves plotted on double-logarithmic axes of the all-inorganic QLEDs, the inset is the digital photograph of the sample c-based all-inorganic QLED at an applied voltage of 5 V (a), L–V and J–V (inset) curves of QLEDs (b), the current efficiency as a function of the luminance (c), J–V characteristic curves of hole-only devices, and the inset is the schematic diagrams of hole-only device (d).

The luminance, current density, current efficiency, and EQE of the all-inorganic QLEDs based on Cu-doped NiO NCs.

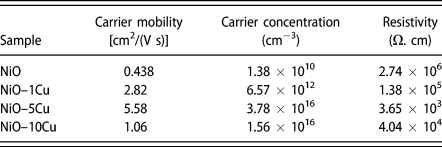
In order to investigate the enhancement mechanism of the all-inorganic QLED device after doping a proper amount of Cu in NiO NCs, the samples were tested using Hall effect measurement system. With the increase of the Cu doping amount, the carrier mobility increases from 0.438 to 2.82 and 17.5 cm2/(V s) as well; however, when the doping amount increased to 10%, the carrier mobility began to decrease due to the scatter effect of the excess doping Cu ions. Compared with other transition metal ions, the outer electron energy level of copper is the similar to 2p energy level of oxygen, to easily form hybrid orbit to weaken the locality effect of hole from the strong electronegativity of ion bond. However, the solubility of copper ions in NiO NCs is limited, not all the doping Cu ions are contributed to the carriers, only a part of the doping ions has electrical activity. The doping ions will form interstitial atoms in the NiO crystal when the doping concentration is too high, which will decrease the carrier mobility due to the scatter effect of the excess doping ions. On the one hand, impurity energy level can be introduced in the forbidden band of NiO by doping proper amount of Cu ions, so as to increase the carrier concentrations. On the other hand, the conductive pathway of hole carrier in NiO crystal will be increased after doping Cu, i.e.,  ${\rm{N}}{{\rm{i}}^{3 + }} + {\rm{N}}{{\rm{i}}^{2 + }} \leftrightarrow {\rm{N}}{{\rm{i}}^{2 + }} + {\rm{N}}{{\rm{i}}^{3 + }}$,
 ${\rm{C}}{{\rm{u}}^{2 + }} + {\rm{C}}{{\rm{u}}^ + } \leftrightarrow {\rm{C}}{{\rm{u}}^ + } + {\rm{C}}{{\rm{u}}^{2 + }}$,
 ${\rm{N}}{{\rm{i}}^{3 + }} + {\rm{C}}{{\rm{u}}^ + } \leftrightarrow {\rm{N}}{{\rm{i}}^{2 + }} + {\rm{C}}{{\rm{u}}^{2 + }}$, leading to the increase in mobility and conductivity of hole carrier (Table II).
The carrier mobility, carrier concentration, and resistivity of Cu-doped NiO NCs films.

Conclusions
Cu-doped NiO NCs film was successfully prepared by a simple and low-cost hydrothermal route using nickel acetatylacetonate, copper acetylacetonate, and tert-butyl alcohol as precursors at 200 °C for 24 h. The obtained Cu-doped NiO NCs films were applied as HTL in all-inorganic QLEDs. Proper amount of Cu-doping can inhibit the growth, adjust the valence band position of NiO NCs, and increase the concentration, conductivity, and mobility of hole carriers. However, excessive Cu-doping will decrease the hole carrier mobility because of the scatter effect. The best QLED performance was achieved when the doping amount was 5% mol, to obtain a luminance of 2258 cd/m2, a current efficiency of 1.18 cd/A, and a EQE of 1.223%, which is a promising HTL candidate in all-inorganic QLED device.
Experimental section
Chemicals
All reagents used in this work were purchased at analytical reagent grade and used for synthesis without further purification.
Synthesis of Cu-doped NiO NCs
In a typical procedure, 0.35 g of nickel acetylacetone, a certain amount of copper acetylacetone (1, 5, 10 mol%) (Aladdin Chemical Reagent Co., Ltd., China; purity: > 99.9%), and 35 mL of tert-butanol were placed in a 50 mL Teflon-lined autoclave. The autoclaves were maintained at 200 °C for 24 h and cooled in air to room temperature. The precipitates were collected, washed with deionized water and absolute ethanol for several times, and then dried in air at 80 °C for 12 h. The precipitate was re-dispersed in ethanol to form a Cu-doped NiO NCs suspension of a concentration of 1 mg/mL. The Cu-doped NiO NCs samples with 0, 1, 5, and 10 mol% amount were marked with a, b, c, and d, respectively.
Synthesis of QDs
For a typical synthesis of CdSe/ZnS QDs, 0.2 mmol of CdO, 4 mmol of zinc acetate, and 5 mL of oleic acid (OA) were placed in a 100 mL three-necked bottle and heated to 150 °C in flowing high-purity argon for 30 min. Then 15 mL of 1-octadecene (ODE) was added to the flask and the temperature was elevated to 300 °C. A stock solution containing 0.2 mmol of Se and 4 mmol of S dissolved in 2 mL of trioctylphosphine (TOP) was quickly injected into the flask to react for 6 min. The resulting QDs were washed several times and finally dispersed in toluene to form a suspension on a concentration of 15 mg/mL.
Synthesis of ZnO NCs
In a typical process, 0.66 g of Zn(Ac)2 in 30 mL of dimethyl sulfonate (DMSO) and 10 g of tetramethylammonium hydroxide (TMAH) in 100 mL of ethanol were mixed and stirred for 1 h in ambient atmosphere. The prepared product was collected by centrifugation and then washed with the mixture solution of ethanol and n-heptane (volume ratio 1:4) for three times. Finally, the precipitate was re-dispersed in ethanol to form a ZnO nanoparticles solution with a concentration of 30 mg/mL.
Device fabrication
QLEDs were fabricated on patterned ITO-coated glass substrates with a sheet resistance of ∼20 Ω/sq. The substrates were cleaned subsequently with deionized water, acetone, and isopropanol for 15 min, respectively, followed by treating with ozone generated by UV light in air for 15 min. The substrates were spin-coated with Cu-doped NiO NCs (1 mg/mL, ethanol) by a speed of 3000 rpm and then annealed at 60 °C for 10 min in air. The coated substrates were then spin-coated of the CdS/CdSe/ZnS QDs, and ZnO NCs layers. ZnO NCs (30 mg/mL, ethanol) ETL followed by annealing at 60 °C for 30 min. The spin speed for QD emitter layer and ZnO HTL was 2000 rpm and 3000 rpm, respectively. The average size of the QDs spin-coating of ZnO NCs and QDs is ∼2.5 nm and ∼6 nm, respectively, as shown in Figs. S1(a) and S1(b), respectively. The typical emission wavelength and absorption wavelength of the QDs is 604 nm and 586 nm, respectively, as shown in Figs. S2(a) and S2(b). The digital light photo of the QDs with the irradiation of UV light is shown in the inset of Fig. S2(a). The optical band gap energy (E g) of the green QDs was ∼1.97 eV estimated by the extrapolation method, as shown in Fig. S2(c). These multilayer samples were then loaded into a custom high-vacuum chamber (pressure, ∼3 × 10⁻⁷ torr) to deposit the top Al cathode (100 nm thick) patterned by an in situ shadow mask to form an active device area of 4 mm2. The fabrication process of the QLED is shown in Fig. 7.
Schematic diagrams of the all-inorganic QLED fabrication process.

Characterization
The samples were characterized by XRD (Bruker D8 Advance diffractometer, Germany) using Cu Kα radiation source, Hall effect measurement system (HMS-5500, Korea), X-ray photospectra UV-visible spectrophotometer (PerkinElmer, Lambda 35, Germany) from 300 to 800 nm, transmission electron microscopy (TEM) (JEM-2010) with an accelerating voltage of 200 kV, and atomic force microscopy (AFM) (SPA400, Seiko Instruments Inc., Japan). XPS spectra were obtained with a Kratos AXIS-ULTRA XPS equipped with a standard and monochromatic source (Al Kα, United Kingdom). UPS was applied to measure the valence band edge of the NiO NCs. An Agilent 4255C equipped with a calibrated Newport silicon photodetector was used to measure the current–luminance–voltage characteristics. The EL spectra were recorded using an Ocean Optics high-resolution spectrometer (HR4000, USA).
Supplementary material
To view supplementary material for this article, please visit https://doi.org/10.1557/jmr.2019.130.
Acknowledgments
This work was financially supported by the Scientific and technological project of Henan province (182102210504), the national natural science foundation of China (51772256), the program for innovative research team (in science & technology) in university of Henan province (19IRTSTHN026).