I. INTRODUCTION
Published studies on the synthesis and behavior of Al-based metal matrix nanocomposites (MMNCs) have been motivated by several factors.Reference Li, Zhao, Ortalan, Liu, Zhang, Vogt, Browning, Lavernia and Schoenung1–Reference Li, Lin, Xiong, Schoenung and Lavernia10 First, from a structural perspective, the physical properties of Al and its alloys (e.g., density) render them an ideal matrix to design light-weight MMNCs.Reference Li, Zhao, Ortalan, Liu, Zhang, Vogt, Browning, Lavernia and Schoenung1–Reference Chauhan, Roy and Mohamed5 Second, from a scientific perspective, the face-centered cubic (fcc) crystal structure of Al has been widely studied, and consequently there are well-established fundamental principles that can be used to provide insight into the strengthening mechanisms and deformation behavior of MMNCs.Reference Zhang, Topping, Li, Vogt, Zhou, Haines, Paras, Kapoor, Schoenung and Lavernia3,Reference Ma, Wen, Hu, Topping, Isheim, Seidman, Lavernia and Schoenung6,Reference Lahiri, Bakshi, Keshri, Liu and Agarwal7 Third, the nanometric particulates, which in principle should strengthen the matrix as a result of interactions with moving dislocation, have become broadly available.Reference Zhang, Topping, Li, Vogt, Zhou, Haines, Paras, Kapoor, Schoenung and Lavernia3,Reference Ma, Wen, Hu, Topping, Isheim, Seidman, Lavernia and Schoenung6 Fourth, it has been demonstrated that severe plastic deformation (SPD) methods can be readily used to refine the microstructure of fcc Al and its alloys to the ultrafine-grained (UFG, 100–1000 nm) and nanostructured (NS, <100 nm) regimes, providing the opportunity to not only enhance mechanical performance,Reference Zhang, Topping, Li, Vogt, Zhou, Haines, Paras, Kapoor, Schoenung and Lavernia3,Reference Ma, Wen, Hu, Topping, Isheim, Seidman, Lavernia and Schoenung6,Reference Vogt, Zhang, Li, Bonds, Browning, Lavernia and Schoenung8,Reference Edalati, Ashida, Horita, Matsui and Kato9 but also to investigate interesting scientific phenomena, such as twinning in fcc Al-based MMNCs.Reference Li, Lin, Xiong, Schoenung and Lavernia10
In terms of preparing Al-based MMNCs, inspection of the scientific literature shows that there are several categories of processes that can be used to synthesize these materials.Reference Chawla and Chawla11–Reference Kongshaug, Ferguson, Schultz and Rohatgi21 First, liquid-phase processes, in which the particulate or fibrous reinforcements are incorporated into liquid metal matrix using various techniques such as liquid infiltration.Reference Amateau13 Second, solid-phase processes, such as powder metallurgy processingReference Bathula, Anandani, Dhar and Srivastava14 and deformation processing (e.g., swaging, extrusion, drawing, and rolling).Reference Salimi, Izadi and Gerlich15 Third, deposition processes, which involve coating individual particulates with the matrix to form the composite and sometimes followed by diffusion bonding to form a consolidated composite. Several deposition processes, such as spray forming techniques,Reference Laha, Chen, Lahiri and Agarwal16 chemical vapor deposition (CVD),Reference He, Zhao, Shi, Du, Li, Li and Cui17 and physical vapor deposition (PVD),Reference Teixeira, Soares, Martins, Carneiro and Cerqueira18 have also been used to prepare Al-based MMNCs. Fourth, in situ processes, in which the reinforcements are formed in the metal matrix by chemical reactions during composite fabrication.Reference Rosso12,Reference Tjong and Ma19 A variety of in situ processing methods have been explored, such as flux-assisted synthesis (FAS, also known as mixed-salt reaction or reaction casting)Reference Lu, Lai and Chen20 and reactive stir mixing (RSM).Reference Kongshaug, Ferguson, Schultz and Rohatgi21 Compared to ex situ processes, in situ processes provide the following advantagesReference Tjong and Ma19: (i) the in situ formed reinforcements are generally thermodynamically stable, resulting in a higher stability when subjected to elevated temperatures; (ii) the interfaces between the in situ formed reinforcements and metal matrix are clean, leading to a strong interfacial bonding; (iii) the in situ formed reinforcements tend to be finer in size, yielding better mechanical performance. However, one should note that the grain size of the metal matrix in MMNCs produced by in situ processes is relatively large due to the high processing temperatures that are typically required.Reference Lu, Lai and Chen20,Reference Kongshaug, Ferguson, Schultz and Rohatgi21 Fortunately, recent development in SPD techniques might provide a new opportunity to further refine the metal matrix to enhance the mechanical performance of these MMNCs. For instance, our recent studies have demonstrated that asymmetric rolling (ASR), which is suitable for many engineering applications, can be applied to generate an UFG structure in Ti.Reference Li, Fu, Fu and Shan22 As shown in Fig. 1, during ASR the plastic deformation region at the roll gap can be divided into three distinct regions, i.e., entrance region (zone A), cross shear region (zone B), and exit region (zone C).Reference Hwang and Tzou23 The shear deformation in the cross shear region, which is nonexistent in conventional symmetric rolling, is a key factor for effective grain refinement during ASR.Reference Li, Fu, Fu and Shan22 In light of these findings, it would be interesting to combine an in situ process (e.g., FAS) with the ASR to synthesize UFG MMNCs with enhanced mechanical performance.
Schematic diagram of the asymmetrical rolling (ASR) process with the same diameter of the upper and lower rolls. RD, TD, and ND refer to rolling, transverse, and normal directions, respectively. V 1 and V 2 refer to the rotational speeds of the upper and lower rolls, respectively.

In view of the above discussion, the present work is motivated by three objectives. First, to demonstrate that the combined process of FAS (as a typical in situ process) and ASR is an effective method to produce UFG Al MMNCs. Second, to characterize the Al MMNCs with different ASR reduction ratios to provide insight into the microstructural evolution of the MMNCs during severe deformation and the corresponding mechanical behavior. Third, to explore the difference between pure Al and Al MMNCs with the same ASR reduction ratio to provide fundamental insight into the role of in situ nanoparticulates on the microstructural evolution and mechanical behavior of the MMNCs.
II. EXPERIMENTAL DETAILS
A. Material processing (FAS and ASR)
High purity Al (99.99 wt%) supplied by Baotou Aluminum (Group) Co., Ltd. (China) was used as the starting material. The in situ TiB2 particulate reinforced coarse-grained pure Al composite (5 wt% TiB2–Al) was fabricated by FAS, which is a typical in situ process for producing MMNCs as mentioned in a prior section. During synthesis, mixed salts of potassium tetrafluoroborate (KBF4) and potassium hexafluorotitanate (K2TiF6) with an atomic ratio of 2B/Ti were added into the stirred high purity Al melt at a temperature of 1173 K. The salts then react with the molten Al to form TiB2 particulates in the Al matrix according to the following reaction sequenceReference Tjong and Ma19:
 $$3{{\rm{K}}_2}{\rm{Ti}}{{\rm{F}}_6} + 13{\rm{Al}} \to 3{\rm{TiA}}{{\rm{l}}_3} + 3{\rm{KAl}}{{\rm{F}}_4} + {{\rm{K}}_3}{\rm{Al}}{{\rm{F}}_6}\quad {\rm{,}}$$
 $$2{\rm{KB}}{{\rm{F}}_4} + 3{\rm{Al}} \to {\rm{Al}}{{\rm{B}}_2} + 2{\rm{KAl}}{{\rm{F}}_4}\quad {\rm{,}}$$
 $${\rm{Al}}{{\rm{B}}_2} + {\rm{TiA}}{{\rm{l}}_3} \to {\rm{Ti}}{{\rm{B}}_2} + 4{\rm{Al}}\quad {\rm{.}}$$
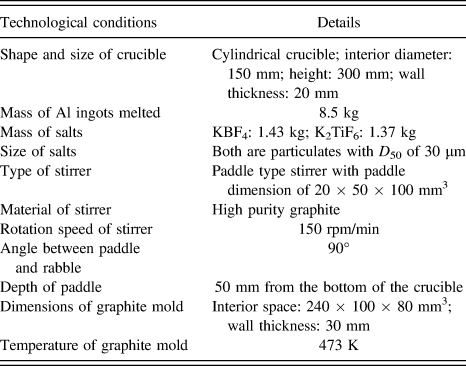
After the reaction and stirring for 30 min, the molten composite was allowed to remain undisturbed for 10 min. To remove the slag containing KAlF4 and K3AlF6, the molten composite was then cooled to 1003 K and cast into a graphite mold. Additional technical details related to FAS processing are summarized in Table I. For comparison purposes, the high purity Al (99.99 wt%) without mixed salts was also subjected to the same processing conditions: stirred and melted at 1173 K for 30 min, allowed to remain undisturbed for 10 min, then cooled to 1003 K and cast into a graphite mold.
Technical details related to FAS processing.
Samples with dimensions of 10 × 15 × 80 mm3 were sectioned from the as-cast pure Al and Al–5 wt% TiB2 composites for subsequent ASR processing. The initial thickness of all the samples before ASR is 10 mm. For comparison purposes, both pure Al and 5 wt% TiB2–Al composites were processed by ASR with reduction ratios of 60% (3 passes), 80% (4 passes), 90% (5 passes), and 97% (6 passes), respectively. All of the ASR experiments in this study were carried out at room temperature without lubrication. During the rolling process, the rotational speeds of the upper and lower rolls with the same diameter of 130 mm were kept constant at 75 and 50 rpm, respectively. So that the rotational speed ratio of the upper and lower rolls was maintained at a constant value of 1.5 since this speed ratio is most efficient for grain refinement by shear deformation on the basis of a prior study.Reference Li, Fu, Fu and Shan22
B. Material characterization
The high purity Al and 5 wt% TiB2–Al composites, both in the as-cast and ASR processed conditions, were characterized by using a ZEISS Axio Imager A2m metallographic microscope. An etchant solution consisting of 2 mL HF, 5 mL HNO3, 3 mL HCl, and 90 mL H2O was used to etch the as-cast pure Al samples machined from the central region of the castings. The UFG structure of the ASR processed pure Al and 5 wt% TiB2–Al composites was investigated using a JEM-2100F field emission transmission electron microscope (TEM) operating at 200 kV. The location and size distribution of in situ nano-TiB2 particulates were also investigated by TEM observations combined with the energy-dispersive x-ray spectroscopy (EDS) analysis. The observed sections for TEM were perpendicular to the normal direction of the rolled samples. The TEM samples were prepared by mechanical grinding of the thin disks to a thickness of about 60 μm. Further thinning was carried out by a twin-jet electropolisher and the parameters were as follows: perchloric acid 50 mL/L, ethanol 950 mL/L, voltage 15 V, and temperature 243 K. X-ray diffraction (XRD) analyses were performed using Cu Kα radiation on a Shimadzu XRD-6000 diffraction instrument (Shimadzu Corporation, Kyoto, Japan) operating at 40 kV and 40 mA between 20 and 90° (2θ) at a step size of 0.02° and a counting time of 2 s per step. Profile analyses of XRD patterns were carried out to calculate the dislocation density in the pure Al and Al matrix of the composites for various processing conditions at room temperature. The diffraction profiles used for analysis were (111), (200), (220), and (311) reflections of the Al. The full width at half maximum (FWHM) measured from each peak after subtraction of instrumental broadening was substituted into the modified Williamson–Hall equationReference Ungár24:
 $$\Delta K \cong {\alpha \over D} + \left( {{{\pi T{b^2}} \over 2}} \right){\rho ^{1/2}}{K^2}\bar C + O\left( {{K^4}{{\bar C}^2}} \right)\quad {\rm{,}}$$
where  $K = {{2\sin \theta } \mathord{\left/ {\vphantom {{2\sin \theta } \lambda }} \right. \kern-\nulldelimiterspace} \lambda }$,
 $\Delta K = {{2\cos \theta \left( {\Delta \theta } \right)} \mathord{\left/ {\vphantom {{2\cos \theta \left( {\Delta \theta } \right)} \lambda }} \right. \kern-\nulldelimiterspace} \lambda }$, here θ, λ and Δθ are the diffraction angle, wave length of the x-rays and FWHM, respectively. α is 0.9 for the FWHM or 1 for the integral breadth. D, b, and ρ represent the average grain size, the magnitude of the Burgers vector, and the dislocation density, respectively. T is a constant depending on the effective outer cut-off radius of dislocations.Reference Ungar, Gubicza, Ribarik and Borbely25O is defined in terms of higher order terms in
 ${K^2}\bar C$ and
 $\bar C$ is the average dislocation contrast factor.Reference Ungar, Dragomir, Revesz and Borbely26 During the calculation, dislocations with a Burgers vector of the type
 ${a \mathord{\left/ {\vphantom {a {2\langle 110\rangle }}} \right. \kern-\nulldelimiterspace} {2\langle 110\rangle }}$ in Al were considered,Reference Seidman, Marquis and Dunand27 and thereby the magnitude of the Burgers vector was determined to be 0.286 nm.
The tensile testing specimens were sectioned along the longitudinal rolling direction by electrical discharge machining (EDM). The gage length and width of the tensile specimens were 25 mm (1.0 inch) and 6 mm (0.25 inch), respectively, with dimensions consistent with ASTM E8/E8M standard for rectangular tension test specimens. Tensile tests at ambient temperature were carried out using a Zwick/Roell Z020 testing machine (Zwick Roell Group, Ulm, Germany) at a strain rate of 1 × 10⁻³ s−1. 0.2% proof stress was used as yield strength.
III. RESULTS
A. Microstructures
1. OM analyses
The typical OM images of Al and 5 wt% TiB2–Al composites with different processing conditions are shown in Fig. 2. The initial as-cast pure Al exhibited an elongated coarse grain morphology with an average width of approximately 550 μm and a length exceeding 6000 μm. In contrast, the as-cast 5 wt% TiB2–Al composite exhibited an equiaxed grain morphology of Al matrix with an average size of 95 μm. The TiB2 particulates in the as-cast composite were mostly segregated at Al grain boundaries, rendering analysis of the size distribution difficult. However, the size distribution of the particulates was investigated further by TEM analysis after ASR since the spatial distribution of TiB2 particulates were redistributed after ASR as shown in a subsequent section.
OM images of (a) as-received pure Al; (b) initial 5 wt% TiB2–Al composite; (c) and (d) ASRed 5 wt% TiB2–Al composite with reduction ratios of 60 and 80%, respectively (transverse observation direction). SSD refers to the shear stress direction.
Following ASR with a reduction ratio of 60%, as shown in Fig. 2(c), the shear deformation of Al matrix grains in the composite is evident since the TiB2 particulates were displaced with the initial coarse grain boundaries during deformation. The shear stress direction (SSD) was oriented about 15° to the RD when the reduction ratio was 60% [Fig. 2(c)]. As the reduction ratio increased to 80%, the angle between SSD and RD decreased to an extremely small value that is near to zero [Fig. 2(d)]. It is worth noting that the distribution of TiB2 particulates became increasingly uniform with increasing ASR reduction ratio.
2. TEM analyses
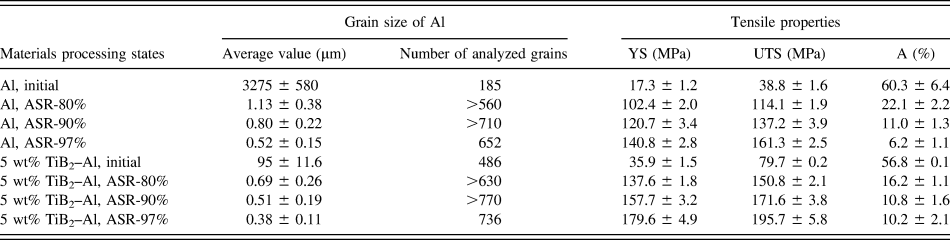
Typical TEM images of UFG pure Al and 5 wt% TiB2 reinforced UFG Al with an ASR reduction ratio of 97% are shown in Figs. 3(a) and 3(b), respectively. Both materials show an equiaxed Al grain morphology for the RD–TD orientation and their grain size distribution is unimodal [Figs. 3(e) and 3(f)]. The EDS analysis in Fig. 3(c) for the TiB2 nanoparticulates in composite samples shows the presence of elemental Ti, although B was not detectable by EDS. As illustrated by arrows in Fig. 3(b), some particulates show a nearly hexagonal morphology, but most of the observed particulates reveal a plate like morphology, which is dependent on the viewing angle to the TiB2 particulates.Reference Schumacher, Greer, Worth, Evans, Kearns, Fisher and Green28 By measuring the sizes of more than one thousand nanoparticulates, the size distribution of TiB2 particulates was established, as shown in Fig. 3(d). The data show that the sizes of the TiB2 particulates primarily fall in the range of 20–80 nm and that the corresponding average value is approximately 50 nm. Interestingly, most nano-TiB2 particulates in the composite processed with an ASR reduction ratio of 97% were located intragranularly in the Al matrix [Fig. 3(b)]; this contrasts results in the as-cast composite, where the particles were segregated at grain boundaries [Fig. 2(b)].
TEM images of pure UFG Al (a) and 5 wt% TiB2 reinforced UFG Al composite (b) with an ASR reduction ratio of 97%; EDS analyses of nano-TiB2 particulates (c) in the TEM image (b); particulate size distribution in composite (d); grain size distributions (GSDs) in UFG pure Al (e) and TiB2 reinforced UFG Al (f) with an ASR reduction ratio of 97%. The nano-TiB2 particulates were indicated by arrowheads. The GSDs were obtained from multiple TEM images of the corresponding samples and the average grain size as well as the number of analyzed grains is listed in Table II.
For comparison purposes, the Al grain sizes corresponding to both pure Al and composite samples with different processing conditions are listed in Table II. Evidently, the Al grain sizes in both the pure Al and the composites significantly decreased with increasing ASR reduction ratio. Specifically, the value of Al grain size in pure Al with an ASR reduction ratio of 80% is 1.13 μm, which is significantly smaller than that corresponding to the initial Al (3275 μm by averaging the length and width of the elongated grains). Correspondingly, the value of Al grain size in the 5 wt% TiB2 reinforced Al composites with an ASR reduction ratio of 80% is 0.69 μm, which is also significantly smaller than that corresponding to the as-cast composites (95 μm). As the ASR reduction ratio increased to 97%, the average Al grain size for the pure Al decreased to approximately 520 nm while that corresponding to the 5 wt% TiB2 reinforced Al composites decreased to nearly 380 nm. It should be noted that, under the same processing conditions, the grain sizes of Al in the composites are finer than those corresponding to pure Al.
Al grain sizes and tensile properties of samples with different processing conditions.
3. XRD analyses
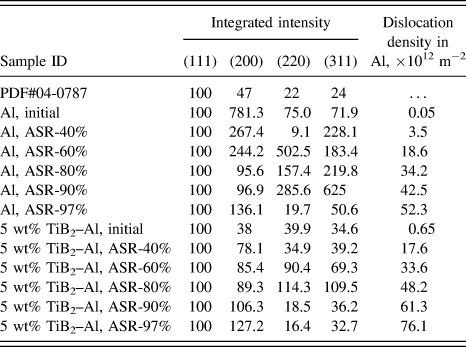
Figures 4 and 5 show the XRD patterns of pure Al and 5 wt% TiB2–Al composite processed using different ASR reduction ratios, respectively. There were no phase transformations observed after ASR for all of the samples studied herein. However, the relative intensity of diffraction peaks reveals obvious changes for samples with different reduction ratios, suggesting variations in the preferred orientation in ASR samples. For comparison purposes, the integrated intensity ratios of diffraction peaks (the integrated intensity of each peak divided by the integrated intensity of (111) peak in the same pattern, then multiplied by 100) are listed in Table III. The data show that the integrated intensity ratios of the (200) peak of the initial pure Al are significantly higher than the data from JCPDS card 04-0787, and suggest a strong preferred orientation along (200) planes. Following an ASR reduction ratio of 40%, there is a preferred orientation along the (311) planes. The strongest preferred orientation is along (220) planes when the reduction ratio increased to 60%. Eventually when the reduction ratio reached a maximum value of 97%, the strongest preferred orientation noted was along (200) plane, which also corresponds to the strongest preferred orientation in as-cast pure Al. For the as-cast (initial) 5 wt% TiB2–Al composites, it can be seen from Fig. 5(a) and Table III that there are no significant preferred orientations. Interestingly, both pure Al and 5 wt% TiB2–Al composites with an ASR reduction ratio of 97% showed the same preferred orientation along the (200) crystal plane.
XRD patterns of pure Al samples with different ASR reduction ratios.
XRD patterns of 5 wt% TiB2–Al composite samples with different ASR reduction ratios.
Integrated intensity ratios of diffraction peaks and calculated dislocation density of the samples with different processing conditions.
The dislocation densities in pure Al and Al matrix of composites with different processing conditions, as determined on the basis of profile analysis of XRD patterns, are also summarized in Table III. It is clear that dislocation density increased with increasing ASR reduction ratio for both the pure Al and the matrix of the Al composite. Interestingly, the dislocation density in as-cast and ASR processed composite is higher than that corresponding to pure Al for the same processing conditions, suggesting that the in situ TiB2 nanoparticulates induced an increase in dislocation density in the Al matrix during processing, which will be discussed in a subsequent section.
B. Tensile behavior
The representative engineering tensile stress–strain curves for pure Al samples with different ASR reduction ratios are shown in Fig. 6. The average values of tensile properties are summarized in Table II. It is clear that the ASR processed pure Al exhibited higher yield strength (σy) and ultimate tensile strength (σu) but lower elongation than those corresponding to the as-cast pure Al. Specifically, the average values of σy and σu for pure Al with an ASR reduction ratio of 80% are 102.4 and 114.1 MPa, respectively, which are approximately 400 and 180% greater, respectively, than those corresponding to the initial pure Al (20.3 and 40.8 MPa). However, the average elongation of pure Al with an ASR reduction ratio of 80 is 22.1%, which is approximately 63% lower than that corresponding to the initial pure Al (60.3%). The values of σy and σu for pure Al further increased and the elongation continually decreased with increasing ASR reduction ratio. Eventually as the ASR reduction ratio increased to 97%, the average values of σy and σu for pure Al are 140.8 and 161.3 MPa, respectively, which are approximately 600 and 300% higher, respectively, than those of as-cast pure Al. Moreover, the average elongation decreased to 6.2%, which is approximately 90% lower than that corresponding to as-cast pure Al.
Tensile stress–strain curves of pure Al samples with different ASR reduction ratios.
Figure 7 shows the representative engineering tensile stress–strain curves for 5 wt% TiB2 reinforced Al composites with different ASR reduction ratios. The average values of the tensile properties are also summarized in Table II. For comparison purposes, variations of the values for σu and elongation of the pure Al and composites are plotted and shown in Fig. 8. The average values of σy and σu for the as-cast TiB2–Al composite are 35.9 and 79.7 MPa, respectively, which are approximately 77 and 95% higher, respectively, than those corresponding to as-cast pure Al. More importantly, the initial as-cast TiB2–Al composite exhibited a high elongation value (56.8%), which is comparable to that corresponding to initial as-cast pure Al (60.3%), showing a high ductility with significantly improved strength. After ASR processing with a reduction ratio of 80%, the average values of σy and σu for the composite increased to 137.6 and 150.8 MPa, respectively, whereas the average elongation decreased to 16.2%. As the ASR reduction ratio finally increased to 97%, the average values of σy and σu for the composite reached 179.6 and 195.7 MPa, respectively, which are approximately 28 and 21% higher than those corresponding to UFG pure Al with the same ASR reduction ratio. It is worth noting that the elongation of the nano-TiB2 reinforced UFG Al composite with an ASR reduction ratio of 97% exhibited a relatively high elongation of 10.2%, which is approximately 65% higher than that corresponding to UFG pure Al (6.2%) for the same ASR reduction ratio. This suggests that when the Al grain is refined to the ultrafine regime, the in situ nanoreinforcements prompt an increase in elongation of the composites; the underlying mechanisms thought to be responsible for this phenomenon will be discussed in a subsequent section.
Tensile stress–strain curves of 5 wt% TiB2–Al composite samples with different ASR reduction ratios.
Variations of σu and elongation of pure Al and 5 wt% TiB2–Al composites with different ASR reduction ratios.
IV. DISCUSSION
A. Role of nanoparticulates on microstructure evolution
As described in Sec. III. A. 1, in the as-cast condition, the Al grain size in the TiB2–Al composite (95 μm) is significantly smaller than that corresponding to pure Al material (550 μm in width) even though they were processed under the same conditions. This suggests that the in situ TiB2 particulates in the composites suppressed the growth of Al grains during casting, which is consistent with the fact that the TiB2 particulates were primarily distributed along the Al grain boundaries in the initial, as-cast condition. Available published results consistently show that the introduction of nanoparticulates into a metal matrix, either by liquid- or solid-state processing, leads to a grain refinement of the metal matrix mainly via a mechanism of grain growth inhibition.Reference Kim, Sohn, Nezafati, Ferguson, Schultz, Bajestani-Gohari, Rohatgi and Cho29–Reference Schultz, Ferguson and Rohatgi31 It is also interesting to note that the dislocation density in the as-cast composite is higher than that corresponding to as-cast pure Al as described in Sec. III. A. 3. This phenomenon is primarily attributed to the difference between the coefficients of thermal expansion (CTE) of Al and TiB2 [approximately 19.3 × 10⁻⁶ K−1 (Ref. Reference Tjong and Tam32)] which generates sufficient stress to nucleate dislocations at the Al/TiB2 interface during cooling from the casting temperature.Reference Vogelsang, Arsenault and Fisher33 Moreover, the higher density of grain boundaries in the composite will also contribute to a higher dislocation density as grain boundary dislocations nucleate from the lattice mismatch between neighboring grains.Reference Evers, Brekelmans and Geers34
Following ASR, the grain sizes of the Al composites were consistently smaller than those corresponding to pure Al for the same ASR reduction ratio. This behavior is primarily attributed to the fact that the Al grain size in the initial as-cast composite prior to ASR was smaller than that corresponding to pure Al. As described above, the composites exhibit higher dislocation densities relative to pure Al for identical ASR reduction ratios. The higher dislocation densities of the composite materials studied can be rationalized on the basis of “geometrically necessary dislocations (GNDs)” as described by Ashby.Reference Ashby35 GNDs develop to allow compatible deformation of a system with geometrical constraints, such as hard particulates embedded in a ductile matrix.Reference Ashby35 GNDs are required for the ductile matrix to deform without the formation of voids around the hard particulates. Accordingly, GNDs formed during ASR deformation are likely to be responsible for the observed increase in dislocation densities in the TiB2–Al composites.
B. Strengthening mechanisms
As described above, dislocation densities in the pure Al and the matrix of Al composite increased with increasing ASR reduction ratio. It has been well established that an increase in dislocation density in a metal will increase yield strength due to the interactions between dislocations which retard their motion.Reference Courtney36 The increment of σy resulting from dislocation strengthening (ΔσD) can be expressed by the Bailey–Hirsch relationshipReference Courtney36,Reference Bailey and Hirsch37 :
 $$\Delta {\sigma _{\rm{D}}} = M\alpha Gb{\rho ^{1/2}}\quad {\rm{,}}$$
where M, α, and G are mean orientation factor, material constant, and shear modulus, respectively. According to the parameters listed in Refs. Reference Ma, Wen, Hu, Topping, Isheim, Seidman, Lavernia and Schoenung6,Reference Redsten, Klier, Brown and Dunand38, M, α, and G for the Al matrix in the present study are assumed to be 3.06, 0.2, and 23.4 GPa, respectively. On the basis of Eq. (2) and the values of dislocation densities in Table III, ΔσD for both pure Al and composites with different processing conditions were calculated and summarized in Table IV. It is evident that the magnitude of ΔσD increased during ASR, mostly due to a significant increase in dislocation density during deformation. It follows that dislocations contribute significantly to strengthening of the ASR processed pure Al and composites, since the corresponding value of ΔσD reached approximately 20% of σy.
Calculated ΔσD for both pure Al and composites with different processing conditions.
In addition, grain refinement will create a high volumetric density of grain boundaries that impede dislocation motion and increase the amount of applied stress necessary to move a dislocation across a grain boundary, and thereby leads to the Hall–Petch strengthening.Reference Li, Fu, Fu and Shan22 It is well known that the effect of average grain size (D) on yield strength (σy) of polycrystalline metals can be estimated by the Hall–Petch equationReference Hall39:
 $${\sigma _{\rm{y}}} = {\sigma _0} + {k_{\rm{y}}}{D^{ - 1/2}}\quad {\rm{,}}$$
where σ0 and k y are experimentally determined parameters. Specifically, the parameter σ0 represents the value of σy for a single crystal in the absence of any strengthening mechanisms other than solid solution strengthening while the parameter k y is associated with the magnitude by which crystal boundaries in a polycrystalline metal material resist slip.Reference Kim, Sohn, Nezafati, Ferguson, Schultz, Bajestani-Gohari, Rohatgi and Cho29,Reference Smith and Hashemi40 According to the physical meaning of these parameters, the Hall–Petch relationship for pure Al and TiB2–Al composites with different dislocation densities is evaluated by subtracting the effect of dislocation strengthening in this study. Accordingly, the dependence of (σy − ΔσD) on  ${D^{ - 1/2}}$ is shown in Fig. 9. For comparison purposes, the Hall–Petch relationship for the commercially pure (CP) Al materials studied by Yu et al.Reference Yu, Kao and Chang41 and Tsuji et al.Reference Tsuji, Ito, Saito and Minamino42 are also shown in Fig. 9. It can be seen that the Hall–Petch equation provides an accurate fit to the stress values (σy − ΔσD) and the average grain size D for both high purity Al and TiB2–Al composites, suggesting that grain boundary strengthening plays an important role on the strengthening of both pure Al and composites. It should be pointed out that a breakdown of Hall–Petch relationship is expected to occur for grain sizes below 10 nm for most metals because grains are unable to support dislocation pile-ups.Reference Carlton and Ferreira43,Reference Nieh and Wadsworth44 However, this phenomenon was not observed in the present study because all the Al grain sizes are larger than 300 nm. In our study, the value of σ0 for TiB2–Al composites is 9.58 MPa, which is higher than that corresponding to the high purity Al. As discussed above, only solid solution strengthening in a single crystal is represented in σ0 value. Therefore, the increase of σ0 value is likely to be ascribed to the presence of a very small amount of Ti and B as solutes in the matrix of the composites. On the other hand, the value of k y for TiB2–Al composites is 0.003 MPa m−1/2, which is higher than that corresponding to high purity Al, which can be attributed to some other strengthening mechanisms. It has been well established that the resistance of nonshearable nanoparticulates in the composites against the motion of dislocations during deformation will lead to Orowan strengthening which is sometimes called second-phase particulate strengthening.Reference Kim, Sohn, Nezafati, Ferguson, Schultz, Bajestani-Gohari, Rohatgi and Cho29,Reference Smith and Hashemi40 In the present study, if Orowan strengthening plays a role in the composites, it is most likely to appear in the composites with ASR reduction ratios of 80, 90, and 97% due to the increased uniformity of spatial distribution. From above, the contribution would be
 $0.003{D^{ - 1/2}}$, which corresponds to an increase in σy of 3.6, 4.2, and 4.9 MPa, respectively, for composites with ASR reduction ratios of 80, 90, and 97%. These increases are not significant as compared to those corresponding to grain boundary strengthening and dislocation strengthening. Accordingly, there is no clear evidence that Orowan strengthening makes a significant contribution to the yield strength of the composites. In addition, as shown in Fig. 9, the two types of CP Al (AA1050 and JIS-1100) studied by previous researchers and the high purity Al as well as the TiB2–Al composites in this study reveal significantly different Hall–Petch behavior. In our work, the influence of dislocation strengthening is subtracted. In addition, the Hall–Petch behavior of pure Al significantly depends on the purity of the Al according to the study by Hansen.Reference Hansen45 It should also be noted from Fig. 9 that the CP Al materials exhibit higher strength than that of high purity Al and the TiB2–Al composites in our study, especially when the grain sizes fall within the ultrafine regime (<1 μm). This observation suggests that alloying elements (or solutes) are more effective than the nanoparticles in enhancing the mechanical performance of pure Al studied herein.
Hall–Petch relationships in different Al materials.
C. Improved elongation in nano-TiB2 reinforced UFG Al
As described in Sec. III. B, the average elongation (total value to failure) of both composites and pure Al decreased with decreasing grain size (corresponding to increasing ASR reduction ratio). In fact, most SPD processed UFG materials are characterized by a low value of uniform elongation as compared to their coarse-grained counterparts.Reference Li, Fu, Fu and Shan22 This trend of low uniform elongation in UFG materials has been attributed to the formation of a plastic instability during deformation which leads to macroscopic neckingReference Takata, Ohtake, Kita, Kitagawa and Tsuji46 and can be understood on the basis of Considère's criteriaReference Yu, Kao and Chang41,Reference Takata, Ohtake, Kita, Kitagawa and Tsuji46 :
 $${\left( {{{\partial \sigma } \over {\partial \varepsilon }}} \right)_{\dot \varepsilon }} \le \sigma \quad {\rm{,}}$$
where σ and ε are true flow stress and true strain, respectively, therefore  ${{\partial \sigma } \mathord{\left/ {\vphantom {{\partial \sigma } {\partial \dot \varepsilon }}} \right. \kern-\nulldelimiterspace} {\partial \dot \varepsilon }}$ is the strain-hardening rate.
 $\dot \varepsilon$ is the strain rate during tensile testing. In principle, plastic instability starts when the strain-hardening rate coincides with the flow stress during a tensile test. In the case of the ASR processed pure Al, grain refinement leads to a significant increase in flow stress (as discussed in Sec. IV. B). However, the work hardening rate decreased with decreasing grain size, which is consistent with the limited uniform elongation and total elongation values, which were lower than those of the coarse-grained counterparts.
Interestingly, as shown in Sec. III. B. 1, the nano-TiB2 reinforced UFG Al composite with a matrix grain size of approximately 380 nm (ASR reduction ratio of 97%) exhibited a higher elongation relative to that corresponding to UFG pure Al with a grain size of approximately 520 nm (for the same ASR reduction ratio of 97%), suggesting that the in situ nanoreinforcements prompt an increase in elongation, despite the presence of UFGs. According to Eq. (4), if the strain-hardening rate  $\left( {\partial \sigma /\partial \varepsilon } \right)$ can be increased, the plastic instability will be relieved, that is, the elongation will increase. In fact, research work by Takata et al.Reference Takata, Ohtake, Kita, Kitagawa and Tsuji46 has suggested that introducing fine second-phase particulates within the UFG Cu–Cr–Zr alloy can enhance the strain hardening rate and improve the elongation of an UFG material. In related early studies, KochReference Koch47 also proposed that second-phase particulates are likely to positively influence ductility (e.g., percent elongation to failure) and strength in NS and UFG materials. In these studies, it was proposed that the presence of particles will lead to an increase in dislocation density which enhances strain-hardening.Reference Takata, Ohtake, Kita, Kitagawa and Tsuji46 This suggestion is consistent with our results. Moreover, it is worth noting that the enhanced spatial dispersion of nano-TiB2 particulates (as described in Sec. III. A. 1) in the composite with an ASR reduction ratio of 97% is also likely to contribute to the uniform deformation of the material during tensile testing.
V. CONCLUSIONS
(1) The nano-TiB2 particulate reinforced UFG Al composite prepared by combined FAS and ASR processing reveals an average matrix grain size of 380 nm, which is smaller than that for pure Al for the same ASR reduction ratio of 97%. The TiB2 particulates exhibit an average size of approximately 50 nm. Dislocation density in MMNCs is higher than that corresponding to pure Al for the same processing conditions.
(2) The average values of σy and σu for in situ nano-TiB2 particulate reinforced UFG Al composite with an ASR reduction ratio of 97% are approximately 9 and 5 times higher to those of the initial as-cast pure Al, respectively. Both grain refinement and dislocations play primary roles on the strengthening of the ASR processed composites and pure Al. There is no clear evidence that Orowan strengthening makes a significant contribution to the yield strength of the MMNCs.
(3) The nano-TiB2 particulate reinforced UFG Al composite exhibited a higher elongation than that corresponding to the UFG pure Al for the same ASR reduction ratio of 97%, suggesting that the in situ nanoreinforcements prompt an increase in elongation. This behavior was proposed to be attributed to an increase in dislocation density when in situ nanoparticulates were introduced in the UFG Al matrix.
ACKNOWLEDGMENTS
The authors (ZL, DC, HW, and AS) would like to acknowledge support from the National Natural Science Foundation of China (50671062) and the Aerospace Foundation of Shanghai (HTJ10-17). The financial support (ZL and EJL) from the US National Science Foundation (NSF DMR-1210437) is also gratefully appreciated. Furthermore, the author (ZL) would like to thank the financial support from the China Scholarship Council (No. 201306230030).