I. INTRODUCTION
Undercooled solidification is characterized by high growth rates of the solid, which are several orders of magnitude greater than those in conventional solidification. High undercooling is achieved by methods such as glass slag technique Reference Zhang, Liu, Xu and Yang1,Reference Koseki2 and levitation melting, Reference Koseki2–Reference Bassler, Hofmeister, Bayuzick, Gorenflo, Bergman and Stockum5 where the nucleation of the solid is difficult due to the absence of nucleation catalysts, so that the liquid can be undercooled to temperatures far below the equilibrium liquidus, and once solidification starts in this highly undercooled melt, the growth of the solid is almost instantaneous due to a strong thermodynamic driving force for crystallization. Reference Koseki2
Accordingly, some phenomena, such as metastable reactions, occur during undercooled solidification. Reference Koseki2,Reference Nagashio, Kuribayashi and Takamura3 And some special products, e.g., refined grain and metastable solids, can be obtained; such metastable solids range from metastable crystalline phases over supersaturated solid solutions and grain-refined alloys to disordered superlattice structures in intermetallic compounds. Reference Biswas, Phanikumar, Chattopadhyay, Volkmann, Funke, Holland-Moritz and Herlach6,Reference Chen, Yang, Liu, Liu, Xie and Zhou7 For eutectic alloy, with increasing undercooling, two transitions often take place: (i) the transition from lamellar eutectic colony to anomalous eutectic colony, such as Co–Sb Reference Wei, Herlach, Feuerbacher and Sommer8 and Ni–Sn Reference Li, Li, Liu and Lu9 alloys and (ii) the transition from stable phase to metastable phase, such as Fe–B Reference Yang, Liu, Yang, Chen, Liu and Zhou10 and Ni–Nb Reference Leonhardt, Loser and Lindenkreuz11 alloys.
As a eutectic alloy, Ni–Ni3B alloy also has the transition from lamellar eutectic to anomalous eutectic. In addition, the transition from stable phase to metastable phase occurs upon undercooled solidification of Ni–Ni3B alloy. Reference Xu, Liu and Dang12 Our previous study has shown that a competitive nucleation between Ni23B6 and Ni3B leads to a critical undercooling (125 K < ΔT* < 157 K), for the metastable/stable eutectic formation. Reference Xu, Liu and Dang12 However, experimental data for solidification kinetics of Ni–Ni3B alloys are still lacking, and effects of the solidification kinetics on the final structure are not clear yet, Reference Masoud, Ali, Mahboobeh, Roohallah and Saber13–Reference Battezzati, Antonione and Baricco18 so the present study is mainly focused on the study of solidification kinetics.
High-speed video (HSV) recording is a good way to observe the solidification process. Reference Bassler, Hofmeister, Bayuzick, Gorenflo, Bergman and Stockum5 From HSV images, it is possible to verify the movement of the solidification interface across the surface of the solidified sample. The images not only provide a means of observing the thermal fields present in a fluxing sample but also resolve clearly the temperature differences on the order of 10 K. A potential application of the imaging system is to measure the average velocity of the dendrite tip. Reference Bassler, Hofmeister, Bayuzick, Gorenflo, Bergman and Stockum5 By HSV, Aoyama et al. Reference Aoyama and Kuribayashi19 observed the solid–liquid interface of highly pure Si and Ge growth, where the growth mechanisms are classified into three categories, i.e., lateral, continuous, and successive at low, moderate, and high undercooling values, respectively. By using HSV, Nagashio et al., Reference Nagashio, Li and Kuribayashi20 Nozaki et al., Reference Nozaki, Nagashio and Kuribayashi21 and Löser et al. Reference Löser, Woodcock, Shuleshova, Hermann, Lindenkreuz, Gehrmann, Schneider and Volkmann22 studied the metastable phase formation upon solidification of Nd2Fe14B, Fe2Si5, and Fe–Ni melts.
Furthermore, cooling curve recording by a pyrometer is another way to observe the solidification behavior. In the early 1980s, Levi and Mehrabian Reference Levi and Mehrabian23,Reference Levi and Mehrabian24 interpreted the relationship among the solid fraction, the enthalpy heat, the specific heat, and the cooling curve. On this basis, a lot of work arising from observation of cooling curves have been performed, e.g., Barth et al. Reference Barth, Joo, Wei and Herlach25 predicted the latent and the specific heats of undercooled nickel and iron melts, Çetin and Kalkanli Reference Çetin and Kalkanli26 evaluated the latent heats of primary and eutectic solidification of gray cast iron, and Gibbs et al. Reference Gibbs, Kaufman, Hackenberg and Mendez27,Reference Gibbs and Mendez28 calculated the solid fraction of Al–9.5Si alloy using the equation-based Newtonian method. In the present study, our group has proposed a baseline method to predict the phase fractions of several eutectic alloys. Reference Xu, Liu, Xu and Chen29
The effect of undercooling on the solidification velocity is a hot topic for solidification kinetics. Reference Koseki2–Reference Biswas, Phanikumar, Chattopadhyay, Volkmann, Funke, Holland-Moritz and Herlach6,Reference Wei, Herlach, Feuerbacher and Sommer8,Reference Leonhardt, Loser and Lindenkreuz11 Recently, based on the work on single-step solidification, attention has been paid upon dealing with multi-step phase transformations, e.g., Krivilyov et al. studied experimentally and theoretically the effect of competitive nucleation on phase selection in rapid solidification of Nd2Fe14B alloy in drop tube processing. Their studies allow prediction of the appropriate processing conditions to optimize the magnetic properties of the as-solidified Nd–Fe–B samples by reducing the amount of α-Fe that forms during solidification. Reference Krivilyov, Volkmann, Gao and Fransaer30 Tourret et al. Reference Tourret, Gandin, Volkmann and Herlach31 proposed a model description of multiple phase transformations, which had been used to describe the rapid solidification of Al75Ni25 alloy by electro-magnetic levitation experiment. Nevertheless, the experimental study of solidification velocity and solidification interface morphology for multi-step phase transformations is still lacking, which, as the experimental evidence for the model of multi-step solidification, plays a key role in the corresponding kinetic study. Regarding this, the multi-step solidification behavior of undercooled hypoeutectic Ni–3.3 wt% B alloy will be herein investigated using a glass slag technique with a high-speed pyrometer and HSV instrumentation. Effects of the undercoolings on the cooling curves, the microstructures, and the solidification interfaces will be discussed.
II. EXPERIMENTS
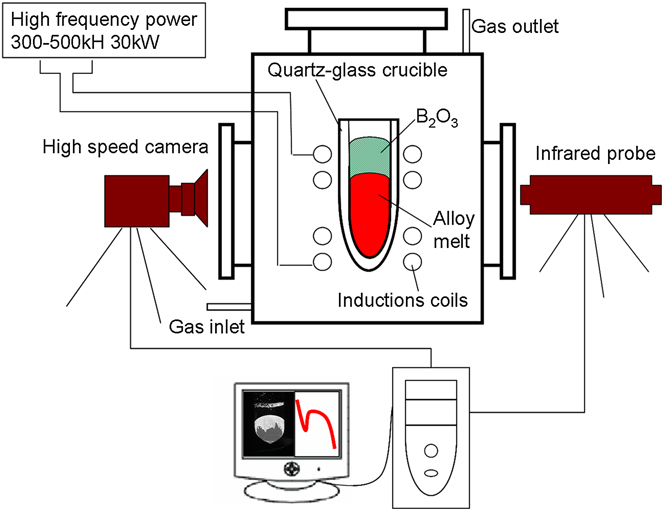
To investigate the transformation of Ni–Ni3B alloy, 100 g hypoeutectic alloy, mixed with high purity Ni (99.98 wt%) blocks and B (99.7 wt%) powder, was arc-melted in the argon atmosphere using a nonconsumable tungsten electrode. This operation was repeated several times to ensure the homogenization of the sample. And then, the concentration of the sample was measured to be Ni–3.3 wt% B alloy by the inductively coupled plasma atomic emission spectroscopy technique. A schematic of the apparatus for glass fluxing experiment is shown in Fig. 1. The sample (Ni–3.3 wt% B) weighed about 4 g, together with some pieces of B2O3 glass, was placed into a quartz-glass crucible, which was placed in the middle-position of the high frequency induction coil located in a vacuum chamber. After the vacuum chamber was evacuated to 1 × 10⁻⁶ mbar and backfilled to 600 mbar with high purity Ar gas, the sample was overheated at a temperature of 100–300 K above the liquidus temperature (T m = 1450 K Reference Xu, Liu and Dang12 ) for some time and then cooled down. This process is repeated cyclically until a desired undercooling is available. Thermal history of every sample was monitored by a one-color pyrometer. The relative accuracy and response time are 10 K and 2 ms, respectively. For revealing what actually occurred during the rapid solidification, an HSV instrumentation system with a high resolution of 1280 × 1024 pixels, OLYMPUS I-Speed 3 MONO (State Key Laboratory of Solidification Processing, Northwestern Polytechnic University, Xi'an Shaanxi, P.R. China), was used to observe the recalescence process for each transformation. The instrumentation was focused on the sample surface in a frontal view. Moreover, for morphology observation, a solution consisting of 5 g FeCl3, 10 mL HCl, and 50 mL H2O was used to etch the as-solidified specimens. The phase constitution was identified by an optical microscope and a scanning electron microscope (SEM).
Schematic of apparatus used for undercooled experiment consisting of a glass fluxing furnace, a high-speed pyrometer and a HSV. The images of HSV are acquired at 103 to 105 frame/s. The inside diameter of the quartz crucible is 8 mm.

III. RESULTS
A. Cooling curves
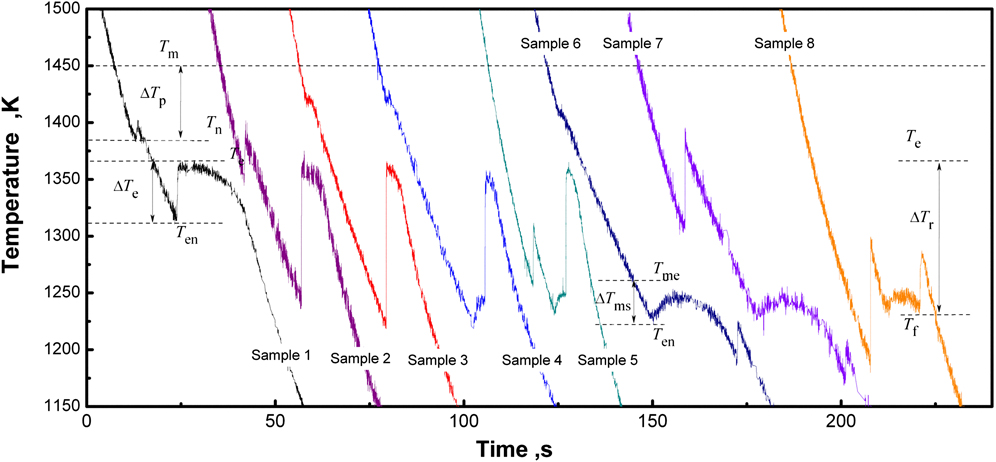
With the melt-fluxing technique, two kinds of cooling curves were observed for undercooled solidification of Ni–3.3 wt% B alloy (Fig. 2), where case I stands for the cooling curves of samples 1–3 (i.e., two recalescence peaks appearing in every cooling curve) and case II stands for the cooling curves of samples 4–8 (i.e., three recalescence peaks appearing in every cooling curve).
Cooling curves of hypoeutectic Ni–3.3 wt% B alloy corresponding to different undercoolings. Sample 1: ∆T p ∼ 42 K, ∆T e ∼ 93 K; sample 2: ∆T p ∼ 100 K, ∆T e ∼ 126 K; sample 3: ∆T p ∼ 35 K, ∆T e ∼ 145 K; sample 4: ∆T p ∼ 35 K, ∆T e ∼ 145 K (∆T ms = 40 K), ∆T r ∼ 124 K; sample 5: ∆T p ∼ 190 K, ∆T e ∼ 135 K (∆T ms = 30 K), and ∆T r ∼ 118 K; sample 6, ∆T p ∼ 35 K, ∆T e ∼ 145 K (∆T ms = 40 K), and ∆T r ∼ 180 K; sample 7, ∆T p ∼ 148 K, ∆T e ∼ 141 K(∆T ms = 36 K), and ∆T r ∼ 200 K; sample 8, ∆T p ∼ 262 K, ∆T e ∼ 143 K (∆T ms = 38 K), and ∆T r ∼ 135 K.
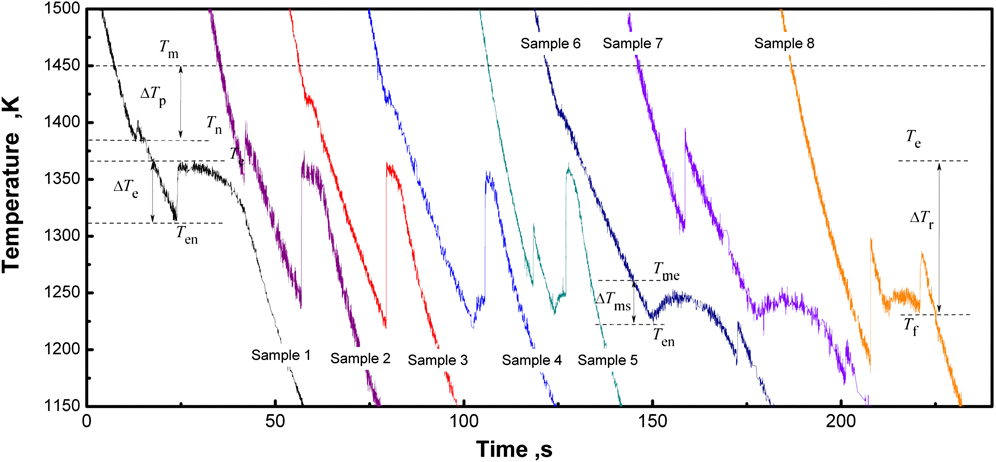
For case I, the undercooling for primary solidification ∆T p equals to the difference between the melting point, T m (1450 K), and the initial nucleation point, T n (Fig. 2); the undercooling for eutectic solidification (L→Ni3B/Ni) ∆T e equals to the difference between the equilibrium eutectic temperature, T e (1366 K), and the start-temperature for eutectic transformation, T en. For case II, the first recalescence corresponds also to the primary solidification, so the undercooling equals to ∆T p = T m − T n; the undercooling for the second recalescence can be defined as ∆T e = T e − T en, but due to the occurrence of metastable eutectic transformation, the actual undercooling for this transformation is accordingly given as ∆T ms = T me − T en, with T me (1261 K) and T en as the melting point of the metastable eutectic and the start-temperature for the second transformation, respectively (Fig. 2); for the third transformation, a eutectic reaction from the residual liquid, Lr→Ni3B/Ni (Lr is the residual liquid, see Sec. IV. A), can be assumed, so that the undercooling for this reaction is defined as ∆T r = T e − T f, with T f as the start-temperature for the third transformation (e.g., sample 6 of Fig. 2). Accordingly, solidification of the residual liquid is only involved in case II.
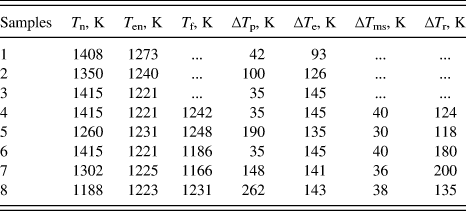
From the cooling curves of samples 1–8 (Fig. 2), the character temperatures and the undercoolings are measured, as listed in Table I. Since the glass slag technique is denucleating the sample surface heterogeneous nucleation by B2O3 glass to acquire the large undercooled melt, the change of the sample’s composition can be neglected, i.e., all the compositions are Ni–3.3 wt% B. In the present study, from the statistics of 57 samples in all, during solidification of Ni–3.3 wt% B alloy melt, if ∆T e < 140 ± 10 K, two recalescence peaks appear in the cooling curves, i.e., case I occurs (27 samples); if ∆T e ≥ 140 ± 10 K, three recalescence peaks appear in the cooling curves, i.e., case II occurs (30 samples).
The character temperatures for the transformations of samples 1–8.

B. Microstructure
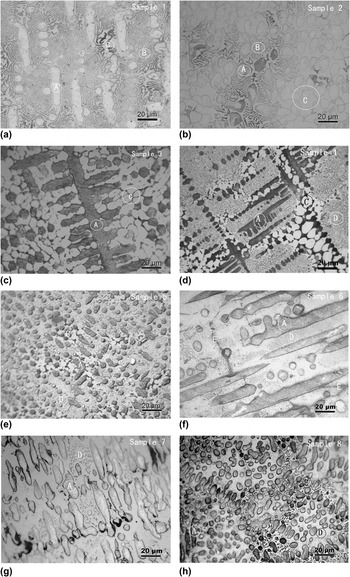
To study the as-solidified structures corresponding to the two types of cooling curves, optical microscope observations were performed. For case I, i.e., samples 1–3 [Figs. 3(a)–3(c)], the structure consists of primary phase (α-Ni), regular lamellar eutectic, and anomalous eutectic. For case II, i.e., samples 4–8 [Figs. 3(d)–3(h)], the structure consists of primary phase (α-Ni), dot-phase region (dot phases + matrix), and anomalous eutectic [Figs. 3(d) and 3(e)] or network boundary [network boundary can be seen as a shrunk structure of anomalous eutectic, the structure is shaped like grain boundary and is distributed as network, Figs. 3(f) and 3(g)].
As-solidified microstructures: (a)–(c) samples 1–3 with ∆T e < 140 ± 10 K and (d)–(h) samples 4–8 with ∆T e ≥ 140 ± 10 K. Points A are the dendritic phase α-Ni, points B the lamellar eutectic, points C the anomalous eutectic, points D the dot phases, and points E the network boundary.

For case I, the differences of the microstructures are mainly reflected by the size of the primary phase (α-Ni dendrite) and the fractions of the lamellar and the anomalous eutectics. For example, for ∆T p = 35 K (sample 3), the coarse α-Ni dendrite can be observed [Fig. 3(c)], but for ∆T p = 100 K (sample 2), only the fragmented granular α-Ni can be observed [Fig. 3(b)]. So the size of α-Ni dendrite depends on ∆T p, following a sequence of 35 K (sample 3) > 42 K (sample 1) > 100 K (sample 2). However, the fraction of the eutectic depends on ∆T e: the lamellar eutectic follows a sequence of 93 K (sample 1) > 126 K (sample 2) > 145 K (sample 3), whereas the anomalous eutectic follows a sequence of 93 K (sample 1) < 126 K (sample 2) < 145 K (sample 3). For case II, the differences are mainly reflected by the size of the primary phase, the fractions of the dot-phase region, and the anomalous eutectic (or the network boundary). From Figs. 3(d)–3(h), the size of α-Ni dendrite, depending on ∆T p, follows a sequence of 35 K (sample 4) > 35 K (sample 6) > 148 K (sample 7) > 190 K (sample 5) > 262 K (sample 8), the fraction of the dot-phase region, depending on ∆T r, follows a sequence of 200 K (sample 7) > 180 K (sample 6) > 135 K (sample 8) > 118 K (sample 5) > 124 K (sample 4), whereas the anomalous eutectic (or the network boundary), depending on ∆T r, follows a sequence of sample 4 > sample 5 > sample 8 > sample 6 > sample 7.
Accordingly, the microstructures for samples 1–8 can be summarized as follows: the larger ΔT p becomes, the smaller primary phase (α-Ni) is obtained; the larger ΔT e, the more anomalous eutectic and the less lamellar eutectic obtained; the larger ΔT r, the less anomalous eutectic (or the network boundary) obtained.
C. SEM study
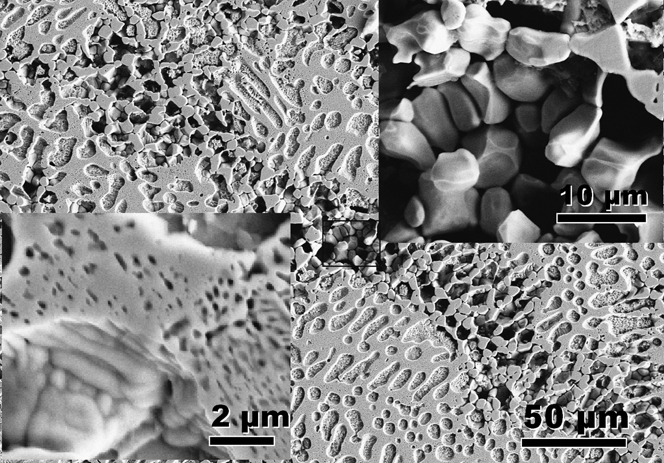
To show clearly the dot phases, our previous study has shown the SEM images of sample 6, Reference Xu, Liu and Dang12 and two kinds of dot phases can be observed. The dot phase with large size (>50 nm) and regular distribution is identified as the rod-eutectic, whereas that with small size (<20 nm) and irregular distribution is identified as the precipitate. To illustrate the effect of the isothermal stage of cooling curve on the dot phases, Fig. 4 shows the SEM image of sample 8. From the lower left inset of Fig. 4, the amount of regularly distributed dots of sample 8 becomes less than that of sample 6. Reference Xu, Liu and Dang12 This is consistent with the longer isothermal stage of sample 6 than that of sample 8, as observed in the second recalescence of the cooling curves (Fig. 2). That is to say, longer isothermal stage implies more regular dots. Generally, for eutectic alloy, the longer isothermal stage implies the more regular eutectic. So the regular dots with large sizes of samples 4–8 are confirmed as the regular rod-eutectic.
SEM image of as-solidified sample 8, and the magnification of the dot phases (lower left inset) and the network boundary (upper right inset).

The upper right inset of Fig. 4 shows a magnified image of the network boundary for sample 8 [Fig. 3(h)], where the alternate distribution of Ni3B and Ni phases, also as a common character of the anomalous eutectic observed for samples 3–7 [Figs. 3(c)–3(g)], confirms that the network boundary should actually be the anomalous eutectic.
D. HSV observation
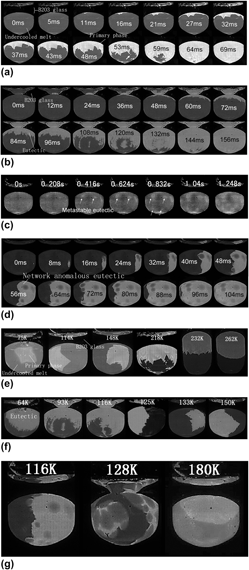
To study further the dendritic or eutectic growth kinetics, Figs. 5(a)–5(g) illustrate the morphology of the solidification interface subjected to different undercoolings, with the elapsed time labeled on the photograph. The light area in the image is the recalescing solid and the dark area is the undercooled liquid. To estimate the average velocity of the solidification interface, the distance and the time interval that the interface moved across the surface between two frames are measured; the distance divided by the time interval equals to the average velocity. Note that if the solidification front is planar (spherical), estimation of the averaged solidification velocity is correct, but if there are only few dendrites, which can grow under different angles to the surface, the error then results. For the present experiment, we try to find several fast (large) dendrite tips of each sample for average velocity measurement. The maximal relative uncertainty is ±10%, so we set ±10% as the error bar for measured solidification velocities (see Fig. 6).
HSV images of solidification: (a) primary solidification at ΔT p = 218 K; (b) eutectic solidification at ΔT e = 64 K; (c) metastable eutectic solidification at ΔT ms = 40 K; (d) residual liquid solidification at ΔT r = 116 K; (e) primary solidification with ΔT p = 75, 114, 148, 218, 232, and 262 K, respectively; (f) eutectic solidification with ΔT e = 64, 93, 116, 125, 133, and 150 K, respectively; (g) residual liquid solidification with ΔT r = 116, 128, and 180 K, respectively. The elapsed time for (a)–(d) or the undercoolings for (e)–(g) is indicated in the photographs.

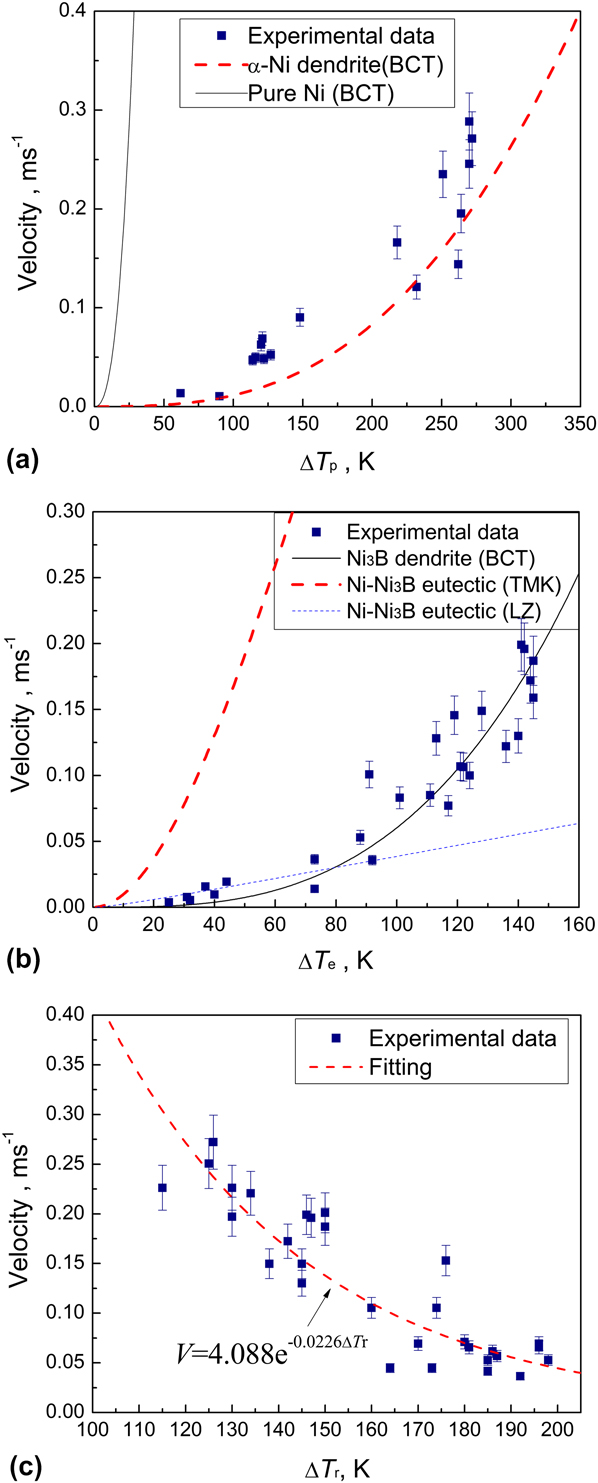
Growth velocity as a function of undercooling in the Ni–3.3 wt% B alloy melt for (a) the primary solidification, (b) the stable eutectic solidification, and (c) the residual liquid solidification, respectively. The solid squares are measured data, whereas the solid or dashed lines are calculated from theoretical models.

Figure 5(a) shows the morphology of the solidification interface for the primary solidification at ΔT p = 218 K, where many dendritic tips (at 53 ms) can be observed in front of the solidification interface and spread throughout the sample. This implies a continuous formation of nuclei upon primary solidification. The average growth velocity is about 0.0145 m/s.
Figure 5(b) shows the morphology of the solidification interface for the eutectic transformation (i.e., the second recalescence of case I) at ΔT e = 64 K, where it can be seen that many “dendrites” grow up gradually (84–120 ms). Analogous to Fig. 5(a), the continuous nucleation can be observed upon solidification. This strongly suggests, once a certain undercooling is given, the eutectic growth exhibits the dendritic morphology.
Figure 5(c) shows the morphology of the solidification interface for the metastable eutectic transformation (i.e., the second recalescence of case II) at ΔT e = 145 K or ΔT ms = 40 K. Although the solidification interface is not clear due to the small recalescence temperature (Fig. 2), the cluster-like profile growing up from small points can be observed. This implies a cluster-like growth of the metastable eutectic. As expected, the dot-phase regions in Figs. 3(d)–3(h) show a cluster-like distribution. So the HSV images confirm that the dot-phase region is from the metastable eutectic transformation.
Figure 5(d) shows the morphology of the interface for the residual liquid solidification at ΔT r = 116 K (i.e., the third recalescence of case II), where, many ring-like fronts with dark centers spread throughout the sample with an average velocity of 0.134 m/s. Note that the dark center of Fig. 5(d) corresponds exactly to the bright region of Fig. 5(c). On this basis, it can be inferred that, the center of the circle region has solidified in the second transformation, and thereafter, the residual liquid distributes in the grain boundaries of both the primary phase and the metastable eutectic. Upon solidification of the residual liquid, the bright grain boundaries can thus be observed and shown as many rings or the network. Following the HSV images, the third transformation corresponds to solidification of the residual liquid occurring at grain boundaries. As expected, the anomalous eutectic or the network boundary, as a product of the residual liquid solidification [Figs. 3(d)–3(h)], is similar to the morphology from the HSV images.
To show the effect of undercooling on the morphology of the solidification interface, the HSV images at a fixed time during the primary solidification but with different values of ΔT p (75, 114, 148, 218, 232, and 262 K) were shown in Fig. 5(e). With increasing undercooling, the solidification interface changes from single-dendritic unit to many-dendritic unit and to spherical-serration unit. The increase of unit number with undercooling indicates increased nucleation site and decreased dendrite size. Furthermore, the HSV images at a fixed time during the eutectic solidification but with different values of ΔT e (64, 93, 116, 125, 133, and 150 K) were obtained and shown in Fig. 5(f). At small undercooling, e.g., ΔT e = 64 K, the solidification interface seems like many “dendrites,” but as ΔT e increases gradually to 150 K, the size of the “dendrite” increases, in contrast with a continuous decrease of the dendrite number. Finally, a single dendrite spreads throughout the sample space, indicating a gradual decrease of the number of nucleation sites. Since the large single dendrite is similar to Ni3B from the angles of the dendrite arm, then it can be inferred that the Ni3B dendrite grows first in the eutectic solidification.
Also, the HSV images at a fixed time during solidification of the residual liquid but with different values of ΔT r (116, 128, and 180 K) were obtained and shown in Fig. 5(g). Clearly, the light ring-like solidification interface for ΔT r = 128 K is larger than that for ΔT r = 116 K, but the thickness of the ring for ΔT r = 128 K is smaller than that for ΔT r = 116 K. This implies that larger ΔT r leads to less residual liquid and larger ring-like front. Accordingly, when ΔT r increases to 180 K, the amount of the residual liquid is less than that at ΔT r = 128 K and a larger ring-like front should be observed. In fact, from Fig. 5(g), the solidification interface (ΔT r = 180 K) is shown as only one large circle, whose thickness is not clear due to the small fraction of the residual liquid. So it confirms that the amount of the residual liquid decreases with increasing ΔT r.
E. Growth velocity
The temperature rise due to the second transformation of case II (Fig. 2) is so small that the HSV images, such as Fig. 5(c), are not sufficiently clear to be used to estimate the growth velocity. Only the growth velocities due to the primary solidification (ΔT p), the stable eutectic solidification (ΔT e), and the residual liquid solidification (ΔT r) are measured, as shown in Figs. 6(a)–6(c), respectively. As expected, the growth velocities for the primary solidification and the stable eutectic solidification increase with undercooling, in contrast with a decreasing tendency with undercooling for the residual liquid solidification. In addition, the growth velocity for the stable eutectic solidification is the same order of magnitude as that of the residual liquid solidification, namely that the same reaction, i.e., Liquid→Ni3B/Ni, possibly, occurs upon the residual liquid solidification (case II) and the stable eutectic solidification (case I).
IV. DISCUSSIONS
In the preceding sections, the changes of cooling curve, microstructure, and morphology of solidification interface and growth velocity, subjected to different undercoolings, have been shown. To describe/predict accurately the solidification behavior of Ni–Ni3B alloy, it is needed to discuss the relations between the solidification pathways, the microstructures, the growth velocities, and the undercoolings.
A. Relation between undercoolings and the transformed paths
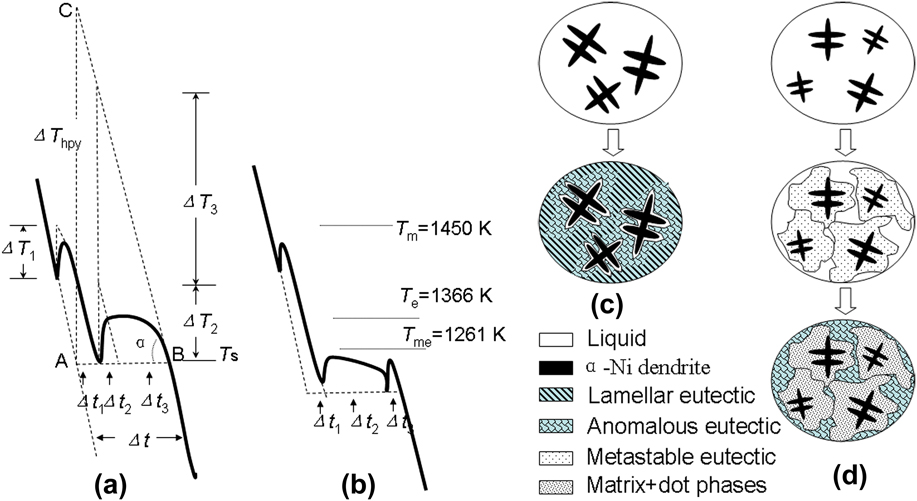
As is known, one characteristic of the eutectic solidification is the isothermal solidification stage in the cooling curve. The isothermal stages for samples 1–3 appear at a temperature near T e (1366 K), i.e., the equilibrium eutectic transformation point, so that the stable eutectic transformation (L→Ni/Ni3B) must occur. Whereas, the isothermal stages for samples 4–8 appear at a temperature near 1261 K (T me), which corresponds to the melting point of the metastable eutectic (Ni–Ni23B6), as confirmed by Baricco et al. Reference Baricco, Ferrari, Battezzati, Im, Park, Greer and Stephenson17,Reference Battezzati, Antonione and Baricco18 Hence, the second recalescence for the present samples 4–8 may correspond to the metastable eutectic transformation (L→Ni/Ni23B6), which leads to formation of the rod-eutectic, Ni/Ni23B6 [Figs. 3(d)–3(h)]. Note that Ni23B6 is highly unstable and decomposes subsequently into Ni and Ni3B; Ni exists as the dot-like precipitate (Fig. 4) and Ni3B activates the transformation of Lr→Ni/Ni3B (corresponding to the third recalescence), thus giving the anomalous eutectic or the network boundary. So, two kinds of solidification modes can be summarized: if ∆T e < 140 ± 10 K, case I occurs, the solidification pathway is shown in Figs. 7(a) and 7(c), i.e., primary solidification (L→α-Ni)—eutectic solidification (L→Ni/Ni3B); if ∆T e ≥ 140 ± 10 K, case II occurs, as shown in Figs. 7(b) and 7(d), primary solidification (L→α-Ni)—metastable eutectic solidification (L→Ni/Ni23B6)—decomposition of metastable phase and residual liquid solidification (Ni23B6→Ni + Ni3B and Lr→Ni/Ni3B).
Schematic illustrations of two kinds of cooling curves and the corresponding solidification behaviors: (a) and (c) ∆T e < 140 ± 10 K; (b) and (d) ∆T e ≥ 140 ± 10 K.

B. Relation between undercoolings and the microstructures
For samples 1–3, the first and the second peaks of the cooling curves correspond to the primary solidification and the eutectic solidification, respectively. Upon eutectic solidification, the anomalous eutectic forms in the rapid recalescence stage, whereas the lamellar eutectic forms in the isothermal stage [Fig. 7(a)]. For samples 4–8, the first, the second, and the third recalescences correspond to formation of the primary phase, the metastable eutectic, and the network boundary (or the anomalous eutectic), respectively [Fig. 7(b)]. Thus, a method to estimate the fraction of each phase from the cooling curves can be deduced.
As shown in Fig. 7(a), if the sample solidifies without latent heat release (ΔH f), the temperature would reduce along the dashed line (extension of the liquid state part of the cooling curve) to T s (point A). Actually the latent heat release is inevitable in solidification, it raises the system temperature and then reduces to T s (point B) again. Though the temperatures at points A and B are equal, the times are different, i.e., the latent heat release makes the time delay, Δt, so we define it as recalescence delay time. It is approximately equivalent to the time interval that the temperature reduces from C to B [Fig. 7(a)]. The temperature at C can be described as: pure-liquid system nucleates at point A, and transforms into pure-solid immediately, where the latent heat release leads to the system temperature rise (ΔT hpy = ΔH f/C p, where C p is the specific heat) to point C. Accordingly, when the system temperature reduces to T s (Point B) again, the need time is Δt, i.e., point C is on the extension of the solid state part of the cooling curve. From the cooling curve, ΔT hpy = RΔt, where R is the average cooling rate [Fig. 7(a)]. For an alloy system, C p can be approximated as a constant during solidification, so ΔT hpy approximates a constant, thus,
 $$R\Delta t = {\rm{Constant}}\quad {\rm{.}}$$
From Eq. (1), the larger R becomes, the smaller Δt is. As shown in Fig. 7(a), the latent heat for formation of primary phase, anomalous eutectic, and lamellar eutectic are ΔH 1, ΔH 2, and ΔH 3, respectively. If every transformation finishes instantly, the latent heat releases will make the temperature rise ΔT 1, ΔT 2, and ΔT 3 or make the time delay Δt 1, Δt 2, and Δt 3, respectively. Assuming that the specific heat C p and the cooling rate R are constants during the solidification, the ratio of the phase fractions can be determined by ΔH 1:ΔH 2:ΔH 3 ∼ (C pΔT 1):(C pΔT 2):(C pΔT 3) ∼ (C p RΔt 1):(C p RΔt 2):(C p RΔt 3) = Δt 1:Δt 2:Δt 3. Thus, for the solidification with multi-step transformation, the phase fraction can be estimated by the recalescence delay time. The present method is rough but much convenient.
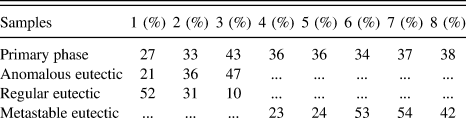
Following the method, the fractions of each phase for samples 1–8 are estimated and listed in Table II. Most of the results in Table II are consistent with the as-solidified structures in Fig. 3; some deviation (e.g., for the network boundary of sample 6) may be ascribed to the nonuniform structural distribution. From Table II, the fraction of the primary phase depends mainly on ΔT e, but not on ΔT p. As for samples 1–3, with ΔT e increasing from 93 to 145 K, the fraction of α-Ni dendrite increases from 27 to 43%, whereas, for samples 4–8, small change of ΔT e makes the fraction of α-Ni dendrite hold almost constant. This is also confirmed by the structure evolution in Fig. 3. Although ΔT p has negligible effect on the α-Ni fraction, it does have significant effect on the size of α-Ni, i.e., the larger ΔT p corresponds to the smaller α-Ni dendrite. An additional rule can be deduced from Table II as: the fraction of the residual liquid decreases with the rise of ΔT r. As for sample 4, ΔT r = 124 K, the fraction of the anomalous eutectic is 41%, but for sample 7, ΔT r = 200 K, the fraction of the anomalous eutectic becomes 9%. This is confirmed by the structure shown in Figs. 3(d) and 3(g).
Predictions of phase fractions by using the recalescence delay time of cooling curves.

a The product of residual liquid solidification shows as anomalous eutectic or network boundary depends on the fraction.
Therefore, the recalescence delay times can reflect the phase fractions in as-solidified structures. Both of them indicate that ΔT p controls the size but not the fraction of the primary phase (α-Ni); ∆T e controls the fractions of the primary phase and the eutectic phase, as well as their transformed paths. ∆T r controls the fraction of the residual liquid.
C. Relation between the growth velocity and the undercoolings
For primary solidification, the HSV morphology is interpreted as due to the recalescence associated with the dendrite tips. Reference Suzuki, Piccone and Flemings32 The growth velocity of the primary phase (α-Ni) can be analyzed by applying the Boettinger, Coriell and Trivedi’s (BCT) dendritic growth model. Reference Eckler, Herlach and Aziz33,Reference Eckler, Cochrane, Herlach, Feuerbacher and Jurisch34 Accordingly, the total undercooling at the dendrite tip consists of four contributions.
 $$\Delta {T_{\rm{p}}} = \Delta {T_{\rm{c}}} + \Delta {T_{\rm{t}}} + \Delta {T_{\rm{r}}} + \Delta {T_{\rm{k}}}\quad ,$$
where ΔT c, ΔT t, ΔT r, and ΔT k, i.e., the solutal undercooling, the thermal undercooling, the curvature undercooling, and the kinetic undercooling, respectively, can be given as follows:
 $$\Delta T_{\rm{c}} = m_{\rm{L}} C_0 \left[ {1 - {{m'/m_{\rm{L}} } \over {1 - (1 - k)Iv(P_C )}}} \right],\Delta T_k = {V \over \mu },\Delta T_k = {{2\Gamma } \over R},\Delta T_t = {{\Delta H} \over {C_{\rm{p}} }}Iv(P_t )\quad .$$
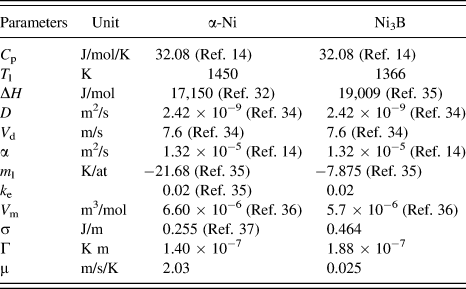
The parameters defined can be found in Ref. Reference Eckler, Herlach and Aziz33. μ = ΔHV 0 /R g T L 2 is the kinetic growth coefficient with ΔH as the enthalpy of fusion, T L the alloy liquidus temperature, and R g the gas constant. V 0 is the speed of sound in the collision-limited growth, such as the growth of solid solution, or else V 0 (=V d) is the atomic diffusion-controlled speed, such as the growth of intermetallic compound. Reference Yang, Liu, Yang, Chen, Liu and Zhou10 The parameters used for the current calculations are shown in Table III. Reference Binder, Kolbe, Klein and Herlach14,Reference Eckler, Herlach and Aziz33–Reference Turnbull37
Physical parameters for calculations of BCT, TMK, and LZ models for Ni–3.3 wt% B alloy.

The calculation of growth velocity is shown in Fig. 6(a), where the velocity of pure Ni is also shown for comparison. It can be found that the experimental data agree well with the theoretical calculations with μ = 2.03 m/s/K [Fig. 6(a)], which is close to the value for α-Ni (μ = 2 m/s/K) in Ni–Si alloy. Reference Li and Kuribayashi38 The growth rate of pure Ni is 2–3 orders of magnitude larger than that of α-Ni due to the primary solidification of Ni–3.3 wt% B, which indicates that the composition plays a key role in the growth of the primary phase.
To demonstrate the growth kinetics for the eutectic solidification, as shown in Fig. 6(b), the calculation due to lamellar eutectic growth, i.e., Trivedi, Magnin and Kurz’s (TMK) model, is performed.
Reference Trivedi, Magnin and Kurz39
To apply this model, the equilibrium partition coefficients of α-Ni and Ni3B phases must be assumed equal; k
α-Ni =
 ${k_{{\rm{N}}{{\rm{i}}_{\rm{3}}}{\rm{B}}}}$
= 0.02 is given according to the Ni–B phase diagram.
Reference Franke, Neuschütz, Franke and Neuschütz35
Other parameters are from Table III. From Fig. 6(b), the TMK model prediction deviates substantially from the experimental data. This can be ascribed to the following reasons: (i) TMK model neglects the effects of thermal and kinetic undercoolings on the eutectic growth
Reference Trivedi, Magnin and Kurz39
; (ii) TMK model is precisely applicable to the coupled growth
Reference Trivedi, Magnin and Kurz39–Reference Li and Kuribayashi41
but not to the decoupled growth of Ni–Ni3B eutectic at high undercooling; (iii) TMK model is normally used to describe the eutectic reaction occurring at the initial transformation, but not compatible with the present eutectic reaction occurring at the second transformation.
As for the reason (i), if the eutectic products contain intermetallic compounds, the contribution from the kinetic undercooling will be significant. Reference Li and Zhou40 Since Ni3B is an intermetallic compound, the kinetic undercooling cannot be neglected upon analysis of solidification of Ni–3.3 wt% B. Taking the thermal and kinetic undercoolings into account, Li and Zhou (LZ) proposed a model for eutectic growth, Reference Li and Zhou40 where the undercooling as a function of lamellar spacing is expressed as
 $$\Delta T =\,\, \Delta T_{\rm{c}} + \Delta T_{\rm{r}} + \Delta T_{\rm{k}} + \Delta T_{\rm{t}} = m{{a^{\rm{L}} } \over {\rm{\lambda }}}\left[ {1 + {P \over {P + {\rm{\lambda (}}\partial P + \partial {\rm{\lambda )}}}} + {1 \over {{\rm{\mu }}Q^{\rm{L}} {\rm{\lambda }}}}} \right] + {{\Delta H_{\rm{f}} } \over {C_{\rm{p}} }}Iv(P_t )\quad .$$
The lamellar spacing as a function of velocity is obtained as
 $${{\rm{\lambda }}^{\rm{2}}}V = {a^{\rm{L}}}/{Q^{\rm{L}}}\quad ,$$
 $${Q^{\rm{L}}} = {1 \over {{f_{\rm{\alpha }}}{f_{\rm{\beta }}}}}{{{C_0}} \over D}\left[ {P + {\rm{\lambda }}{{\partial P} \over {\partial {\rm{\lambda }}}}} \right]\quad .$$
All the parameters defined can be found in Ref. Reference Li and Zhou40. For Ni–Ni3B eutectic, the kinetic coefficient, μ, in Eq. (4) is not available and can be considered as a fitting parameter; other parameters are from Table III. From Fig. 6(b), the experiential data are fitted well using LZ model with μ = 0.003 m/s/K, only for small and moderate undercoolings but not for high undercooling.
As for the reason (ii), for the undercooling range [64–150 K; Fig. 5(g)], a Ni3B dendritic shape (with slant arms) but not α-Ni dendritic shape (with straight arms) is always shown upon the eutectic solidification, indicating that the solidification interface of anomalous eutectic results from the dendrite growth of Ni3B. On this basis, the BCT dendritic growth model calculation with parameters of Ni3B (the boron concentration is assumed as C0 = 3.7 wt% B) and μ = 0.025 m/s/K can be used to fit well the experimental data [Fig. 6(b)]. Note that, the value of μ, two orders of magnitude less than that of α-Ni, seems to be reasonable due to the complicated intermetallic structure. Therefore, at small and moderate undercoolings, the eutectic growth may be mainly coupled, so that the growth velocity can be fitted by the LZ model; at large undercooling, the eutectic growth may be mainly decoupled, so that it can be fitted well by the BCT model.
As for the residual liquid solidification, where the growth velocity decreases with ΔT
r, following an exponential relation,
 $V = {\rm{4}}{\rm{.088}}{{\rm{e}}^{ - {\rm{0}}{\rm{.0226}}\Delta {T_{\rm{r}}}}}$
[Fig. 6(c)]. As far as we know, this phenomenon has not been reported in other work and cannot be interpreted by any of the available models. A possible reason is that the residual liquid solidification should be controlled by solid–solid transformation, Ni23B6→Ni + Ni3B, since the growth velocity of solid–solid transformation often decreases with increasing undercooling. Furthermore, the similarity of the growth velocity between the stable eutectic solidification [Fig. 6(b)] and the residual liquid solidification [Fig. 6(c)] demonstrates that both the products from the two different transformations include the anomalous eutectic [Figs. 3(a)–3(h)]. On this basis, it can be concluded that whether for ΔT
e < ΔT
e* or ΔT
e ≥ ΔT
e*, the eutectic reaction L→Ni/Ni3B always occurs at the final recalescence; if ΔT
e < ΔT
e*, the growth velocity increases with increasing ΔT
e, whereas if ΔT
e ≥ ΔT
e*, the growth velocity decreases with increasing ΔT
r.
V. CONCLUSIONS
For undercooled hypoeutectic Ni–3.3 wt% B alloy melt, the solidification behavior mainly depends on the undercooling for the eutectic transformation, ΔT e. With ΔT e* ∼ 140 ± 10 K as a critical point, if ΔT e < ΔT e*, stable eutectic reaction occurs and the microstructure consists of primary α-Ni phase, regular lamellar eutectic, and anomalous eutectic; if ΔT e ≥ ΔT e*, metastable eutectic reaction (L→Ni/Ni23B6) occurs and the microstructure consists of primary α-Ni phase, dot-phase region, and anomalous eutectic. Analysis of the cooling curves indicates that the recalescence delay time can reflect the phase fractions in the as-solidified structure; ΔT p controls the size of the primary phase (α-Ni); ∆T e controls the fractions of the primary phase and the eutectic phase, as well as their transformed paths; ∆T r controls the fraction of the residual liquid.
The solidification interface of primary solidification changes from single dendritic shape to spherical shape with increasing ΔT p, indicating possibly increased nucleation site and decreased dendrite size; the interface of eutectic solidification changes from many small “dendrites” to a single large one with increasing ΔT e, indicating possibly that Ni3B dendrite grows first at large ΔT e; the interface of residual liquid solidification changes from many small rings to a single large one with increasing ΔT r, indicating increased amount of dot-phase and decreased amount of anomalous eutectic. The growth velocity of primary solidification can be interpreted by the dendrite growth model. The eutectic solidification can be fitted by using the LZ model at small and moderate undercoolings, whereas by using the BCT model at large undercooling. This suggests a coupled eutectic growth at small and moderate undercoolings and decoupled eutectic growth at large undercooling. The residual liquid solidification cannot be interpreted using the available models. A possible reason is that the residual liquid solidification is controlled by the decomposition of the metastable phase.
ACKNOWLEDGMENTS
The authors are grateful for the financial support of the China National Funds for Distinguished Young Scientists (Grant No.51125002), the National Basic Research Program of China (973 Program) (Grant No. 2011CB610403), the Natural Science Foundation of China (Grant Nos. 50901059, 51071127, and 51134011), the 111 project (Grant No. B08040), and the Fundamental Research Fund of NPU (JC20120223). J.F. Xu expresses thanks to C.Y. Hu, J.W. Xu, K. Zhang, and K. Wang for their help in this work.