INTRODUCTION
Mycotoxins are secondary metabolites produced by filamentous fungi, able to contaminate crops before and after harvest. Some of them are highly toxic and cause health hazards when consumed by humans or farm animals (D'Mello & Macdonald Reference D'Mello and Macdonald1997). Generally, ruminants are considered less susceptible to mycotoxin exposure than monogastrics (Fink-Gremmels Reference Fink-Gremmels2008a ) because rumen microorganisms are capable of converting several toxins into less toxic metabolites, or binding the compounds and thereby reducing their absorption into the bloodstream (Boundra & Morgavi Reference Boundra and Morgavi2005; Niderkorn et al. Reference Niderkorn, Morgavi, Pujos, Tissandier and Boudra2007; Gallo & Masoero Reference Gallo and Masoero2010). However, ruminants are exposed to a wider range of mycotoxins than monogastrics since their diets are composed not only of concentrates and their by-products but also stored grains or forages, either silage or hay (Scudamore & Livesey Reference Scudamore and Livesey1998; Fink-Gremmels Reference Fink-Gremmels2008a , Reference Fink-Gremmels b ). Forages could be contaminated by mycotoxigenic fungi belonging to different genera, such as Alternaria, Aspergillus, Manoscus, Fusarium and Penicillium spp. (Nout et al. Reference Nout, Bouwmeester, Haaksma and Van Dijk1993; Scudamore & Livesey Reference Scudamore and Livesey1998; Fink-Gremmels Reference Fink-Gremmels2008a ; Driehuis et al. Reference Driehuis, Spanjer, Scholten and te Giffel2008b ; Driehuis Reference Driehuis2013).
Moulds belonging to Penicillium section roqueforti, such as P. roqueforti, Penicillium carneum and Penicillium paneum (Frisvad & Samson Reference Frisvad and Samson2004), are considered as some of the most prevalent post-harvest fungi found in forage silages, capable of growing in the presence of low level of oxygen and high level of carbon dioxide, and being moderately tolerant to acidic conditions (Nout et al. Reference Nout, Bouwmeester, Haaksma and Van Dijk1993; Richard et al. Reference Richard, Heutte, Sage, Pottier, Bouchart, Lebailly and Garon2007; Pereyra et al. Reference Pereyra, Alonso, Rosa, Chiacchiera, Dalcero and Cavaglieri2008; Storm et al. Reference Storm, Kristensen, Raun, Smedsgaard and Thrane2010; Driehuis Reference Driehuis2013). Different critical factors, such as unfavourable weather or storage conditions, could promote fungal growth and mycotoxin production (D'Mello & Macdonald Reference D'Mello and Macdonald1997; Boundra & Morgavi Reference Boundra and Morgavi2005; Richard et al. Reference Richard, Heutte, Sage, Pottier, Bouchart, Lebailly and Garon2007). Auerbach et al. (Reference Auerbach, Oldenburg and Weissbach1998) reported that P. roqueforti was isolated from 0·89 of visibly mouldy silages and 0·85 of silages with no visible signs of mould. Similarly, P. roqueforti and P. paneum have been isolated from 0·96 of maize silages stored in bunker silos or as silage stacks laid on soil (Storm et al. Reference Storm, Kristensen, Raun, Smedsgaard and Thrane2010). In a survey conducted in the Netherlands (Driehuis et al. Reference Driehuis, Spanjer, Scholten and te Giffel2008b ), high incidences of mycotoxins produced by P. roqueforti were reported both in maize and grass silages (0·50 and 0·19 of collected samples, respectively).
The P. roqueforti moulds produce several secondary metabolites with immunosuppressive, antibacterial and other toxicological effects which have not yet been well defined (Storm et al. Reference Storm, Sørensen, Jens, Rasmussen, Nielsen and Thrane2008, Reference Storm, Kristensen, Raun, Smedsgaard and Thrane2010; Whitlow & Hagler Reference Whitlow and Hagler2010). Among these metabolites, PR toxin (PR), mycophenolic acid (MY) and roquefortine C (RC) have been detected frequently in forage contaminated by P. roqueforti (Nielsen et al. Reference Nielsen, Sumarah, Frisvad and Miller2006; Storm et al. Reference Storm, Sørensen, Jens, Rasmussen, Nielsen and Thrane2008). In particular, RC contamination up to 36 mg/kg of dry matter (DM) has been reported in silages (Auerbach et al. Reference Auerbach, Oldenburg and Weissbach1998). Driehuis et al. (Reference Driehuis, Spanjer, Scholten and te Giffel2008b ) reported average contaminations of 778 μg/kg for RC and 524 μg/kg for MY in silages, with maximum levels up to 3·16 and 2·63 mg/kg, respectively. Similarly, Müller & Amend (Reference Müller and Amend1997) reported maximum concentrations of 3·56 mg/kg for MY and 2·17 mg/kg for PR after inoculation of P. roqueforti strains on maize silage. Lastly, an incidence of 0·76 of PR in 63 feed samples (25 hays and 38 silages and mixed feeds) was reported by Yu et al. (Reference Yu, Yu, Undersander and Chu1999), with an average contamination of 130 μg/kg (value calculated by excluding samples in which PR was not detected). Incidence and mean contamination value of PR increased up to 0·80 and 150 μg/kg, respectively, when only hays were considered.
Little information has been reported concerning health hazards after ingestion of PR, MY or RC in animals, and what is available is controversial (D'Mello & Macdonald Reference D'Mello and Macdonald1997; Scudamore & Livesey Reference Scudamore and Livesey1998; Fink-Gremmels Reference Fink-Gremmels2008b ; Pedrosa & Griessler Reference Pedrosa and Griessler2009). The main effects ascribed to these mycotoxins concern antimicrobial activity and immunosuppression (Fink-Gremmels Reference Fink-Gremmels2008a ; Whitlow & Hagler Reference Whitlow and Hagler2010). Furthermore, different authors have reported loss of appetite and nutrient efficiency, ketosis, abomasal ulcer and gastroenteritis in farm animals fed feedstuffs contaminated by P. roqueforti strains and, probably, by their toxic metabolites (Nout et al. Reference Nout, Bouwmeester, Haaksma and Van Dijk1993; Nielsen et al. Reference Nielsen, Sumarah, Frisvad and Miller2006; Pereyra et al. Reference Pereyra, Alonso, Rosa, Chiacchiera, Dalcero and Cavaglieri2008; Fink-Gremmels Reference Fink-Gremmels2008a ). However, no adverse effect on animal health and blood parameters was detected in sheep fed 300 mg/day of MY (Mohr et al. Reference Mohr, Lorenz, Baum, Hewicker-Trautwein, Pfaffl, Dzidić, Meyer, Bauer and Meyer2007). Lastly, even if an association between PR and cattle disorders is suspected (Pedrosa & Griessler Reference Pedrosa and Griessler2009; Whitlow & Hagler Reference Whitlow and Hagler2010), any effect due to its ingestion by farm animals has not yet been investigated thoroughly.
In vivo studies represent the best experimental approach to investigate the effects of mycotoxins ingestion by animals. However, they are expensive, time-consuming and repeatability is often poor, because of the use of animals and the need to monitor a high number of factors. Thus, in vitro approaches could represent a good alternative to verify effects of mycotoxins under controlled conditions (Rasmussen et al. Reference Rasmussen, Rasmussen, Larsen, Bladt and Binderup2011).
The aims of the present work were to determine effects of pure mycotoxins (PR, MY and RC) on in vitro rumen fermentation parameters in a dose-dependent way and to verify their stability in the rumen environment.
MATERIALS AND METHODS
Reagents and standards
Chemicals and solvents used for the extraction and clean-up solutions were ACS grade or equivalent (Carlo Erba, Milan, Italy). Water was ultra-pure and de-ionized through a Milli-Q treatment system (18 MΩ-cm resistance, Millipore, London, UK). Methanol, acetone, acetonitrile and formic acid used for liquid chromatography were HPLC grade (VWR, Leuven, Belgium).
The PR and MY standards were obtained from Sigma-Aldrich (St. Louis, MO, USA) and the RC standard was purchased from DBA Italia (Segrate, Milan, Italy). For each mycotoxin, a standard solution was prepared at a concentration of 10 μg/ml in methanol.
Treatments
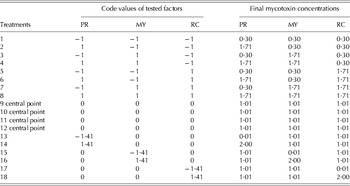
Two distinct in vitro gas production experiments were carried out at different times. In the first experiment, three main effects consisting of the presence of three P. roqueforti mycotoxins (PR, MY and RC) in rumen fluid were studied in a central composite design with four replications of central point (CCD experiment, i.e. the condition in which the three tested factor have the same and intermediate level (code 0, 0, 0)). Details of the statistical model adopted can be found in St-Pierre & Weiss (Reference St-Pierre and Weiss2009). Eighteen treatments, of which four represented a replication of the central point, were formulated combining the main effects at different levels of mycotoxin concentrations. For each treatment, the final concentrations of PR, MY and RC in diluted rumen fluid (from 0·01 to 2·00 μg/ml) were set a priori as a function of experimental design as detailed in Table 1.
Treatment layout of the adopted three-factors (final concentrations of PR toxin (PR), mycophenolic acid (MY) and roquefortine C (RC) in diluted rumen fluid, μg/ml) orthogonal central composite design (CCD) with four replications of central point

In the second experiment, two main effects (presence of MY and RC in diluted rumen fluid) were studied in a completely randomized design with a fully factorial arrangement of treatments (FFD experiment). Sixteen treatments were formulated, combining the main effects at four increasing levels of concentration (0, 0·67, 1·33 and 2·00 μg/ml) in diluted rumen fluid.
To obtain the exact mycotoxin concentrations for each specific treatment, different aliquots (from 16·0 μl to 3·2 ml in CCD and from 0 to 3·2 ml in FFD) of the standard solutions were mixed in glass vials, evaporated at room temperature under nitrogen flow and redissolved by ultrasonication with 1 ml of methanol to achieve the final 1 ml mycotoxin working solutions (MWSs). Then, MWSs were added to the in vitro gas production test syringes, as described in the specific paragraph below.
Chemical analysis
Samples of diets fed to fistulated dairy cows and total mixed ration (TMR) used as a substrate for in vitro rumen gas production tests were dried, then ground using a laboratory mill (FRITSCH Universal Cutting Mill Pulverisette 19, Idar-Oberstein, Germany) fitted with a 1 mm screen and analysed in triplicate according to the AOAC (1995) for DM, crude protein (CP) (N×6·25) and ash contents (methods 930·15, 976·05 and 942·05, respectively). The neutral detergent fibre (aNDF) and acid detergent fibre (ADF) contents (Van Soest et al. Reference Van Soest, Robertson and Lewis1991) were analysed using Ankom F57 filter bags in an Ankom200 fibre analyser (Ankom Technology, Macedon, NY, USA). For aNDF analysis, samples were treated with α-amylase (Sigma A-3306, Sigma–Aldrich® Co., Milan, Italy) and sodium sulphite (Carlo Erba 483257, Carlo Erba® Reagenti SpA, Rodano, MI, Italy). The aNDF and ADF residues were not corrected for residual ash. Starch was determined enzymatically as reported by Masoero et al. (Reference Masoero, Gallo, Zanfi, Giuberti and Spanghero2010).
In vitro rumen gas production experiments
The rumen fluids used in CCD and FFD experiments (March and July 2013, respectively) were collected from the same three fistulated dairy cows, farmed at CeRZOO experimental station (Centro per la Ricerca e la Sperimentazione in Agricoltura, San Bonico, Piacenza, Italy) and fed a diet at a maintenance level (NRC 2001) as previously described by Gallo et al. (Reference Gallo, Moschini, Cerioli and Masoero2013). The research protocols and animal care followed the EC Council Directive guidelines (European Commission 1986).
For in vitro rumen gas production tests, 15 ml of diluted rumen fluid (filtered rumen fluid : buffered mineral solution ratio of 1 : 1, v/v; Menke & Steingass Reference Menke and Steingass1988) were transferred to 100-ml glass syringes containing c. 100 mg of TMR (DM 512±10 g/kg, CP: 172±12 g/kg DM, starch: 266±17 g/kg DM, aNDF: 332±24 g/kg DM, ADF: 194±16 g/kg DM and ash: 35±2 g/kg DM). In both experiments, two syringes for each treatment (n=36 in CCD and n=32 in FFD) were included simultaneously in two different runs and a normal amylose maize starch (code S4126, Sigma-Aldrich Co, Milan, Italy) was used as an internal standard. In each run, the previously prepared MWSs were added to syringes. Three syringes without TMR plus 1 ml of methanol were included as blanks. Syringes within runs were considered as repetitions, whereas syringes between runs as replicates. Syringes were placed vertically in a water bath at 39 °C and the gas productions were measured at 0·5, 1, 2, 4, 8, 12, 24, 30, 36 and 48 h after incubation. The syringes were stirred at each measurement.
Mycotoxin extraction and analysis from rumen supernatant and rumen pellet
At the end of incubation time, the diluted rumen fluid was carefully recovered from each syringe and treated as described previously by Gallo & Masoero (Reference Gallo and Masoero2010), with some differences. Briefly, the supernatant was removed after centrifugation (4500 g for 10 min) of collected diluted rumen fluid. The precipitate was washed twice with 10 ml of de-ionized water and these washings were added to the supernatant (final supernatant volume was c. 35 ml). An aliquot of 5 ml acetonitrile was added to 5 ml of the final rumen supernatant. In order to remove possible solid impurities, the mixture was shaken for 10 min, centrifuged at 4500 g for 10 min and the liquid phase was retained.
Mycotoxins from the water-washed rumen pellet were extracted using 2 ml of acetonitrile and the mixture was shaken for 45 min. After centrifugation (4500 g for 10 min), the acetonitrile phase was retained. The two final solutions, one from the rumen supernatant and the other from the rumen pellet, were diluted 1 : 10 (0·1 ml brought to 1·0 ml) with acetonitrile : water 30 : 70 (v/v). The extracts were filtered (Millipore Corporation, Bedford, MA, USA, HV 0·45 μm) and injected (5 μl) into a high-performance liquid chromatography tandem mass spectrometry (HPLC–MS/MS) system.
Mycotoxin analysis in feeds
The diet fed to rumen-fistulated dairy cows and the TMR used as a substrate for in vitro rumen gas production tests were analysed for determination of aflatoxins (Gallo et al. Reference Gallo, Masoero, Bertuzzi, Piva and Pietri2010; Bertuzzi et al. Reference Bertuzzi, Rastelli, Mulazzi and Pietri2012), fumonisins B 1 and B 2 (Pietri & Bertuzzi Reference Pietri and Bertuzzi2012), zearalenone (ZEA), type A (i.e. T2 and HT-2 toxins) and type B (deoxynivalenol (DON), 3-acetyl-deoxynivalenol, 15-acetyl-deoxynivalenol, nivalenol) trichothecenes (Pietri et al. Reference Pietri, Battilani, Gualla and Bertuzzi2012).
Mycotoxins from P. roqueforti (PR, MY and RC) and other mycotoxigenic fungi typical of silages (Storm et al. Reference Storm, Sørensen, Jens, Rasmussen, Nielsen and Thrane2008), such as Alternatia spp. (alternariol and alternariol monomethil ether), A. fumigatus (gliotoxin), A. flavus and parasiticus (cyclopiazonic acid), M. ruber (citrinin) and B. nivea (patulin) were extracted simultaneously from 3 g of a dried sample with 30 ml extraction solution (20 ml of 1% acetic acid in acetonitrile and 10 ml deionized water containing 3·34 g CH3COONa*3H2O) in a 50 ml-digitube, according to Rasmussen et al. (Reference Rasmussen, Storm, Rasmussen, Smedsgaard and Nielsen2010). The mixture was shaken for 45 min, and then 4·0 g anhydrous MgSO4 were added to obtain phase separation. After shaking for 2 min and centrifugation at 4500 g for 10 min, the upper acetonitrile phase was recovered. Before instrumental analysis, the extract was diluted 1 : 5 (0·1 ml brought to 0·5 ml) with acetonitrile : water 30 : 70 (v/v). Then the extract was filtered (Millipore Corporation, Bedford, MA, USA, HV 0·45 μm) and injected (5 μl) into a HPLC–MS/MS system.
LC-MS/MS analysis
The HPLC–MS/MS system consisted of a LC 1·4 Surveyor pump, a Quantum Discovery Max triple–quadrupole mass spectrometer (Thermo-Fisher Scientific, San Jose, CA, USA) and a PAL 1.3.1 sampling system (CTC Analitycs AG, Zwingen, Switzerland); the system was controlled by Excalibur 1.4 software (Thermo-Fisher). Mycotoxins were separated on a Betasil C-18 column (5 μm particle size, 150×2·0 mm, Thermo-Fisher Scientific) with a mobile phase gradient acetonitrile-water (both acidified with 0·1% formic acid) from 35 : 65 (v/v) to 25 : 75 (v/v) for 6 min, then isocratic for 6 min; the flow rate was 0·20 ml/min. Ionization was carried out with an electrospray ionization (ESI) interface (Thermo-Fisher Scientific) in positive mode as follows: spray capillary voltage 4400 kV, sheath and auxiliary gas 25 and 11 psi, respectively, temperature of the heated capillary 270 °C. The mass spectrometric analysis was operated in selected reaction monitoring (SRM). For fragmentation of [M+H]+ ions of investigated mycotoxins (390 m/z for RC, 321 m/z for MY and 321 m/z for PR), the argon collision pressure was set to 1·5 mTorr and the collision energy to 25 V for RC and 16 V for MY and PR. The selected fragment ions were 334, 322 and 193 m/z for RC, 303, 275 and 207 m/z for MY and 279, 173, 161 and 145 m/z for PR. The calibrant standard solutions were diluted with the corresponding mycotoxin-free matrix extract as for the samples. Quantitative determination was performed using a LC-Quan 2.0 software. Concerning HPLC–MS/MS analysis, performance criteria for HPLC methods, fixed by Decision 2002/657/EC (European Commission 2002), were fulfilled completely. For rumen supernatant, the limits of detection (LOD) and limits of quantification (LOQ) were 4 and 10 μg/l for RC and MY or 15 and 40 μg/l for PR. For rumen pellet, the LOD and LOQ were 2 and 5 μg/l for RC and MY or 8 and 20 μg/l for PR. Lastly, the LOD and LOQ for feeds were 10 and 30 μg/l for RC and MY or 30 and 90 μg/l for PR.
Volatile fatty acids analysis
To quantify the concentration of volatile fatty acids (VFAs) in diluted rumen fluid, 1 ml aqueous solution containing ossalic acid (15·2 g/l) and 1 ml aqueous solution containing pivalic (internal standard) and formic acids (1 g/l and 50 ml/l, respectively) were added to 2 ml of rumen supernatant, prepared as described previously. Samples were analysed by gas chromatography (Varian 3350 system; Varian Inc., CA) equipped with a flame ionization detector and a split injector. Analysis was performed with a silica capillary column (DB-5, Agilent Technologies, USA). The injection volume was 1 μl/sample. The carrier gas was high-purity helium with a flow rate of 1·3 ml/min. The injector and detector temperatures were kept at 200 and 220 °C, respectively. The column oven temperature was programmed as follows: 60 °C for 5 min, from 60 to 160 °C at 5 °C/min and from 160 to 190 °C at 10 °C/min for 7 min. The peak identification was performed using an external standard (WSFA-2, cat. no. 47 056, Supelco/Sigma Aldrich, Milan, Italy).
Calculations and statistical analyses
Data of cumulative gas production over time were fitted according to a logistic-exponential model with discrete lag phase time in agreement with the following equation:
 $${\rm Vt} = {\rm Vf}\,(1 - e^{( - {\rm kd} \times (t - {\rm Lag}))} )$$
where Vt is the volume of gas accumulated (ml/g organic matter or OM) at time t (h), Vf is the final gas volume (ml/g OM), Lag is the discrete lag phase time (h) and kd is the fractional rate of fermentation of the substrate (per h).
The half-time of asymptotic gas production (T½, h) was calculated as:
 $$T\raise.5ex\hbox{$\scriptstyle 1$}\kern-.1em/ \kern-.15em\lower.25ex\hbox{$\scriptstyle 2$} = {\rm Lag} + \ln (0 {\cdot} 5)/{\rm kd}$$
Fermentation kinetic parameters were obtained by the Marquardt method using the PROC NLIN procedure of SAS (2003).
For each mycotoxin tested, two mycotoxin stability indices (MSI) were calculated as the ratio between the measured amounts of mycotoxin recovered after 48 h of incubation in the rumen pellet (MSIrp) or in the rumen supernatant plus rumen pellet (MSItot) and the estimated amount of pre-incubated mycotoxin, expressed as a percentage.
Data from CCD were analysed according to a central composite design with four replications of central point (St-Pierre & Weiss Reference St-Pierre and Weiss2009) by the Mixed procedure of SAS (2003). The fixed effects of the model were PR, MY and RC concentrations in diluted rumen fluid (PR, MY and RC), their squared terms (PR×PR, MY×MY and RC×RC) and their single interactions (PR×MY, PR×RC and MY×RC). In the first step of the analysis, the complete model was fitted using the code values (−1·4142, −1, 0, 1, 1·4142) of the three tested factors. Then, non-significant effects were removed by the model and significant effects were expressed in natural scale (0·01, 0·30, 1·01, 1·71 and 2·00 μg of mycotoxin/ml of diluted rumen fluid) to obtain their regression terms using the Mixed procedure of SAS.
Data from FFD were analysed according to a completely randomized design with a factorial arrangement of treatments by the Mixed procedure of SAS (2003). The fixed effects of the model were MY and RC concentrations in diluted rumen fluid (MY and RC) and their first order interaction (MY×RC). Linear and quadratic responses of significant main effects were evaluated using the CONTRAST option and equally spaced contrast coefficients generated by IML procedure of SAS. Then the regression terms of significant effects were obtained using the Mixed procedure of SAS (2003). Run was entered as random in both models. Significance was declared at P<0·05.
RESULTS
In vitro rumen fermentation parameters
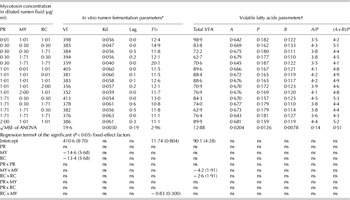
No mycotoxins were detected either in rumen-fistulated dry cows’ diets or in the TMR used as substrate in gas production tests (CCD and FFD). Fitted kinetic parameters of gas production, total production of VFA after 48 h of incubation and molar proportions of single VFA measured in CCD incubating different concentrations of pure mycotoxins in diluted rumen fluid are detailed in Table 2. The Vf decreased linearly as MY and RC in diluted rumen fluid increased (P<0·05), reaching values <360 ml/g OM when the highest concentrations of either MY or RC were incubated. Marginal effects of MY or RC in reducing gas production were similar and equal to −14·6 or −13·4 ml/g OM for each 1·0 μg/ml of increment of mycotoxin concentration, respectively. The kd and Lag values were not influenced by the presence of mycotoxins, with kd and Lag ranging from 0·040 to 0·061/h and from 0 to 0·6 h, respectively. In contrast, T½ tended to be modified by concomitant presence of MY and RC (MY×RC interaction, P=0·05). Total VFA production was influenced by MY and RC (quadratic responses, P<0·05) and ranged from 70·6 to 98·9 mmol/l. Marginal effect of MY concentration was c. 1·6 times the marginal effect of RC concentration (regression slopes of −4·2 and −2·6, respectively). No mycotoxin concentration effects were observed neither for molar proportions of acetic, propionic and butyric nor for VFA molar ratios (i.e. acetic/propionic or (acetic+butyric)/propionic ratios).
Effect of pure mycotoxin (PR toxin or PR, mycophenolic acid or MY and roquefortine C or RC) concentrations on in vitro rumen fermentation parameters, total volatile fatty acid (VFA) production and molar ratios of single VFA after 48 h of incubation in central composite design (CCD experiment)

ns, not significant.
* Final volume of gas production (Vf, ml/g OM), rate of gas production (kd, /h), lag time (Lag, h), half-time of asymptotic gas production (T½, h).
† Total VFA production (mmol/l), molar proportions (dimensionless) of acetic (A), propionic (P) and butyric (B) fatty acids, acetic/propionic (A/P) ratio, (acetic+butyric)/propionic ((A+B)/P) ratio.
‡ Values in brackets are the s.e. of significant regression coefficients.
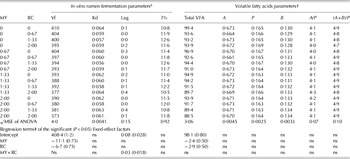
Similar trends of MY and RC effects were observed in FFD on in vitro rumen fermentation parameters (Table 3). In particular, Vf decreased linearly as MY and RC increased (P<0·05). Starting from an intercept value of 408·4 ml/g OM, the marginal effect was about twofold higher for MY than RC (−11·1 and −6·7 ml/g OM, respectively). Concomitant presence of both MY and RC extended the LAG time (P<0·05), even though the effect could be considered numerically negligible. The VFA decreased linearly by increasing MY and RC concentrations in diluted rumen fluid (P<0·05), with marginal effects similar between mycotoxins (regression slopes of −2·4 and −2·9 for MY and RC, respectively). A similar VFA profile was observed among treatments.
Effect of pure mycotoxin (mycophenolic acid or MY and roquefortine C or RC) concentrations on in vitro rumen fermentation parameters, total volatile fatty acid (VFA) production and molar ratios of single VFA after 48 h of incubation in completely randomized design (FFD)

ns, not significant.
* final volume of gas production (Vf, ml/g OM), rate of gas production (kd, /h), lag time (Lag, h), half-time of asymptotic gas production (T½, h).
† Total VFA production (mmol/l), molar proportions (dimensionless) of acetic (A), propionic (P) and butyric (B) fatty acids, acetic/propionic (A/P) ratio, (acetic+butyric)/propionic ((A+B)/P) ratio.
‡ Values in brackets are the s.e. of significant regression coefficients.
Stability of pure mycotoxins in rumen fluid
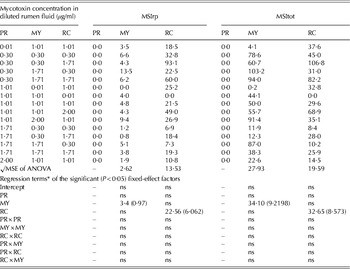
Table 4 presents the MSIrp and MSItot values of the three pure mycotoxins measured in each treatment after 48 h of incubation in CCD. PR was not detected in any of the samples. The MSIrp of MY and RC ranged from zero to 13·5 and to 93·1%, respectively. The ranges of variation of MSItot were wide for both mycotoxins, ranging from 0 to 103·2% for MY and 0 to 106·8% for RC. Furthermore, both MSIrp and MSItot of MY were linearly (P<0·05) influenced by MY concentration (+3·4% and +34·1%, respectively). Similarly, MSIrp and MSItot of RC increased linearly (P<0·05) when RC concentration increased (+22·56% and +32·65%, respectively).
Stability indexes of pure mycotoxins (PR toxin or PR, mycophenolic acid or MY and roquefortine C or RC) in rumen pellet (MSIrp, %) and in rumen fluid (MSItot, %) after 48 h of incubation in central composite design (CCD experiment)

ns, not significant.
* Values in brackets are the s.e. of significant regression coefficients.
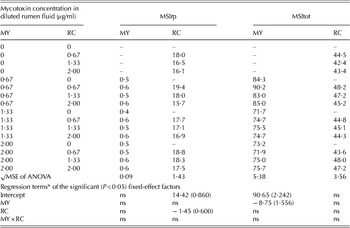
The MSIrp and MSItot values of both MY and RC measured after 48 h of incubation in FFD are shown in Table 5. Low amounts of MY were recovered in rumen pellet, with MSIrp values <1%, whereas >70% of this mycotoxin was found in rumen supernatant. On average, MSIrp and MSItot of RC were 17·5 and 45·3%, respectively. Furthermore, the MSIrp of RC and MSItot of MY decreased (P<0·05) when increasing the concentration of respective mycotoxin in diluted rumen fluid.
Stability indexes of pure mycotoxins (mycophenolic acid or MY and roquefortine C or RC) in rumen pellet (MSIrp, %) and in rumen fluid (MSItot, %) after 48 h of incubation in completely randomized design (FFD)

ns, not significant.
* Values in brackets are the s.e. of significant regression coefficients.
DISCUSSION
Various authors have reported that mycotoxins could interfere with rumen microorganisms thus modifying fermentation pattern, nutrient utilization or VFA production (Morgavi et al. Reference Morgavi, Boudra, Jouany and Michalet-Doreau2004; Fink-Gremmels Reference Fink-Gremmels2008b ; Jeong et al. Reference Jeong, Lee, Simizu, Tazaki, Itabashi and Kimura2010; Jiang et al. Reference Jiang, Yang and Lund2012). Westlake et al. (Reference Westlake, Mackie and Dutton1989) described a partial reduction in rumen microbial activity when AFB1 was added to diluted ovine rumen fluid at levels of 10 or 100 μg/ml. Similar results were confirmed recently by Jiang et al. (Reference Jiang, Yang and Lund2012) incubating different AFB1 doses (0–0·96 μg/ml) in diluted lactating cow rumen fluid. Tapia et al. (Reference Tapia, Stern, Koski, Bach and Murphy2002) showed a negative dose-dependent (doses of mycotoxin: 0–90 μg/ml) effect of patulin on nutrient digestion, nitrogen metabolism and energy utilization of a rumen inoculum sampled from fistulated dry cows. Morgavi et al. (Reference Morgavi, Boudra, Jouany and Michalet-Doreau2004) stated that only very high levels of gliotoxin, up to 80 μg/ml of rumen inoculum, influenced DM degradation, gas and VFA productions. To our knowledge, no information is currently available concerning the effects of mycotoxins produced by P. roqueforti on digestive processes or metabolic responses in ruminants.
The maximum concentration of mycotoxins tested in the current experiments was 2·00 μg/ml of diluted rumen fluid and established ranges could be considered in line with the hypothetical mycotoxin intake by cows (Driehuis et al. Reference Driehuis, Spanjer, Scholten and te Giffel2008b ; Moschini et al. Reference Moschini, Gallo, Piva and Masoero2008). Of the three mycotoxins tested in CCD, MY and RC influenced the in vitro rumen fermentation characteristics in a dose-dependent way and at relatively low levels, presumably because these mycotoxins interfered with or modified microbial populations. Similar trends were observed when only MY and RC were incubated in diluted rumen fluid (FFD experiment), even though the marginal effects of these toxins on in vitro rumen fermentation parameters were numerically lower in FFD than CCD. However, the regression model developed using pure mycotoxins explained a proportion of total variation of dependent variables (Vf and VFA production), suggesting that other factors not investigated in the present work could influence the response parameters of the gas production curve. This deserves further investigation.
The presence of more than one mycotoxin could result in a synergic interaction causing higher hazards than the presence of a single toxin; however, little information is currently available for ruminants. A review of experiments carried out to verify synergic effects of mycotoxins on animal performances was reported in CAST (2003). Among these, Harvey et al. (Reference Harvey, Edrington, Kubena, Elissalde, Corrier and Rottinghaus1995), using lambs fed a diet highly contaminated with both aflatoxin B1 (from A. parasiticus grown on autoclaved rice) and diacetoxyscirpenol (from standard) for 14 days, reported a significant synergic effect of these toxins, with higher losses of appetite and body weight than were observed in animals fed with the single mycotoxins at the same level. The experimental design adopted in CCD allows for evaluation of either single or combined effects of mycotoxin concentrations by testing the complete quadratic polynomial function of tested factors (St-Pierre & Weiss Reference St-Pierre and Weiss2009). Thus, the presence of synergic effects of tested mycotoxins might be detected. However, the reduced number of treatments within CCD could decrease the power to test for effects of interest. Therefore, a second experiment was carried out in which all treatments of tested factors (i.e. presence of different levels of MY and RC in rumen fluid) were present. Based on the results of the CCD, PR was not included in the FFD experiment. Overall, MY and RC reduced Vf and VFA productions and data from both experiments revealed as concomitant presence of MY and RC altered linearly or almost linearly in vitro rumen fermentation parameters, suggesting these toxins could negatively impact rumen microbial activity with an additive or slightly more than additive response (CAST 2003).
Other than MY and RC, the effect of PR concentration in diluted rumen fluid was tested in CCD. As summarized by Pedrosa & Griessler (Reference Pedrosa and Griessler2009), different studies conducted on laboratory animals have reported high toxicity for PR. However, evidence of toxic effects due to PR ingestion in ruminants is scarce and uninformative (Storm et al. Reference Storm, Sørensen, Jens, Rasmussen, Nielsen and Thrane2008; Whitlow & Hagler Reference Whitlow and Hagler2010). Under current experimental conditions, PR was not detected in rumen fluid after 48 h of incubation. It has been reported the PR-toxin molecule is unstable in acid conditions, becoming destabilized at pH <3 (Nout et al. Reference Nout, Bouwmeester, Haaksma and Van Dijk1993). This condition was not met for the present in vitro gas production test, in which the used rumen fluid was buffered. More likely, since ammonia, basic and neutral amino acids could react with PR forming PR imine, the mother molecule may be undetectable (Driehuis Reference Driehuis2013). In the current CCD experiment, PR did not interfere with any of the rumen fermentation parameters investigated, nor with the end-products, supporting the hypothesis that rumen microflora have a significant capacity to detoxify PR to less toxic compounds. Thus, PR seemed less hazardous for ruminants than other tested mycotoxins.
With the exception of PR, >40% of either MY or RC were recovered after 48 h of rumen incubation, indicating that these two mycotoxins could not be degraded in the rumen and could reach the intestine unchanged, with possible antimicrobial activity on intestinal microflora or toxic effects on host animals (Morgavi et al. Reference Morgavi, Boudra, Jouany and Michalet-Doreau2004; Fink-Gremmels Reference Fink-Gremmels2008a ). Regarding the fate of undetected mycotoxins, various authors have suggested that mycotoxins could be degraded or detoxified by the rumen microbial ecosystem (Niderkorn et al. Reference Niderkorn, Morgavi, Pujos, Tissandier and Boudra2007; Fink-Gremmels Reference Fink-Gremmels2008b ; Jiang et al. Reference Jiang, Yang and Lund2012). Furthermore, either chlorophyllin structures present in the rumen or other cell-wall components of bacteria and yeasts could form stable complexes with mycotoxins, thus reducing their absorption into the bloodstream (Niderkorn et al. Reference Niderkorn, Morgavi, Pujos, Tissandier and Boudra2007; Moschini et al. Reference Moschini, Gallo, Piva and Masoero2008). In previous works, the amounts of AFB1 and AFG1 sequestered by rumen fluid have been quantified, indicating that 20–25% of the total toxins were recovered in the rumen pellet (Moschini et al. Reference Moschini, Gallo, Piva and Masoero2008; Gallo & Masoero Reference Gallo and Masoero2010). A similar approach was used in the present work and in both experiments the MSIrp of MY was numerically lower than MSIrp of RC. This could be due to either a different solubility of mycotoxins in rumen environment, MY being more soluble than RC in water media, or to a different aptitude of rumen microorganisms to metabolise or bind these toxins. Furthermore, MSIrp and MSItot of MY increased linearly (P<0·05), increasing MY concentration in diluted rumen fluid in CCD: the MSIrp and MSItot of RC were also increased with RC concentration. These findings support the idea that the antimicrobial activity of both mycotoxins reduced the capacity of rumen microorganisms to convert these molecules at increasing concentrations. Different results were observed in FFD with respect to CCD, where a smaller range of variation and lower data variability of these parameters were observed. In particular in FFD, MSIrp of RC and MSItot of MY decreased (P<0·05) when increasing concentrations of a specific mycotoxin in diluted rumen fluid. Despite similar experimental conditions (rumen donor animals, animal diet, incubated substrate, rumen to buffer ratio, etc.), observed discrepancies between CCD and FFD could probably be attributed to interactions between the substrate and microbiota available in the specific fermentation, or variability related to in vitro procedures (Giuberti et al. Reference Giuberti, Gallo, Masoero, Ferraretto, Hoffman and Shaver2014), more than the mycotoxin effects themselves. Nonetheless, further investigations are required for a clearer understanding of biotic and abiotic factors that could affect persistence of these mycotoxins in rumen environment (Morgavi et al. Reference Morgavi, Boudra, Jouany and Michalet-Doreau2004).
Purified standards of these mycotoxins were used in the current experiment to obtain exact concentrations of each mycotoxin in diluted rumen fluid as set a priori and to model fermentation-response parameters considering exact mycotoxin concentrations. However, these mycotoxins are never produced alone in nature and secondary metabolites produced by P. roqueforti or other mycotoxigenic strains are often detected in contaminated feedstuffs (D'Mello & Macdonald Reference D'Mello and Macdonald1997; Morgavi et al. Reference Morgavi, Boudra, Jouany and Michalet-Doreau2004; Fink-Gremmels Reference Fink-Gremmels2008b ; Storm et al. Reference Storm, Sørensen, Jens, Rasmussen, Nielsen and Thrane2008; Driehuis et al. Reference Driehuis, Spanjer, Scholten and te Giffel2008b ; Driehuis Reference Driehuis2013). For instance, Borreani et al. (Reference Borreani, Tabacco, Antoniazzi and Cavallarin2005), while monitoring 43 maize silages collected from 19 dairy farms in Northern Italy over 4 years (2000–2003), reported that incidences of ZEA in maize silages harvested in August, September or October were 0, 19 and 27%, respectively. Furthermore, ZEA was detected in 15% of samples collected in the core of feed-out face of maize silage silos. In an analogous period but in different climate conditions, Driehuis et al. (Reference Driehuis, Spanjer, Scholten and te Giffel2008a ) reported high incidences of DON and ZEA (72 and 29%, respectively) in maize silages collected in the Netherlands. More recently, Pietri et al. (Reference Pietri, Battilani, Gualla and Bertuzzi2012) reported that maize kernels harvested in Northern Italy were commonly contaminated by DON and fumonisins (average contamination values of 227 and 5429 μg/kg, respectively), whereas presence of other trichotecenes and ZEA was generally sporadic and at low concentrations.
Furthermore, mycotoxins and other xenobiotics could be conjugated or bound by vegetative organisms to carbohydrate or protein matrixes, thus forming plant metabolites called masked mycotoxins (Berthiller et al. Reference Berthiller, Crews, Dall'Asta, De Saeger, Haesaert, Karlovsky, Oswald, Seefelder, Speijers and Stroka2013). As hypothesized, rumen fermentation processes could make bound mycotoxins available and result in worse toxic effects than expected by mycotoxins alone, quantified with conventional analytical methods (Fink-Gremmels Reference Fink-Gremmels2008b ). Therefore, using pure mycotoxins could result in lower results compared with naturally contaminated feeds or extracts of fungi cultures containing mycotoxins incubated in rumen fluid (Morgavi et al. Reference Morgavi, Boudra, Jouany and Michalet-Doreau2004; Jeong et al. Reference Jeong, Lee, Simizu, Tazaki, Itabashi and Kimura2010). Mycotoxin-contaminated extracts of maize silage that was either visibly mouldy or had no visible sign of mould caused a larger depressing effect on rumen microflora than that observed by using pure mycotoxin at the same level of contaminations (unpublished data), suggesting that these aspects need future investigations.
The effect of mycotoxins with antimicrobial activity (i.e. beauvericin and enniatins) in dairy cows could cause low feed conversion and diarrhoeic events, thus decreasing milk production and increasing somatic cell counts (Fink-Gremmels Reference Fink-Gremmels2008b ). Even if there is no evidence supporting similar effects for MY and RC, the properties of these mycotoxins on in vitro rumen fermentation patterns support the idea of some interference with the activity of the rumen and intestinal microorganisms, with possible consequence on animal performance and health status when present in feeds. However, specific in vivo studies are warranted to support these finding in practical conditions.
CONCLUSION
In both experiments, the MY and RC from pure standards at concentration levels that could be found in naturally contaminated diets reduced the rumen fermentation activity and the total VFA production. Furthermore, these two mycotoxins seemed to be partially stable in the rumen environment after 48 h of in vitro incubation and could reach the intestinal tract unchanged, thus also interfering with the intestinal microflora. In contrast, PR did not affect microbial fermentation activity and seemed to be completely degraded by rumen microorganisms.
The authors are grateful to Paola Fortunati, Annalisa Mulazzi and Silvia Rastelli for their valuable help in lab analysis. Financial support was provided by the FILIGRANA project ‘Valorizzazione della produzione del Grana Padano DOP tramite il controllo di filiera e l'ottimizzazione dei processi produttivi’ of MiPAAF (Ministero delle Politiche Agricole Alimentari e Forestali – Italy).