





Impact Statement
Rivers connect terrestrial and marine environments and play an important role in global plastic pollution. Rivers mobilize, transport, deposit and retain plastic, especially during riverine floods. We show that after flood events, plastic is not deposited evenly on riverbanks and floodplains. Some landcover elements, like debris piles and vegetation, have (much) higher plastic item and concentrations than, for example, grass. Plastic is also not distributed evenly between the waterline and the highest floodline; it seems the majority of plastic is found either close to the highest floodline or the waterline. The results from this study can contribute to a better understanding of plastic transport and distribution in the environment. Following flood events specifically, our findings can be utilized to develop targeted clean-ups and improve plastic monitoring and mitigation measures.
Introduction
Rivers connect the terrestrial and marine environments and have the ability to transport materials of both natural and anthropogenic origin. One such anthropogenic material is macroplastic and other human-made litter. Recent evidence has shown that rivers can retain plastic pollution for decades (Tramoy et al., Reference Tramoy, Gasperi, Colasse and Tassin2020; van Emmerik et al., Reference van Emmerik, Mellink, Hauk, Waldschläger and Schreyers2022; McGoran et al., Reference McGoran, Clark, Smith and Morritt2023). Within rivers, the riverbanks and floodplains are estimated to contribute the most to total stored plastic pollution (Schreyers et al., Reference Schreyers, van Emmerik, Huthoff, Collas, Wegman, Vriend, Boon, de Winter, Oswald, Schoor, Wallerstein, van der and Uijlenhoet2024b). Riverbanks presumably go through a continuous cycle of material deposition and (re-)mobilization, due to waves and water-level changes, whereas floodplains are only activated during overbank discharge events. Floods mobilize high amounts of macroplastic (Roebroek et al., Reference Roebroek, Harrigan, van Emmerik, Baugh, Eilander, Prudhomme and Pappenberger2021; MacAfee and Löhr, Reference MacAfee and Löhr2024; Pow et al., Reference Pow, Fellows, White, Woodford and Quilliam2025), due to various factors such as surface runoff, increased water level and combined sewer overflow (Roebroek et al., Reference Roebroek, Harrigan, van Emmerik, Baugh, Eilander, Prudhomme and Pappenberger2021; van Emmerik, Reference van Emmerik2024). As a consequence, plastic transport is not temporally steady, but rather a large fraction of the annual transport occurs during a short fraction of time (van Emmerik et al., Reference van Emmerik, Tramoy, Van Calcar, Alligant, Treilles, Tassin and Gasperi2019, Reference van Emmerik, Frings, Schreyers, Hauk, de Lange and Mellink2023; Wagner et al., Reference Wagner, Klo, Stier, Ro, Seiwert, Reemtsma and Schmidt2019).
Some proportion of the macroplastic is transported through the river system to estuaries and potentially into the sea (Korshenko et al., Reference Korshenko, Zhurbas, Osadchiev and Belyakova2020; Pierdomenico et al., Reference Pierdomenico, Ridente, Casalbore, Di Bella, Milli and Chiocci2022). However, it seems that large amounts of macroplastic transported during flood events do not actually reach the sea, or even the estuary. Rather they are trapped and deposited on riverbanks and floodplains, often not very far from the source or entry point (Hauk et al., Reference Hauk, van Emmerik, van der Ploeg, de Winter, Boonstra, Löhr and Teuling2023b, Reference Hauk, van der Ploeg, Teuling, de Winter and van Emmerik2024; Pace et al., Reference Pace, Lourenço, Ribeiro, Rodrigues, Pascoal and Cássio2024). As floodplains are only activated during flood events, they provide increased potential for plastic deposition during flood events, compared to non-flood conditions.
Macroplastic deposition on riverbanks and floodplains has been linked to multiple variables, and it seems inundated trees and dense riparian vegetation show high trapping efficiency (Gallitelli et al., Reference Gallitelli, Cutini and Scalici2024; Valyrakis et al., Reference Valyrakis, Gilja, Liu and Latessa2024; Schreyers et al., Reference Schreyers, Hauk, Wallerstein, Teuling, Uijlenhoet, van der Ploeg and van Emmerik2025b). However, macroplastic deposition has also been linked to proximity to highly populated areas, with a less clear relation to vegetation structure (Palmas et al., Reference Palmas, Cau, Podda, Musu, Serra, Pusceddu and Sabatini2022; Pace et al., Reference Pace, Lourenço, Ribeiro, Rodrigues, Pascoal and Cássio2024). In some cases, floodplains retain the majority of macroplastic along rivers, compared to riverbanks (Schreyers et al., Reference Schreyers, van Emmerik, Huthoff, Collas, Wegman, Vriend, Boon, de Winter, Oswald, Schoor, Wallerstein, van der and Uijlenhoet2024b; Huthoff et al., Reference Huthoff, Wegman, Schreyers, van Emmerik and da Silva2025). Woodjams can also be efficient in macroplastic retention, especially in mountainous rivers (Liro and Gallitelli, Reference Liro and Gallitelli2025; Rajwa-Kuligiewicz et al., Reference Rajwa-Kuligiewicz, Bojarczuk, Lenart-Boroń, Kaflińska and Suwalska2025), but also in urban streams (Hoellein et al., Reference Hoellein, Kim, Lazcano and Vincent2024a). Macrophytes on riverbanks (dos Anjos Guimarães et al., Reference dos Anjos Guimarães, Aquino Pereira, Rocha de Moraes, Ando, Martinelli Filho, Perotti, Sant’Anna and Hattori2024), as well as floating plants, such as water hyacinths, can also be efficient in trapping macroplastic, with, for example, significantly higher macroplastic densities in hyacinth patches compared to the surrounding water (Schreyers et al., Reference Schreyers, van Emmerik, Bui, Biermann, Uijlenhoet, Nguyen, Wallerstein and van der Ploeg2024a). Similar to floating patches of water hyacinths, macroplastic transport has also been linked to floating organic debris ‘rafts’ in rivers (Hoellein et al., Reference Hoellein, Schwenk, Kazmierczak and Petersen2024b). Only a fraction of macroplastics that are transported by rivers is emitted into the sea. However, the majority of macroplastic is most likely retained in and along river corridors. There are numerous studies on macroplastic occurrence and accumulation on riverbanks and floodplains, for example, see Hidayat et al. (Reference Hidayat, Aisyah, Rahmadya, Husrin, Hermana, Hurley and Olsen2022), Uogintė et al. (Reference Uogintė, Byčenkienė, Davtalab and Markevičiūtė2024) and Dalu et al. (Reference Dalu, Oduro, Matsimela, Munyai, Wu, Moyo and Cuthbert2025); however, specific deposition dynamics are less clear. While it is not very clear where plastic is stored in rivers and why, rivers most likely act as long-term plastic storage areas.
The goals of this study are to investigate the effect of riverbank characteristics on the spatial distribution, surface concentration and characteristics of deposited plastic items. We investigated at a detailed level, where macroplastic and other human-made litter (>5 mm, hereafter anthropogenic debris) was deposited on riverbanks and floodplains. More specifically, we sampled anthropogenic debris at 25 locations along the Dutch Meuse river after the summer 2021 flood, and 23 locations along the IJssel river after the winter 2024 flood. We did not do any sampling before the floods, and therefore this study can not give a comparison of pre- and post-flood deposition, but only an insight into deposited anthropogenic debris following flood events. Our field observations included the systematic recording of the landcover elements in which each anthropogenic debris item was found (e.g., trees, shrubs, grass or debris piles), and its distance from the water line. We also recorded the category of anthropogenic debris, following the River-OSPAR categorization (van Emmerik et al., Reference van Emmerik, Vriend and Roebroek2020b) with 110 macroplastic and other litter categories. This detailed sampling allowed us to compare anthropogenic debris count and mass densities between different landcover elements. As we sampled the riverbanks after the flood events, we have no information on when exactly each specific anthropogenic debris item was deposited. However, we are aware that the specific deposition location of each individual item is potentially related to a specific phase of the flood. One example of that is anthropogenic debris items entangled in trees that had been temporarily inundated. We compared the characteristics (size, mass and polymer type) of anthropogenic debris entangled in inundated trees to anthropogenic debris deposited on the ground, and anthropogenic debris deposited within organic debris to anthropogenic debris deposited independently of organic debris. We also investigated the lateral distribution and clustering of anthropogenic debris between the waterline and the highest floodline. This study aimed to conduct a detailed assessment of deposited anthropogenic debris on riverbanks and floodplains, following two flood events. We assume that anthropogenic debris transport is not linear over time, but rather that the majority of anthropogenic debris is in motion during floods and high discharge events. Therefore, investigating and understanding anthropogenic debris motion during floods will cover a large proportion of the annual/decadal anthropogenic debris transport in rivers. The detailed insights from this study could contribute to a better understanding of anthropogenic debris pathways through the freshwater environment and, consequently, improve mitigation and monitoring.
Methods and study area
Study area and flood events
We conducted observations along the Meuse and IJssel floodplains, two Dutch rivers that each flow through multiple cities and towns as potential plastic sources (Figure 1). The Meuse originates in France, crosses Belgium, and drains into the Rhine-Meuse Delta in the southwest of the Netherlands, and its catchment is 35,000 km2. The Meuse has an annual average discharge of 221 m3 s
$ {}^{-1} $
 (years 1911–2017) (Reeze et al., Reference Reeze, Liefveld, Postma, Barneveld, van Kessel, van der Jagt, Smit, Coops and Tjabbes-Van der Gaag2020), and bankful discharge is at ~1.250 m3 s
$ {}^{-1} $
 (Rijkswaterstaat, 1985). Monthly average discharge over the summer, from June to October, is usually below 100 m3 s
$ {}^{-1} $
 . Due to high precipitation, the Meuse usually experiences flooding in winter with the highest average monthly discharge of ~500 m3 s
$ {}^{-1} $
 occurring in January (Reeze et al., Reference Reeze, Liefveld, Postma, Barneveld, van Kessel, van der Jagt, Smit, Coops and Tjabbes-Van der Gaag2020). However, in July 2021, extreme rainfall over Belgium, Luxembourg and Germany caused severe flooding across multiple European rivers (Kreienkamp et al., Reference Kreienkamp, Philip, Tradowsky, Kew, Lorenz, Arrighi, Belleflamme, Bettmann, Caluwaerts, Chan, Ciavarella, De Cruz, de Vries, Demuth, Ferrone, Fischer, Fowler, Goergen, Heinrich, Henrichs, Lenderink, Kaspar, Nilson, Otto, Ragone, Seneviratne, Singh, Skålevåg, Termonia, Thalheimer, van Aalst, Van den Bergh, Van de Vyver, Vannitsem, van Oldenborgh, Van Schaeybroeck, Vautard, Vonk and Wanders2021; Rongen et al., Reference Rongen, Strijker, Pol, Kok, Kolen, Rikkert, Schlumberger, van Haren and Wüthrich2021; Lehmkuhl et al., Reference Lehmkuhl, Schüttrumpf, Schwarzbauer, Brüll, Dietze, Letmathe, Völker and Hollert2022; Mohr et al., Reference Mohr, Ehret, Kunz, Ludwig, Caldas-Alvarez, Daniell, Ehmele, Feldmann, Franca, Gattke, Hundhausen, Knippertz, Küpfer, Mühr, Pinto, Quinting, Schäfer, Scheibel, Seidel and Wisotzky2022), including the Meuse and some of its tributaries. The discharge peak at Eijsden (<10 km south of Maastricht) was estimated at 3179 m3 s
$ {}^{-1} $
 on 15 July 2021, with a return period of >100 years (Kreienkamp et al., Reference Kreienkamp, Philip, Tradowsky, Kew, Lorenz, Arrighi, Belleflamme, Bettmann, Caluwaerts, Chan, Ciavarella, De Cruz, de Vries, Demuth, Ferrone, Fischer, Fowler, Goergen, Heinrich, Henrichs, Lenderink, Kaspar, Nilson, Otto, Ragone, Seneviratne, Singh, Skålevåg, Termonia, Thalheimer, van Aalst, Van den Bergh, Van de Vyver, Vannitsem, van Oldenborgh, Van Schaeybroeck, Vautard, Vonk and Wanders2021; Lehmkuhl et al., Reference Lehmkuhl, Schüttrumpf, Schwarzbauer, Brüll, Dietze, Letmathe, Völker and Hollert2022; Mohr et al., Reference Mohr, Ehret, Kunz, Ludwig, Caldas-Alvarez, Daniell, Ehmele, Feldmann, Franca, Gattke, Hundhausen, Knippertz, Küpfer, Mühr, Pinto, Quinting, Schäfer, Scheibel, Seidel and Wisotzky2022; Strijker et al., Reference Strijker, Asselman, de Jong and Barneveld2023).
Overview of the study area. (a) The Netherlands and its neighboring countries, Belgium (BE) and Germany (DE), and the extent of (b). (b) The Meuse and IJssel rivers with their respective measurement locations and an overview of the main Dutch rivers and relevant cities. Base map from OpenStreetMap and OpenStreetMap Foundation (CC-BY-SA). © https://www.openstreetmap.org and contributors.

Figure 1. Long description
The image consists of two panels, a and b, each containing three horizontal stacked bar charts. The x-axis for all charts represents percentage from 0 to 100. The y-axis labels are Area in meters squared, Items n, and Mass in grams.
Panel a, titled IJssel, uses four categories.
* Area: Grass dominates at approximately 83 percent, followed by Herbaceous at 15 percent, with negligible amounts of Mixed and Debris pile.
* Items n: Grass is 20 percent, Herbaceous is 20 percent, and Debris pile is the largest at 60 percent.
* Mass g: Grass is 60 percent, Herbaceous is 8 percent, and Debris pile is 32 percent.
Panel b, titled Meuse, uses six categories.
* Area: Grass is 53 percent, Herbaceous is 10 percent, Shrubs and Trees are minimal, and Mixed is 35 percent.
* Items n: Grass is 23 percent, Herbaceous is 10 percent, Shrubs is 2 percent, Trees is 15 percent, and Mixed is 50 percent.
* Mass g: Grass is 15 percent, Herbaceous is 5 percent, Shrubs is 2 percent, Trees is 20 percent, and Mixed is 58 percent.
A legend on the right identifies the colors: light green for Grass, yellow for Herbaceous, orange for Shrubs, dark green for Trees, light brown for Mixed, and dark blue for Debris pile.
The IJssel is a branch of the Rhine river, which originates in Switzerland, transects or borders Liechtenstein, Austria, France, Germany and the Netherlands, and drains into the Rhine-Meuse Delta. The Rhine catchment is 185,000 km2. In the east of the Netherlands, the Rhine splits into the Waal (2/3 of the Rhine discharge) and the Pannerdense Kanaal (1/3). The Pannerdense Kanaal then splits into the Nederrijn (1/9) and IJssel (2/9) (Schielen et al., Reference Schielen, Havinga and Lemans2008; De Bruijn et al., Reference De Bruijn, Diermanse, Weiler, De Jong and Haasnoot2022) with the last draining into Lake IJssel. The annual average discharge for the IJssel river is ~330 m3 s
$ {}^{-1} $
 (Reeze et al., Reference Reeze, Van Winden, Postma, Pot, Hop and Liefveld2017), and bankful discharge occurs at ~700 m3 s
$ {}^{-1} $
 (Gensen et al., Reference Gensen, Warmink, Huthoff and Hulscher2020). High levels of precipitation in Germany and the Netherlands from October to December 2023 led to increased discharge in the Rhine and IJssel between December 2023 and January 2024. The IJssel reached a discharge peak of 1,100 m3 s
$ {}^{-1} $
 equaling a discharge with a return period of 4 years (ENW, 2024).
Field data collection
We selected sampling locations along the Meuse and IJssel rivers that are used in the Clean Rivers Project (in Dutch Schone Rivieren), which is run by the North Sea Foundation (Stichting de Noordzee). The Clean Rivers Project covers around 150 riverbank locations (i.e., sampling locations) along the Dutch Meuse and 100 along the IJssel, which are monitored on a routine basis twice per year. For both rivers, we selected locations distributed along the left and right banks, and between locations with high and low surrounding population density (Figure 1). In addition to the routine sampling, we sampled 25 riverbank sites along the Dutch Meuse River, following the 2021 summer flood. We completed the sampling within 3 weeks of the flood event, from 22 July to 4 August (Hauk et al., Reference Hauk, van Emmerik, van der Ploeg, de Winter, Boonstra, Löhr and Teuling2023b), before the start of any large-scale clean-up efforts by municipalities and volunteers (Hendrikx, Reference Hendrikx2021). The riverbank sites along the Meuse river were distributed along the entire length of the Dutch Meuse river (200 km), and were selected based on accessibility, as some floodplains were still inundated at the time of the sampling campaign. Pictures of some samples riverbanks are provided in the Supplementary Material. Along the IJssel, we sampled 23 riverbanks, following the 2024 winter flood, from 25 January to 14 February. We selected sampling locations up to a floodplain width of 100 m (3 out of 23 locations between 100 and 400 m). It should be noted that some floodplains along the IJssel are very wide, up to a few hundred meters. In order to complete the fieldwork before the large-scale clean-up started on 15 February, we selected locations with narrower floodplains.
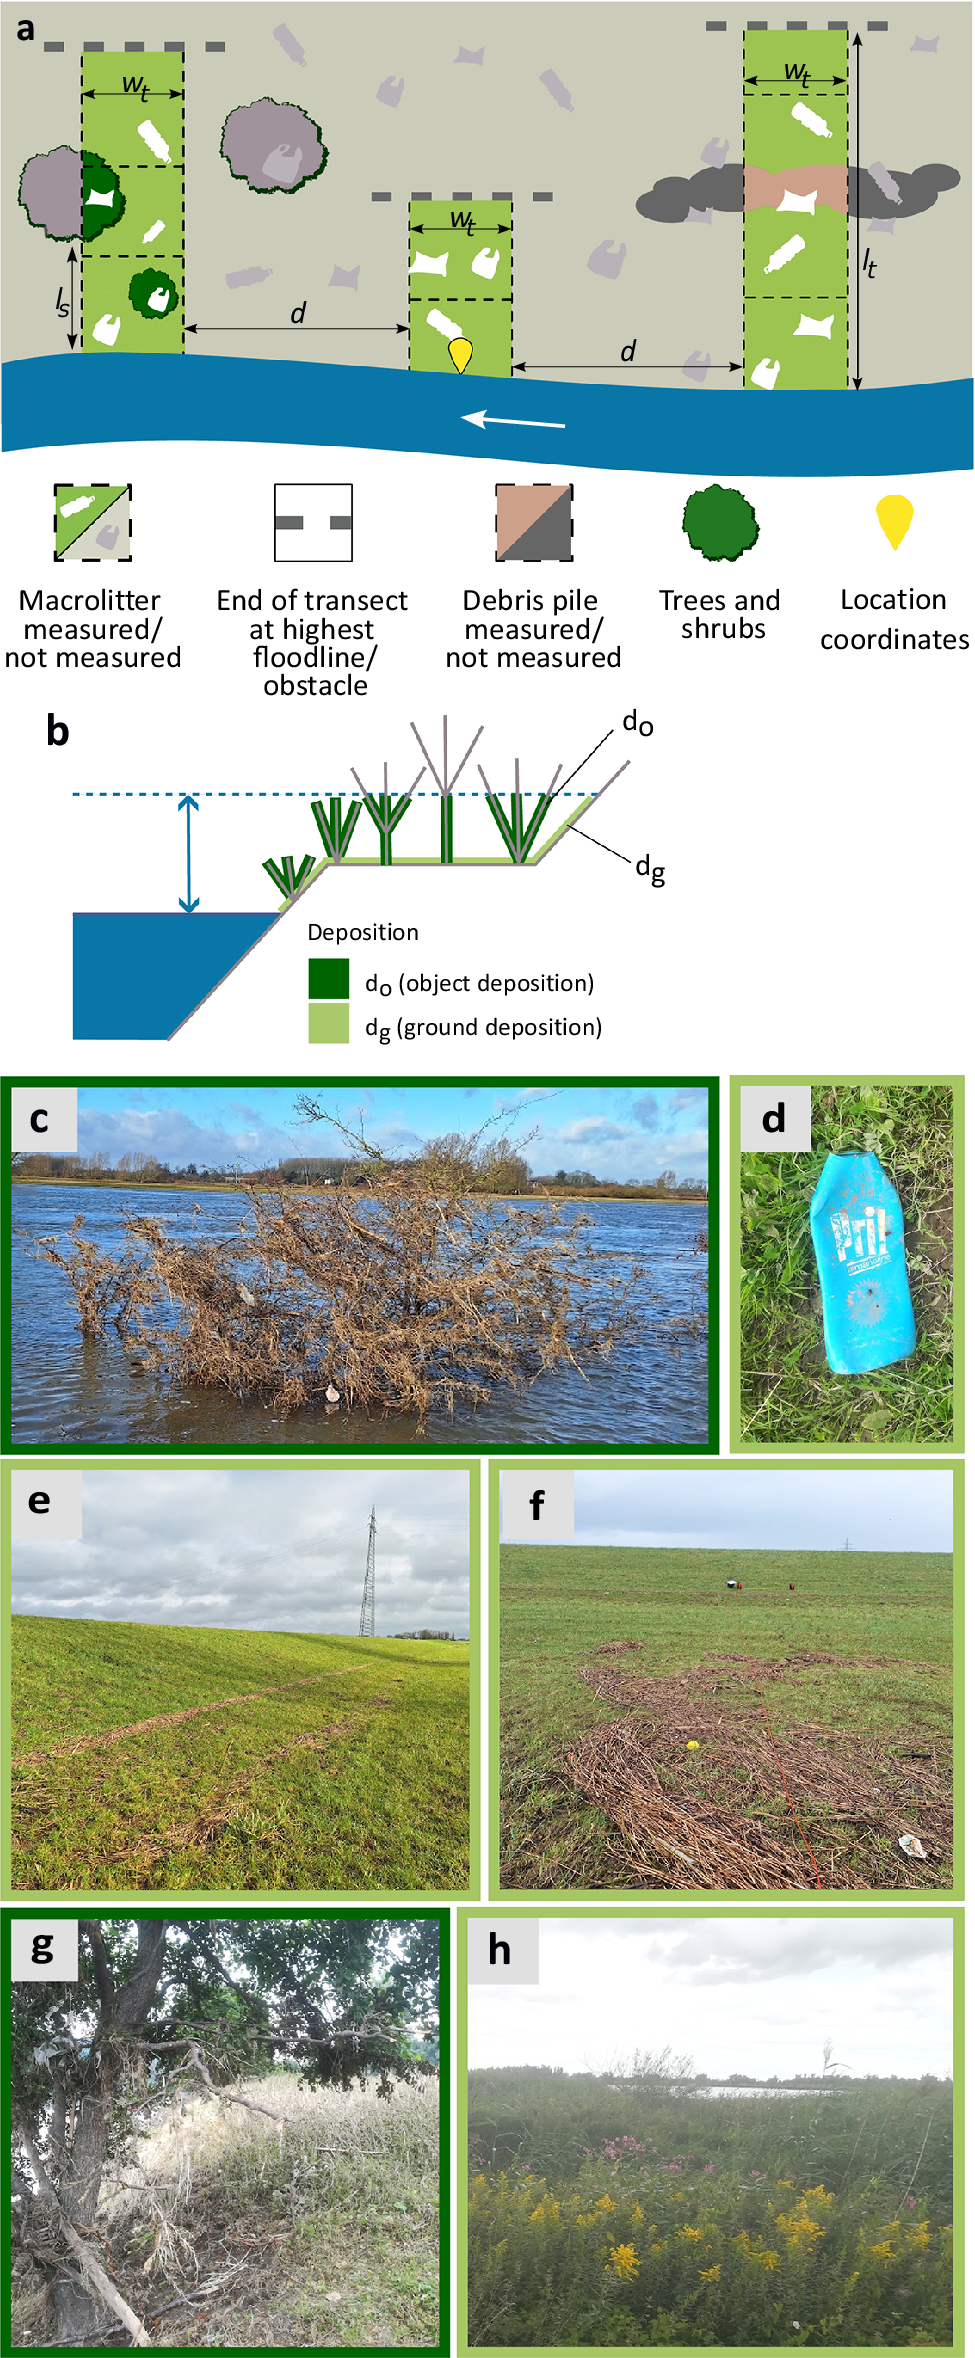
At each location, we started the measurements at the coordinates of the Clean Rivers monitoring location. Usually, on each riverbank, three transects of 2 m width were sampled with a distance of 40 m between them (Figure 2a) (Hauk et al., Reference Hauk, van Emmerik, van der Ploeg, de Winter, Boonstra, Löhr and Teuling2023b). Each 2 m-wide transect was sampled in 3 m-long sections to document the location of items between the waterline and the highest floodline. This sampling approach allowed us to cover the entire depth of riverbanks and floodplains, from waterline to highest floodline, within the available time. For the sampling in 2021, we placed a measurement tape from the waterline toward the highest floodline. We walked along the measurement tape with two observers and documented all anthropogenic debris items, and in which 3 m-long section of the transect they were located. For each section, we recorded the landcover elements (‘grass/bare’, ‘herbaceous’, ‘shrubs’, ‘trees’, ‘debris pile’ or ‘mixed’, if multiple landcover elements were present in one section) (Figure 2). We identified ‘shrubs’ as plants with woody branches, but no tree trunk, and ‘trees’ as plants with a woody tree trunk and branches. We also recorded whether an item was deposited on the ground or in ground covering vegetation (
$ {d}_g $
 ), or off the ground in an object such as a tree (
$ {d}_o $
 ) (Figure 2b). For
$ {d}_o $
 items, the type of element was noted. For these
$ {d}_o $
 items, we also checked if the tree or other object showed signs of previous inundation, such as sediment on leaves, and deposited organic debris, to avoid including anthropogenic debris items deposited by wind. All items were categorized into the 110 River-OSPAR categories, based on the protocol developed by the North Sea Foundation (van Emmerik et al., Reference van Emmerik, Roebroek, De Winter, Vriend, Boonstra and Hougee2020a). Contrary to the protocol, we left all items in place and did not collect them. Along the Meuse, we also sampled trees outside the 2 m transects, which showed signs of inundation due to the presence of deposited organic debris and anthropogenic debris in the branches. These additional measurements were only taken into account to compare the characteristics of
$ {d}_g $
 (ground deposition) versus
$ {d}_o $
 (object deposition) anthropogenic debris (Figure 5a). For the Meuse, we sampled debris piles only based on what was visible at the surface, and did not disentangle the debris piles; this was due to time constraints and was improved for the IJssel measurements. We made some adjustments for the sampling along the IJssel in 2024. A tape measure was used to identify 3 m sections and to subdivide the area by individual elements within each section, so this time it did not include ‘mixed’ sections. Each anthropogenic debris item was again recorded with the respective River-OSPAR ID and also according to which landcover element it was found in. Debris piles consisted mainly of plant debris such as pieces of reed, small branches, grass and leaves, but also included anthropogenic debris. If a debris pile was present in the transect, depending on the dimensions of the debris pile, either all debris in the transect was sampled, or only a randomly selected sub-section area. The debris pile was deconstructed and searched for anthropogenic debris items through its entire depth.
Overview of the sampling approach and landcover elements. (a) Riverbanks were sampled in three transects from the waterline toward the highest floodline. Transect width
$ {w}_t $
 was 2 m, distance d between transects was 40 m, where possible (30–300 m). Each transect was sampled in multiple sections, with a section length
$ {l}_s $
 , which add up to the transect length
$ {l}_t $
 . (b) Anthropogenic debris items deposited in objects (
$ {d}_o $
 ) and on the ground/in-ground covering vegetation (
$ {d}_g $
 ). The blue dashed line and double-sided arrow indicate the changes in water level. Figure (a) adapted from Hauk et al. (Reference Hauk, van Emmerik, van der Ploeg, de Winter, Boonstra, Löhr and Teuling2023b). Examples of the different elements and deposited anthropogenic debris in this study. (c) In a partially inundated shrub, (d) anthropogenic debris on grass, (e) distinct debris lines along previous highest floodlines, (f) debris on a less steep section of riverbank, (g) in a tree and (h) herbaceous vegetation (pictures by Rahel Hauk).

Figure 2. Long description
The figure consists of eight panels labeled a through h.
Panel a is a schematic map of a riverbank. A blue river flows at the bottom with a white arrow pointing left. Three green vertical transects extend from the water toward a dashed grey line representing the highest floodline. Labels include w sub t for transect width, l sub t for total transect length, l sub s for section length, and d for the distance between transects. Icons below the map define macrolitter, transect ends, debris piles, trees, and location coordinates.
Panel b is a cross-sectional diagram of a riverbank slope. A blue water level is shown with a double-sided vertical arrow indicating level changes. Green vegetation icons are labeled with d sub o for object deposition (debris caught in plants) and d sub g for ground deposition (debris on the soil surface).
Panels c through h are photographs of field conditions.
* c: A large, partially submerged brown shrub in a river containing trapped white debris.
* d: A close-up of a blue plastic bottle on green grass.
* e: A wide shot of a grassy embankment showing distinct horizontal lines of brown organic debris.
* f: A flat grassy field with scattered patches of brown debris and a yellow marker.
* g: A large tree with thick branches overhanging a riverbank with dry vegetation.
* h: A dense field of tall herbaceous plants with yellow flowers under a cloudy sky.
Data analysis: Anthropogenic debris item and mass concentrations
We investigated the deposited anthropogenic debris for each landcover element individually. Per landcover element, we calculated the anthropogenic debris density by item count [#/m2] and mass [g/m2]. Further, we wanted to know whether the characteristics of deposited anthropogenic debris differed between landcover elements. We estimated average item mass, length and width per landcover element based on the dataset from de Lange et al. (Reference de Lange, Mellink, Vriend, Tasseron and van Emmerik2022). We linked this dataset to our own data based on the River-OSPAR litter categories. For the length-width ratio, we divided the length by the width for each item to assess the item shape (elongated vs. compact). To further analyze anthropogenic debris characteristics in different elements, we aggregated the macroplastic litter categories by polymer type, based on Vriend et al. (Reference Vriend, Van Calcar, Kooi, Landman, Pikaar and Costa2020) (polystyrene [PS], polyethylene terephthalate [PET], expanded polystyrene [EPS], hard polyolefins [PO Hard], soft polyolefins [PO Soft] and Other) and the nonplastic by River-OSPAR material group (paper, rubber, glass and metal). In this method, the polymer types are an estimation based on the River-OSPAR litter categories and the polymers they are typically made from.
We analyzed the data on debris piles only for the IJssel, since at the Meuse, debris piles had only been sampled at the surface and not the entire depth. Characteristics of anthropogenic debris entangled in shrubs and trees were only analyzed for the Meuse, since along the IJssel, only three anthropogenic debris items were found entangled in trees and shrubs. Regarding debris piles along the IJssel, we checked each transect for the presence of debris; those transects with debris were then checked for the presence of any vegetation other than grass between the waterline and the debris. Based on this, the debris data were grouped into debris behind only grass and debris behind higher vegetation (any vegetation higher than grass). Since the IJssel sampling was conducted in the European winter, the grass was very short (<5 cm). This was done to test whether vegetation acts as a filter on inundated floodplains. To test whether the items in debris behind vegetation versus debris behind only grass had different characteristics, we conducted Mann–Whitney U-tests (as the data was not normally distributed), to test for significant differences in item length, mass and length-width ratio.
For the Meuse, we investigated the item characteristics for
$ {d}_o $
 items versus
$ {d}_g $
 items, to test whether some items were more likely to be entangled in inundated riparian vegetation. Since the data were also not normally distributed, we again conducted Mann–Whitney U-tests for item length, mass and length-width ratio.
Data analysis: Clustering and lateral distribution
To investigate the anthropogenic debris deposition patterns on riverbanks and floodplains post-flood, we also examined the lateral item and mass distribution along each transect between the waterline and end of the transect (Figure 3). For each transect, we normalized the transect length from zero (waterline) to one (end of transect) and divided it into quartiles. We normalized the item count and mass per transect to one and summarized the share of item mass and count found per quartile. Based on this, we deduced four modes of deposition, which were test fitted by three mathematical functions, ‘bounded increase function’, ‘exponential increase function’, ‘linear function’ and ‘other’. A bounded increase function means that >50% of items were deposited in the first quartile, closest to the waterline. An exponential increase function means that >50% of items were deposited in the last quartile, in or closest to the highest floodline. A linear function means that each quartile had <50% but >10% of items, and ‘other’ means the distribution does not follow any of the previous three functions. We did this analysis based on item count and also based on mass distribution.
Examples for the three defined modes of deposition ‘linear’ (transect a), ‘exponential increase’ (transect b) and ‘bounded increase’ (transect c). The gray functions are hypothetical, to illustrate the different distributions.

Figure 3. Long description
The y-axis represents the cumulative sum of items from 0.00 to 1.00. The x-axis represents the distance from the waterline to the end of the transect from 0 to 1. Each panel contains a black line with circular markers for observed data and a smooth gray line for the hypothetical model.
* Transect a (Left): The observed data follows a staggered step-like path that closely tracks a linear gray diagonal line, representing a linear deposition mode.
* Transect b (Middle): The observed data remains low for most of the x-axis before rising sharply at the end. This is compared to a gray curve that bends upward, representing an exponential increase mode.
* Transect c (Right): The observed data rises almost vertically near the waterline and plateaus quickly at 1.00. This is compared to a gray asymptotic curve that rises quickly then levels off, representing a bounded increase mode.
To quantify whether the anthropogenic debris items were linearly distributed between the waterline and the end of the transect, or concentrated in just one of the sections, we investigated the degree of clustering. For this, we considered all transects that had at least two anthropogenic debris items (64/70 transects for the Meuse and 49/51 transects for the IJssel). We calculated the percent of anthropogenic debris items per section for each transect, and also the percent of transect area covered by each section. We then sorted the sections from highest anthropogenic debris percentage to lowest per transect, and calculated the cumulative sum of anthropogenic debris and section area. We then determined the absolute maximum difference between the cumulative item sum and a linear distribution. The higher this absolute difference, the more clustered the items in the transect. If the maximum absolute difference was zero, it would mean all plastic items are uniformly distributed between the waterline and the highest floodline. If the maximum absolute difference was one, it would mean all anthropogenic debris items sampled in a transect are located in just one section.
Results and discussion
Overview: Sampled landcovers and anthropogenic debris concentrations
Along the IJssel in winter 2024, the 51 transects covered a total area of 5,729 m2 with 2,785 anthropogenic debris items and a total related mass of 9.9 kg (Figure 4). Of the 5,729 m2, 128 m2 were covered by debris piles, representing 2.2% of the total sampled area; however, comprising 58.3% of items by count and 32.3% of items by mass. This translates to an item density of 12.7 items m
$ {}^{-2} $
 and a mass density of 25.0 g m
$ {}^{-2} $
 , whereas grass showed densities of only 0.12 items m
$ {}^{-2} $
 and 1.22 g m
$ {}^{-2} $
 , respectively. The transects we measured along the Meuse in summer 2021 covered a total of 6,477 m2, with 1,863 items and a total related mass of 22.6 kg. Of these transects, 15 of 69 were covered by only grass; their average item and mass density was 0.40 items m
$ {}^{-2} $
 and 2.55 g m
$ {}^{-2} $
 , whereas in transects that contained vegetation other than grass, this was 0.83 items m
$ {}^{-2} $
 and 10.44 g m
$ {}^{-2} $
 , respectively. Within the transects we sampled along the Meuse, there were 6 m2 of distinct debris piles, but often debris piles only covered part of a section and were then recorded as part of the ‘mixed category’.
Composition of sampled landcover elements and anthropogenic debris count and mass per landcover element for (a) IJssel and (b) Meuse river. (c) Overview of the different vegetation elements and their corresponding item count and mass densities. *For the Meuse river, transect sections that contained multiple elements were recorded as ‘mixed’; for the IJssel river, the method was improved and the different elements were recorded as subsections. Therefore, there are no mixed elements in the IJssel data. **Debris along the Meuse was sampled only at the surface (no digging through the debris), most likely this severely underestimates the number of items and mass; also, ‘mixed’ elements can include debris.

Figure 4. Long description
The image consists of three panels.
Panel a, IJssel river, shows three horizontal stacked bar charts representing Area in meters-squared, Items n, and Mass in grams on a percentage scale from 0 to 100. Area is dominated by Grass (light green, approximately 85 percent) and Herbaceous (yellow, 12 percent). Items are distributed between Grass (20 percent), Herbaceous (20 percent), and Debris pile (dark blue, 60 percent). Mass is split between Grass (60 percent), Herbaceous (8 percent), and Debris pile (32 percent).
Panel b, Meuse river, uses the same format. Area is composed of Grass (55 percent), Herbaceous (10 percent), Shrubs (orange, 2 percent), and Mixed (tan, 33 percent). Items are distributed across Grass (25 percent), Herbaceous (10 percent), Shrubs (2 percent), Trees (dark green, 15 percent), and Mixed (48 percent). Mass is dominated by Mixed (55 percent) and Trees (20 percent).
Panel c is a table titled Per element.
For the Meuse river, total values across all transects are 6477 meters-squared area, 1863 items, and 22593 grams mass. Item density is highest in Debris piles (5.67 per meter-squared) and Trees (3.02 per meter-squared). Mass density is highest in Trees (53.53 grams per meter-squared) and Debris piles (34.83 grams per meter-squared).
For the IJssel river, total values are 5729 meters-squared area, 2785 items, and 9898 grams mass. Item density is highest in Debris piles (12.70 per meter-squared). Mass density is highest in Debris piles (25.01 grams per meter-squared). The Mixed category is empty for the IJssel river.
Anthropogenic debris deposited in riparian vegetation
Of the 3,587 anthropogenic debris items sampled along the Meuse, 70% were ground deposition
$ {d}_g $
 (on surface or grass) and 30% were object deposition
$ {d}_o $
 (in trees and shrubs) (Figure 5a). Of
$ {d}_o $
 , 84% of items were soft anthropogenic debris items (PO Soft and Textile) versus
$ {d}_g $
 , with 53% of soft anthropogenic debris items. This was reversed for rigid materials (PO Hard, PS and EPS), with 31% of
$ {d}_g $
 items and 7% of
$ {d}_o $
 items. Items deposited in objects are 33% larger in size and 10% higher in mass (average 13.4 g and 17.7 cm, Figure 5c), compared to items deposited on the ground (average 12.2 g and 13.3 cm). However, the data from de Lange et al. (Reference de Lange, Mellink, Vriend, Tasseron and van Emmerik2022) that we based our size and mass estimates on were recorded over the course of 1 year, not specifically after high discharge periods.
(a) Anthropogenic debris sampled following the 2021 summer flood along the Meuse river, showing a comparison between anthropogenic debris deposited in riparian vegetation off the ground
$ {d}_o $
 (dark green), on the ground and in the ground covering vegetation
$ {d}_g $
 (light green). (b) Difference in anthropogenic debris composition in debris lines along the IJssel River. On riverbanks with higher vegetation between the waterline and debris line (dark blue), and debris lines with only grass between the debris line and waterline (light blue). The light blue and dark blue bars, respectively, add up to 100%. (c) Comparison between the mass, length and length-width ratio of anthropogenic debris items sampled in object deposition, and anthropogenic debris items sampled in ground deposition. (d) Comparison between the mass, length and length-width ratio of anthropogenic debris items we sampled deposited in debris behind only grass and debris behind higher vegetation along the IJssel in 2024.

Figure 5. Long description
Panel a is a horizontal bar chart showing litter material percentages for object deposition d sub o (dark green) and ground deposition d sub g (light green). P O Soft is the most frequent material for both, exceeding 60 percent for d sub o. Other materials include Textile, Multilayer, P O Hard, P S, E P S, and Other. An inset diagram shows a river cross-section where d sub o is caught in high vegetation and d sub g is on the ground.
Panel b is a horizontal bar chart comparing debris behind vegetation (dark blue) and behind only grass (light blue). P O Soft and P O Hard are dominant. Behind only grass, P O Soft is significantly higher at approximately 45 percent. An inset map shows debris lines relative to a river flow arrow.
Panel c is a table comparing d sub o and d sub g across three metrics.
- Mass in grams: d sub o mean 13.40, d sub g mean 12.20.
- Length in centimeters: d sub o mean 17.70, d sub g mean 13.30.
- Length-width ratio: d sub o mean 8.07, d sub g mean 6.89.
All p-values are less than 0.05.
Panel d is a table comparing debris behind only grass versus behind vegetation.
- Mass in grams: Grass mean 4.20, Vegetation mean 2.98.
- Length in centimeters: Grass mean 5.38, Vegetation mean 4.73.
- Length-width ratio: Grass mean 7.25, Vegetation mean 6.46.
All p-values are less than 0.05.
In the case of
$ {d}_o $
 , the deposition can occur as the water level increases and inundates obstacles such as riparian vegetation. Anthropogenic debris items transported at the surface, or in the water column, encounter the inundated objects and can become entangled, with riparian vegetation acting as a filter. Inundated dense riparian vegetation structures slow down the transport velocity of anthropogenic debris, which increases the likelihood of retention (Valyrakis et al., Reference Valyrakis, Gilja, Liu and Latessa2024). Mutshekwa et al. (Reference Mutshekwa, Mlambo, Mbadla, Mkhencele, Mofu and Osoh MOand Motitsoe2025) found similar patterns along two South African rivers, with multilayer items and PO Soft mostly deposited in herbaceous vegetation and also wood jams. Soft, elongated items are more likely to wrap around the vegetation and become entangled, compared to rigid items having a more compact shape. This could explain the overall higher proportion of soft items (PO Soft and Textiles) with a higher length-width ratio deposited
$ {d}_o $
 (Figure 5c), whereas rigid items (PO Hard, PS and EPS) have a higher tendency to be deposited as
$ {d}_g $
 (Figure 5a). Item deposition
$ {d}_g $
 occurs either due to settling of items, or at the intersection between water and ground surface where the ‘floodline’ or ‘wrack line’ forms.
PO Soft is commonly the predominant type of macroplastic found on riverbanks in the Netherlands (van Emmerik et al., Reference van Emmerik, Roebroek, De Winter, Vriend, Boonstra and Hougee2020a), but is also very common along rivers globally (Talavera et al., Reference Talavera, Dalida and Diola2024; Mutshekwa et al., Reference Mutshekwa, Mlambo, Mbadla, Mkhencele, Mofu and Osoh MOand Motitsoe2025). The fraction of soft anthropogenic debris we found entangled in trees aligns with a study on macroplastic entanglement in trees on riverbanks in Italy (Gallitelli et al., Reference Gallitelli, Cutini, Cesarini and Scalici2025), where 63% of plastic entangled in trees were soft items. Entanglement of anthropogenic debris items during flood events might have been amplified by an increase in anthropogenic debris transported as suspended load in the water column during increased discharge (Vriend et al., Reference Vriend, Schoor, Rus, Oswald and Collas2023). Another study on macroplastic entanglement on riverbanks also found that trees showed higher trapping efficiency compared to grass, shrubs and reeds (Gallitelli et al., Reference Gallitelli, Cutini and Scalici2024). However, contrary to our study, they did not find a significant difference in macroplastic shape and size between elements. A study on flood-deposited macroplastic on Portuguese riverbanks found riparian macroplastic trapping mainly related to litter input and population density, with low explanatory power for the structure of riparian vegetation (Pace et al., Reference Pace, Lourenço, Ribeiro, Rodrigues, Pascoal and Cássio2024). It seems deposition of PO Soft is related to the structure of riparian vegetation; however, that seems not to be the only exploratory factor.
Anthropogenic debris deposited within debris piles
Along the IJssel, we sampled 51 transects, of which 37 transects contained one or multiple distinct organic debris piles (Figure 2c and f). The debris piles overall showed the highest anthropogenic debris density by item count and mass across all elements along the IJssel. On average, debris piles had 12.7 #/m2 and 25.0 g/m2, compared to 0.5 #/m2 and 1.7 g/m2 average across all elements. The average item size and mass within debris piles, however, were smaller than any other element, 4.9 cm and 4.4 g compared to 7.3 cm and 12.6 g for items deposited in grass, and 9.8 cm and 14.2 g for items in herbaceous vegetation, respectively.
There are two main explanations for anthropogenic debris deposition within organic debris. Either plastic and debris follow the same transport dynamics, are possibly entangled during transport and deposited jointly as aggregates, or plastic and debris are transported independently, but are still deposited at the same locations. Besides anthropogenic debris, river floods transport large amounts of various materials such as wood (Wohl, Reference Wohl2013; Dixon and Sear, Reference Dixon and Sear2014), sediment (Karimaee Tabarestani and Zarrati, Reference Karimaee Tabarestani and Zarrati2015; Barneveld et al., Reference Barneveld, Frings, Mosselman, Venditti, Kleinhans, Blom, Schielen, Toonen, Meijer, Paarlberg, van Denderen, de Jong, Beemster, Melsen and Hoitink2025) and organic debris (Mazur et al., Reference Mazur, Kałuża, Chmist, Walczak, Laks and Strzeliński2016). Hoellein et al. (Reference Hoellein, Schwenk, Kazmierczak and Petersen2024b) detected floating macroplastic only in debris rafts, not in the surrounding open water in the Chicago River. Whereas in the Saigon River, van Emmerik et al. (Reference van Emmerik, Janssen, Jia, Bui, Taormina, Quan and Schreyers2025) found that water hyacinth patches transport 73% of floating macroplastic, while the patches only cover 1.3% of the total river surface. It seems likely that macroplastic and debris transported together would also be deposited together on the riverbanks. Another possibility is that on riverbanks and inundated floodplains, transported material is deposited primarily at the land-water interface, that is, the waterline or the highest floodline, also known as a ‘wrack line’, which also contains the highest concentration of organic debris. This is similar to organic debris ‘wrack’ and macroplastic deposited together at the waterline of sandy beaches, which contains higher densities of macroplastic than the surrounding bare sand (Battisti et al., Reference Battisti, Fanelli, Filpa and Cerfolli2020; von Thenen et al., Reference von Thenen, von Loh, Robbe, Abdallah, Escobar-Sánchez, Haseler, M’hiri and Schernewski2025).
Anthropogenic debris in debris piles behind only grass was on average of 41% higher mass and 14% increased length with 4.20 ± 2.38 g and 5.38
$ \pm $
 0.50 cm compared to items in debris piles behind higher vegetation with 2.98
$ \pm $
 1.39 g and 4.73
$ \pm $
 0.30 cm, respectively. The average item density in debris piles behind only grass and behind higher vegetation is almost the same, with 0.31 items dm
$ {}^{-3} $
 and 0.36 items dm
$ {}^{-3} $
 respectively; however, the median item density in debris behind grass is 0.22 items dm
$ {}^{-3} $
 , whereas it is only 0.13 items dm
$ {}^{-3} $
 in debris piles behind higher vegetation. Debris piles located parallel to the waterline, behind only grass, have a >15% higher proportion of PO Soft and a >15% lower proportion of PO Hard fragments, compared to debris piles located behind higher vegetation. This could be linked to soft fragments having a higher chance of being entangled in vegetation, that is, being ‘filtered out’.
Lateral distribution and clustering of anthropogenic debris on riverbanks
For the Meuse and IJssel, we investigated the lateral distribution of anthropogenic debris items and mass between the waterline and the end of the sampling transect. Along the IJssel, we found that items were mainly deposited at or close to the highest floodline, whereas for the Meuse, items were found close to the waterline. For both rivers, most transects (
$ \ge $
 68%) follow one of three distributions: bounded increase, exponential increase or linear (Figure 6). For the Meuse, 49% of transects by item count and 52% of transects by mass follow a bounded increase function, with >50% of anthropogenic debris by count and mass deposited close to the waterline. However, the bounded increase transects only contained 28% of the total items and 22% of the total mass. Transects following a linear distribution contained the highest share of anthropogenic debris by item count (31%) and mass (27%) along the Meuse. For the IJssel, for 49% of transects, the lateral distribution of anthropogenic debris mass between the waterline and the highest floodline followed an exponential increase function. This means that >50% of anthropogenic debris mass per transect is deposited in the fourth quartile of the transects, close to or in the floodline. However, these 49% of transects only contain 23% of the total mass we found. This is likely due to high densities of small anthropogenic debris items in debris lines, which were often located along the highest floodline. Along the IJssel, the first and fourth quartiles each contain 30% of the total anthropogenic debris mass, but the first quartile contains only 24% of items by count, whereas the fourth quartile contains 43% of items by count. A further 23% of transects along the IJssel follow a bounded increase function, where >50% of mass is deposited in the first quartile, close to the waterline at the time of sampling. These 23% of transects contain 37% of the total mass sampled along the IJssel.
Lateral distribution of anthropogenic debris items (green) and mass (blue) between the waterline and the highest floodline/end of the transects. For the Meuse, we sampled a total of 69 transects with a total anthropogenic debris count of 1,863 items, and a total estimated anthropogenic debris mass of 22.6 kg. For the Ijssel, we sampled 51 transects with a total anthropogenic debris count of 2,785, and a total estimated anthropogenic debris mass of 9.9 kg. As the barplots show a cumulative distribution, the fourth quartile (1.00) always shows 1.00.

Figure 6. Long description
The grid is organized into two rows (Meuse and IJssel) and four columns representing distribution types: bounded growth function, exponential growth function, linear function, and other. The y-axis for all plots is Cumulative item count and mass per quartile, ranging from 0.00 to 1.00. The x-axis is Transect quartiles where 0.00 is the waterline and 1.00 is the highest floodline.
* Meuse Row:
- Bounded growth: High concentration near the waterline. Green and blue boxplots reach near 0.75 cumulative value by the 0.25 quartile. Text box indicates 28 percent of total items and 22 percent of total mass.
- Exponential growth: Low initial accumulation, spiking at the end. Boxplots remain below 0.50 until the final quartile. Text box indicates 12 percent of total items and 17 percent of total mass.
- Linear function: Steady increase across quartiles. Boxplots step up from 0.30 to 0.60 to 0.80. Text box indicates 31 percent of total items and 27 percent of total mass.
- Other: Variable distribution. Text box indicates 30 percent of total items and 34 percent of total mass.
* IJssel Row:
- Bounded growth: Similar to Meuse but slightly lower initial density. Text box indicates 20 percent of total items and 37 percent of total mass.
- Exponential growth: Significant concentration in the final quartile. Text box indicates 48 percent of total items and 23 percent of total mass.
- Linear function: Very low representation. Text box indicates 1 percent of total items and 0 percent of total mass.
- Other: Broad distribution across middle quartiles. Text box indicates 31 percent of total items and 40 percent of total mass.
In all panels, green boxplots represent item count and blue boxplots represent mass. All cumulative distributions terminate at 1.00 at the 1.00 quartile mark.
Overall, the percentage of items by count and mass following each distribution is more aligned for the Meuse than for the IJssel. This could be because debris was sampled differently, and most likely, large counts of small, low-mass anthropogenic debris items within debris were overlooked for the Meuse, but not for the IJssel. For the transects along the Meuse and IJssel, we investigated the clustering of items along each transect. Overall, along the Meuse, more transects have a higher level of clustering, compared to the IJssel. This is also reflected in Figure 6, especially the bounded increase function, where the median of cumulative item count for the Meuse is above 0.75 in the first quartile, whereas for the IJssel, the median is just above 0.50. It seems the transects with a maximum clustering value close to one, probably have an anthropogenic debris distribution pattern of one distinct (flood-) line, parallel to the waterline (Tasseron et al., Reference Tasseron, van Emmerik, de Winter, Vriend and van der Ploeg2024). Transects with lower values are located on riverbanks with a more random or uniform distribution.
Anthropogenic debris deposition during a riverine flood event
Some observations on anthropogenic debris deposition during a riverine flood event are relatively obvious. In the case of anthropogenic debris deposition in trees, this occurred during a water level where that section of the tree was inundated. Along the Meuse in 2021, there was also a thin layer of sediment present on vegetation and anthropogenic debris, which was not present higher up in the vegetation, and relatively clearly indicated the maximum level of inundation. However, at which point in time each individual item of anthropogenic debris was deposited is less clear. It is possible that the majority of anthropogenic debris deposited high up in vegetation, and along the flood line at the edge of the inundated area, was pushed ahead of the flood wave. However, the water level stayed at the maximum level for some time, around 4 hours at Sint Pieter south of Maastricht and around 9 hours at Roermond, 69 km downstream of Sint Pieter (Strijker et al., Reference Strijker, Asselman, de Jong and Barneveld2023. As we did not undertake any measurements or observations during the flood event itself, we only observed the accumulated results within the following 3 weeks. It is therefore also possible that anthropogenic debris along the floodline and entangled in trees was deposited at any point in time during the required inundation level. The Meuse flood was quite severe, with a return period of »100 years and large inundated areas, especially upstream of the Dutch Meuse, and along Meuse tributaries (Strijker et al., Reference Strijker, Asselman, de Jong and Barneveld2023). Most likely, large amounts of plastic and other litter were mobilized from inundated areas and flushed into the Meuse (see Hauk et al., Reference Hauk, van Emmerik, van der Ploeg, de Winter, Boonstra, Löhr and Teuling2023b), where we also compared anthropogenic debris deposition following the July 2021 flood to non-flood conditions. Some riverbanks along the Meuse in the upstream section close to the Dutch–Belgian border have relatively steep riverbanks with dense riparian vegetation. We encountered quite high anthropogenic debris concentrations on these riverbanks, in trees and shrubs (2.6–45.8 items m
$ {}^{-2} $
 , mean 12.7) and on the ground (0.0–12.5 items m
$ {}^{-2} $
 , mean 1.0), and it seems a large fraction of anthropogenic debris transported by the flood was deposited there.
The IJssel flood differed from the Meuse flood in estimated return period (4 years for the IJssel [ENW, 2024] and >100 years for the Meuse) (Kreienkamp et al., Reference Kreienkamp, Philip, Tradowsky, Kew, Lorenz, Arrighi, Belleflamme, Bettmann, Caluwaerts, Chan, Ciavarella, De Cruz, de Vries, Demuth, Ferrone, Fischer, Fowler, Goergen, Heinrich, Henrichs, Lenderink, Kaspar, Nilson, Otto, Ragone, Seneviratne, Singh, Skålevåg, Termonia, Thalheimer, van Aalst, Van den Bergh, Van de Vyver, Vannitsem, van Oldenborgh, Van Schaeybroeck, Vautard, Vonk and Wanders2021; Lehmkuhl et al., Reference Lehmkuhl, Schüttrumpf, Schwarzbauer, Brüll, Dietze, Letmathe, Völker and Hollert2022; Mohr et al., Reference Mohr, Ehret, Kunz, Ludwig, Caldas-Alvarez, Daniell, Ehmele, Feldmann, Franca, Gattke, Hundhausen, Knippertz, Küpfer, Mühr, Pinto, Quinting, Schäfer, Scheibel, Seidel and Wisotzky2022; Strijker et al., Reference Strijker, Asselman, de Jong and Barneveld2023) and flood characteristics, which appear to be reflected in the subsequent anthropogenic debris deposition. During the IJssel flood, there were repeated elevated water levels with two distinct discharge peaks between 20 December 2023 and 12 January 2024, with the first peak higher than the second (measured at Olst, around 40 km upstream of Kampen) (WMCN, 2024). These two peaks are potentially reflected in the distinct double lines of debris we encountered along some floodplains (Figure 2e). Schreyers et al. (Reference Schreyers, Hauk, Wallerstein, Teuling, Uijlenhoet, van der Ploeg and van Emmerik2025b) also investigated these two flood events, among others, and investigated in greater detail the link between flood return period and deposited macroplastic. For the Ijssel, we found that only a few trees showed signs of inundation due to plant debris deposited in lower branches. We only found three anthropogenic debris items deposited in trees, and overall, it seemed that at most trees, the inundation level did not reach the branches. With a return period of 4 years, the flood event was less severe than the Meuse flood in 2021. It seems likely that the additional amount of plastic that was flushed into the IJssel during the flood was relatively low.
Limitations
When selecting which riverbanks to include in the sampling along the IJssel, we prioritized narrower floodplains in order to be able to sample the whole extent that had been inundated under tight time constraints. However, wider floodplains have been found to positively correlate with anthropogenic debris concentration (Schreyers et al., Reference Schreyers, Hauk, Wallerstein, Teuling, Uijlenhoet, van der Ploeg and van Emmerik2025b), so there could be a sampling bias in our data, leading to an underestimation of anthropogenic debris concentration. For future sampling and monitoring, we therefore recommend a combination of narrow and wide floodplains to cover the potential variability of anthropogenic debris concentration in the river system.
For the Meuse river, we did not select floodplains based on their potential inundation extent; however, at some locations, it was not possible to sample the entire extent that had been inundated. Therefore, our findings could potentially underestimate the plastic amount, due to not sampling the highest floodline, and missing the proportion of anthropogenic debris deposited within the highest floodline. Whenever possible, we recommend sampling all the way to the highest floodline.
Debris piles were sampled differently between the Meuse and the IJssel sampling campaigns. For the Meuse sampling, we only counted items that were visible on top of the debris from a standing position, without sampling the entire depth of debris until the ground beneath. For the IJssel sampling, on the other hand, we sampled the entire depth of debris. Along the IJssel, we found large quantities of small anthropogenic debris entangled within the debris, on average 12.7 items/m2, compared to 5.7 items/m2 along the Meuse. One of the findings for the Meuse was that there were fewer small anthropogenic debris items post-flood 2021 than under regular conditions (Hauk et al., Reference Hauk, van Emmerik, van der Ploeg, de Winter, Boonstra, Löhr and Teuling2023b). This difference may be an artifact of the different sampling protocols. We expect that the actual density of small anthropogenic debris items within the debris was higher for the Meuse. We therefore recommend always sampling the entire depth of debris and deposited organic matter, depending on time and other constraints, either the entire extent of debris in the sampling area or a sub-section.
Recommendations
For future anthropogenic debris sampling on riverbanks and floodplains following a flood event, we recommend that researchers sample the entire distance between the waterline and the greatest extent of inundation. In the case of the Meuse flood in 2021, this was up to multiple kilometers (Rongen et al., Reference Rongen, Strijker, Pol, Kok, Kolen, Rikkert, Schlumberger, van Haren and Wüthrich2021). Therefore, following this recommendation could lead to quite large sampling areas; however, we expect it would give a more accurate estimate of flood-driven deposition. Since deposition patterns on riverbanks follow different patterns of lateral deposition, sampling only part of the inundation extent could lead to missing the majority of deposited anthropogenic debris. However, we also found that in the majority of transects, the majority of items were concentrated in just one quartile of the transect, either the first or last (Figure 6). Further understanding the dynamics behind this could contribute to optimizing post-flood clean-up strategies, by focusing on the part of riverbanks and floodplains that contain the majority of items, especially under tight constraints of time and other resources. We also recommend that researchers measure the size and mass of anthropogenic debris following a flood event, to compare the item characteristics per River-OSPAR category to the measurements during normal conditions, such as in the dataset of de Lange et al. (Reference de Lange, Mellink, Vriend, Tasseron and van Emmerik2022).
Extreme events potentially flush large amounts of anthropogenic debris into river systems, and are likely to be responsible for a large share of (multi-)annual anthropogenic debris transport (van Emmerik et al., Reference van Emmerik, Tramoy, Van Calcar, Alligant, Treilles, Tassin and Gasperi2019; Roebroek et al., Reference Roebroek, Harrigan, van Emmerik, Baugh, Eilander, Prudhomme and Pappenberger2021). We therefore recommend that sampling be undertaken pre and post such events in anthropogenic debris monitoring campaigns. Sharma et al. (Reference Sharma, Ramachandran, Dobriyal, Badola, Koldewey, Hussain and Badola2025) investigated deposited anthropogenic debris along the Ganga river pre- and post-monsoon. While they did not find a significant difference in debris density, they found a significant difference in debris composition, indicating a displacement of debris. The recommended threshold for events depends on the specific river system and expected inundation extent per event. Since monitoring or research studies often cover only one or a few years, we recommend including any event with a 1-year return period, or any event where the bankfull discharge is exceeded and vegetation is inundated. Regular monitoring and event-related sampling should also cover all landcover elements present in a system, since mass and count density of anthropogenic debris can vary significantly between elements. For representative monitoring of different landcover elements, we suggest the selection of monitoring area(s) so that each landcover element covers a similar share as in the region in general, that is, if 5% of the riverbanks and floodplains are covered by shrubs, about 5% of the monitoring area should be shrubs. Especially debris piles and inundated trees, which may not occur under non-flood conditions, can show a high item and mass density and should be included in event-related anthropogenic debris sampling. Monitoring during regular conditions, as well as post-flood events, can give a baseline to evaluate the state of anthropogenic debris pollution in a certain river, as well as the impact of specific events, and mitigation/prevention measures.
Conclusion
Plastic is not deposited evenly along rivers, either by item and mass concentration or by composition. Soft plastic items are more likely to be entangled in vegetation off the ground, whereas rigid items are more likely to be deposited on the ground. Debris piles only cover relatively small areas on riverbanks and floodplains, but tend to accumulate high concentrations of small plastic items. Also, in the lateral direction normal to the river channel, plastic is not distributed evenly between the waterline and the highest floodline. In the majority of transects we measured along the IJssel and the Meuse, the majority of plastic items are deposited in either the first or last quartile of the transect cross-floodplain. Deposition along the highest floodline could indicate that plastic and other debris are picked up on the rising limb of the hydrograph, transported in this flow, and then deposited at the high water margins of flood inundation, both in wrack-lines and in vegetation. It appears that the receding limb of the hydrograph carries less debris, although plastic mobilized on the floodplain may return to the river channel. Since floods potentially cause a large proportion of plastic mobilization, transport and deposition in rivers, including floods in plastic pollution prevention, monitoring and clean-up, is important. Especially debris piles and plastic deposited in riparian vegetation should be included, as we found especially high plastic concentrations in those riverbank and floodplain features.
Open peer review
To view the open peer review materials for this article, please visit http://doi.org/10.1017/plc.2026.10054.
Supplementary material
The supplementary material for this article can be found at http://doi.org/10.1017/plc.2026.10054.
Data availability statement
The data underlying this publication is made publicly available through data.4tu.nl Schreyers et al. (Reference Schreyers, Hauk, Wallerstein, Teuling, Uijlenhoet, van der Ploeg and van Emmerik2025a) and Hauk et al. (Reference Hauk, van Emmerik, van der Ploeg, de Winter, Boonstra, Löhr and Teuling2023a) under the DOIs https://doi.org/10.4121/19415a1b-1f4e-4c5d-acc3-69545804698c.v1 and https://doi.org/10.4121/21360531.v1.
Acknowledgments
We thank Winnie de Winter from the North Sea Foundation for access to their data, and all the volunteers from the Schone Rivieren Project for their macrolitter monitoring efforts. For more information about the project see www.schonerivieren.org. We thank Yvette Mellink, Rose Boahemaa Pinto, Sjoukje de Lange, Paolo Tasseron, Derk van Grootheest, Khoa van Li Thi, Ámbar Pérez-García, Silke Tas, Miranda Stibora, Awad Negmeldin, Finn Begemann, Titus Kruijssen, and Heleen Aalderink for their help with the fieldwork. We also thank the two reviewers for their very kind and constructive reviews which improved the quality of this manuscript.
Author contribution
Conceptualization: All authors. Methodology: RH, LS, MvdP, AT and TvE. Investigation: RH and LS. Formal analysis: RH. Supervision: MvdP, AT and TvE. Writing–original draft: RH. Writing–reviewing and editing: All authors.
Financial support
Open access funding provided by Wageningen University & Research.
Funding statement
None.
Competing interests
The authors declare none.



 Open access


Comments
No accompanying comment.