




No CrossRef data available.
Elections and Uncertain Decisions in Politics: A Survey Experiment with US Municipal Officials
Published online by Cambridge University Press: 05 March 2018
Abstract
An abstract is not available for this content. As you have access to this content, full HTML content is provided on this page. A PDF of this content is also available in through the ‘Save PDF’ action button.
Information
- Type
- Note
- Information
- Copyright
- Copyright © Cambridge University Press 2018
Footnotes
*
Department of Political Science, University of California, San Diego (email: daniel.butler@gmail.com). I thank Adam Dynes and Justin Fox for their feedback. Data replication sets are available in Harvard Dataverse at: https://dx.doi.org/10.7910/DVN/09JRXK and online appendices at: https://doi.org/10.1017/S0007123417000813.
1 Mann Reference Mann1978.
2 Biglaiser and Mezzetti Reference Biglaiser and Mezzetti1997; Canes-Wrone, Herron, and Shotts Reference Canes-Wrone, Herron and Shotts2001.
3 Biglaiser and Mezzetti Reference Biglaiser and Mezzetti1997.
4 In these models, voters try to draw inferences about the incumbent policy maker’s competence based on their observations of the policy maker’s choices and the resulting outcomes of those choices. In some of these models, policy makers have private information about their underlying ability (Canes-Wrone, Herron, and Shotts Reference Canes-Wrone, Herron and Shotts2001; Smith Reference Smith1996), whereas in Dewan and Hortal-Vallve (Reference Dewan and Hortala-Vallve2017), the policy maker has no such private information.
5 See details in Butler and Preece (Reference Butler and Preece2016).
6 A total of 5,049 respondents saw the question, with 4 per cent of those choosing not to answer. This is a small level of attrition and so unlikely to bias the results. Further, the attrition is not correlated with treatment assignments.
7 Canes-Wrone, Herron, and Shotts Reference Canes-Wrone, Herron and Shotts2001.
8 As a randomization check, I tested whether any pre-determined variables predicted treatment assignment (See Table A6). I found that partisanship did, with more Republicans being assigned to the ‘expect to lose’ condition than to the ‘expect to win’ condition. As a robustness check, Table A7 tests whether controlling for partisanship affects the main results. It does not.
9 In practice, officials are more likely to be presented with trade-offs that involve specific dollar amounts and not as a percentage increase/decrease. While I considered presenting the trade-offs in dollar amounts, I chose not to because I did not believe I could pick budget numbers that most officials could relate to. The problem is that the officials come from a wide variety of cities and any number I chose would be too low for some and too high for others. I thus decided to present the trade-offs in terms of the percentage of the budget because this was more universal.
10 Hajnal and Trounstine Reference Hajnal and Trounstine2010.
11 See Appendix Table A2 for the regression results for these comparisons. Figure A3 (and Table A5) present the results when pooling the positive and negative expected value conditions together.
12 As a robustness check I also tested whether the effect of expecting to lose was different for mayors than it was for other councilors in the sample. Table A8 shows no evidence of that. Also, I tested whether the results would be different if I weighted the sample, using inverse probability weights based on the state and city’s population, to make it more representative of the officials AMOS tried to contact. The results, in Table A9, are unchanged.
13 This is because I thought that municipal officials might believe the outcome of the policy experiment would be more likely to influence the mayor’s probability of winning in a close election than in a blowout.
14 See Appendix Table A3 for the regression results for these comparisons.
15 See Appendix Table A4 for the regression results for these comparisons.
16 Drazen Reference Drazen2000; Smith Reference Smith1996.
17 Contrary to expectations, subjects in the study did not predict that expected winners would be less likely to adopt the risky policy. I may have found this null result because the stakes were too low. Examining scenarios where the negative budgetary impact was more significant (e.g., doubling of city’s budget deficit) might change the results and could be considered in future research.
18 Schattschneider Reference Schattschneider1960.
References
Biglaiser, Gary, and Mezzetti, Claudio. 1997. Politicians Decision Making with Re-Election Concerns. Journal of Public Economics 66 (3):425–447.CrossRefGoogle Scholar
Butler, Daniel. 2017. Replication Data for: Elections and Uncertain Decisions in Politics: A Survey Experiment with U.S. Municipal Officials, doi:10.7910/DVN/09JRXK, Harvard Dataverse, V1, UNF:6:8TIQBr5hy1Q7IrhBZtAznA==.CrossRefGoogle Scholar
Butler, Daniel M., and Preece, Jessica. 2016. Recruitment and Perceptions of Gender Bias in Party Leader Support. Political Research Quarterly 69 (4):842–851.CrossRefGoogle Scholar
Canes-Wrone, Brandice, Herron, Michael C., and Shotts, Kenneth W.. 2001. Leadership and Pandering: A Theory of Executive Policymaking. American Journal of Political Science 45 (3):532–550.CrossRefGoogle Scholar
Dewan, Torun, and Hortala-Vallve, Rafael. 2017. Electoral Competition, Control, and Learning. British Journal of Political Science 1–17. doi: 10.1017/S0007123416000764.Google Scholar
Drazen, Allan. 2000. The Political Business Cycle After 25 Years. In NBER Macroeconomics Annual 2000, edited by Ben S. Bernanke and Kenneth Rogoff, 75–138. Cambridge, MA: MIT Press.Google Scholar
Hajnal, Zoltan, and Trounstine, Jessica. 2010. Who or What Governs? The Effect of Economics, Politics, Institutions, and Needs on Local Spending. American Politics Research 38 (6):1130–1163.CrossRefGoogle Scholar
Mann, Thomas E. 1978. Unsafe at Any Margin: Interpreting Congressional Election. Washington, DC: AEI Press.Google Scholar
Schattschneider, Elmer E. 1960. The Semi-Sovereign People: A Realist’s View of Democracy in America. New York: Holt, Rinehart and Winston.Google Scholar
Smith, Alastair. 1996. Diversionary Foreign Policy in Democratic Systems. International Studies Quarterly 40 (1):133–153.CrossRefGoogle Scholar
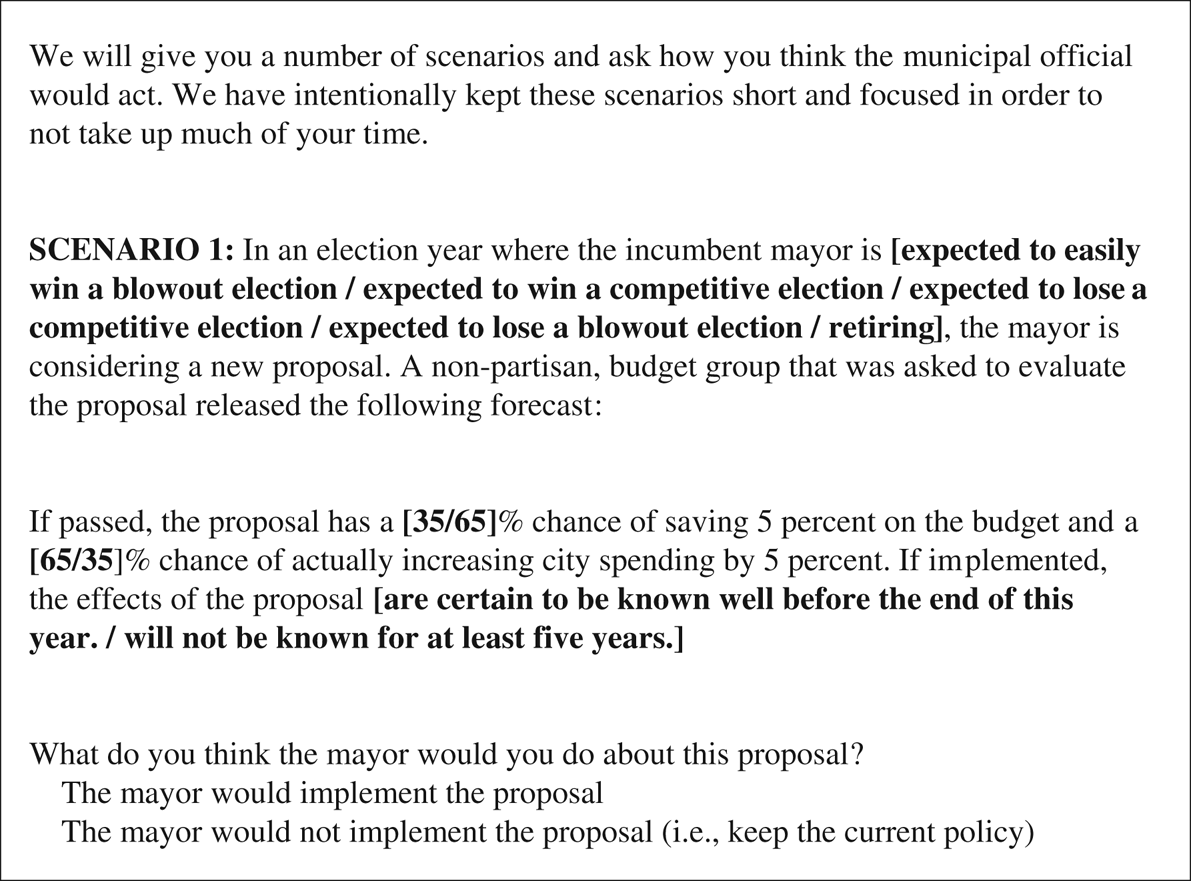
Fig. 1 Text of vignette on election prospects Note: the question was delivered with the errant ‘you’ included in the question. During the planning phase I went back and forth about whether to ask the question in terms of what the mayor would do or in terms of what they as a respondent would do. The errant ‘you’ was a holdover from a version of the question that phrased it in terms of asking what the official would do. This was an error. However, I still feel confident in the results because this question was asked the same way in all treatment conditions.
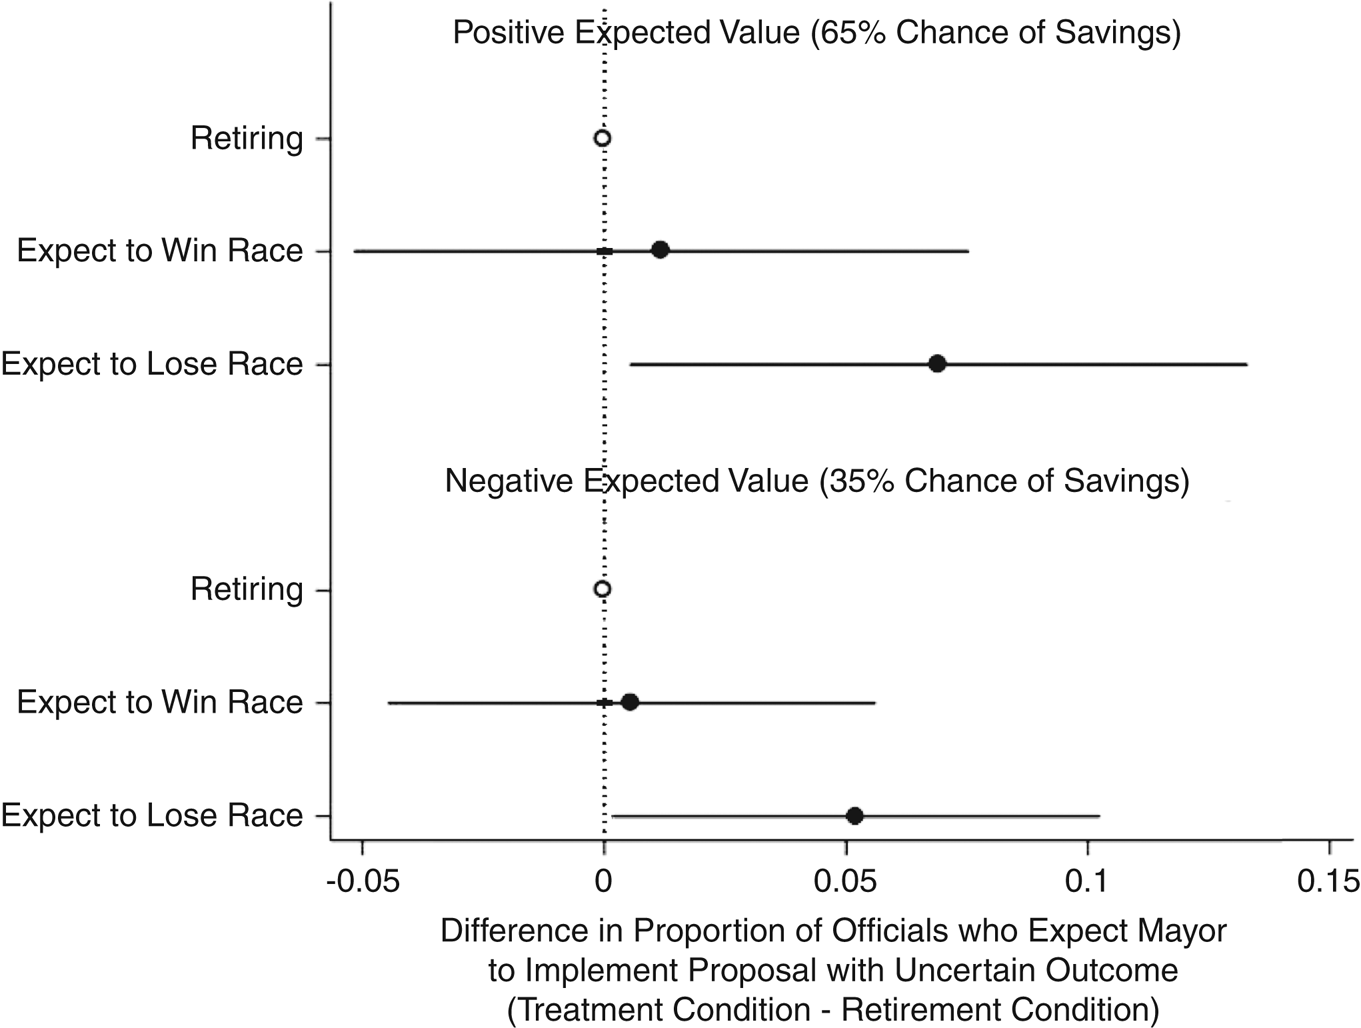
Fig. 2 Effect of election prospects for those learning outcome before election Note: the figure shows the effect of the treatment conditions relative to the retirement condition (and the associated 95 per cent confidence interval). The rate of adoption in the retiring condition was 57.5 per cent if the expected value was positive, and 15 per cent if the expected value was negative. Table A1 gives the number of observations per treatment condition.
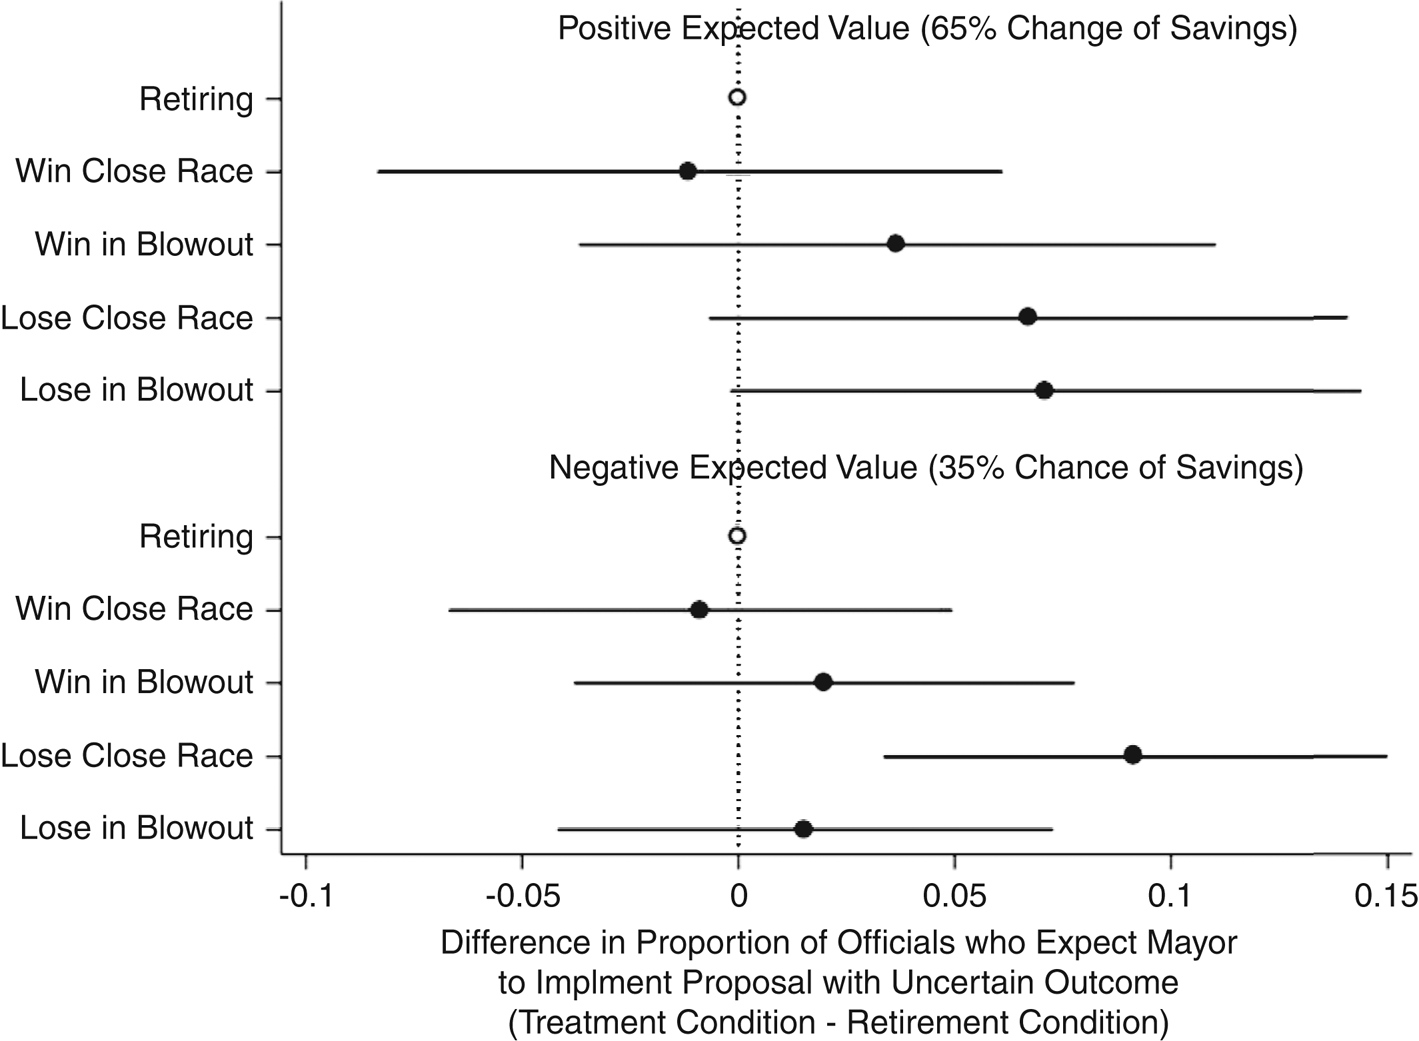
Fig. 3 Results by the expected closeness of the election Note: the figure shows the effect of the treatment conditions relative to the retirement condition (and the associated 95 per cent confidence interval). The rate of adoption in the retiring condition was 57.5 per cent if the expected value was positive, and 15 per cent if the expected value was negative. Table A1 gives the number of observations per treatment condition.
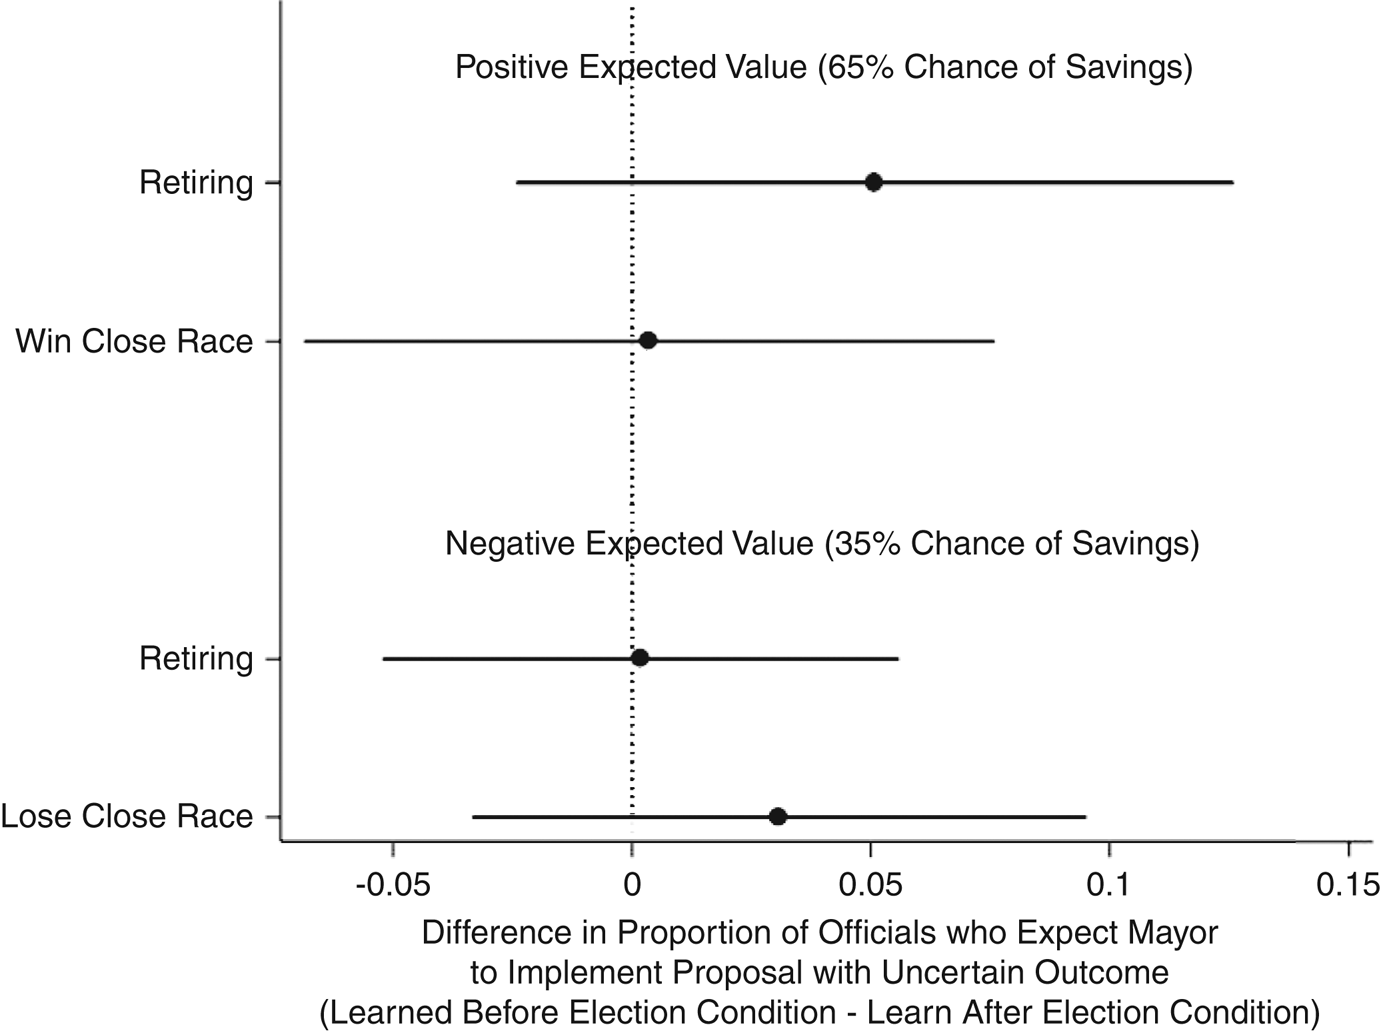
Fig. 4 The effect of the time horizon on learning the results Note: the figure shows the effect of the time horizon (i.e., learning about the outcome before the election versus learning about it after the election) for different scenarios. Table A1 gives the number of observations per treatment condition.

Butler supplementary material
Butler supplementary material

PDF
481.3 KB
 You have
Access
- 4
- Cited by
While some suggest that incumbents act as is if they are unsafe at any margin,Footnote 1 other scholars theorize that incumbents change their behavior depending on whether they are running for re-election and on whether they expect to win or lose.Footnote 2 I conduct a survey experiment of local elected officials and find that they believe officials condition their behavior based on their election prospects. This evidence shows that some of the intuitions from recent theories of policy making and elections are the same intuitions held by local elected officials.
As discussed in Biglaiser and Mezzetti’s formal model of policy making and elections, when confronted with a safe policy (for example, sticking with the known status quo) and a risky policy, an incumbent who is expected to lose has a greater electoral incentive to select the risky policy than one who is expected to win.Footnote 3 To see why, consider the case of an incumbent who is very likely to lose. If he or she experiments with the new policy and it succeeds, this may cause voters to view them more positively, and perhaps even reward them with re-election. If the policy fails, the incumbent will likely lose but will not be much worse off electorally, as they would likely have lost anyway. In contrast, an incumbent strongly favored to win may play it safe and shy away from experimenting with the risky policy. This is because the electoral upside of choosing the risky policy is minimal, whereas the electoral downside, in the event the policy fails, could be large, and in the worst-case scenario result in their defeat. Related intuitions also appear in several other formal models of policy making and elections.Footnote 4
A SURVEY EXPERIMENT WITH ELECTED, MUNICIPAL OFFICIALS
I test whether electoral prospects shape politicians’ perceptions about likely behavior by conducting a survey experiment with US mayors and city councilors. The experiment was included on a survey that was carried out in the summer of 2014.Footnote 5 A description of the survey and the recruitment process is presented in the Appendix. For the analysis, I use the approximately 4,850 respondents who answered the question.Footnote 6
The survey experiment was a vignette about an incumbent mayor who must decide whether to undertake a policy with an uncertain budgetary impact. The text of the vignette is shown in Figure 1. For the experiment, I varied the bolded items in brackets.
Text of vignette on election prospects Note: the question was delivered with the errant ‘you’ included in the question. During the planning phase I went back and forth about whether to ask the question in terms of what the mayor would do or in terms of what they as a respondent would do. The errant ‘you’ was a holdover from a version of the question that phrased it in terms of asking what the official would do. This was an error. However, I still feel confident in the results because this question was asked the same way in all treatment conditions.
Several features of the vignette were randomly varied. First, I randomly varied whether the mayor was retiring or running for re-election. I use the condition where the mayor is retiring (and therefore not standing for election) as a baseline for comparison because it proxies for how politicians behave in the absence of electoral considerations.Footnote 7 For those exposed to the condition in which the mayor is running for re-election, I randomly varied whether the mayor was expected to win or lose (as well as the expected margin of victory). This variation allows us to understand how electoral context influences expectations about policy choices.Footnote 8
Secondly, I randomly varied the expected value of the policy proposal’s budgetary impact. Half of the respondents were told that the expected value of the proposal was negative (‘3.5 per cent chance of saving 5 per cent on the budget and a 6.5 per cent chance of actually increasing city spending by 5 per cent’) and the other half were told that the expected value of the proposal was positive (‘6.5 per cent chance of saving 5 per cent on the budget and a 3.5 per cent chance of actually increasing city spending by 5 per cent’).Footnote 9 I focus on issues that have budgetary impacts because these are typically the most important issues for local government.Footnote 10
Thirdly, I randomly varied the speed with which the policy’s budgetary impact would be known. Most officials were told that, ‘If implemented, the effects of the proposal are certain to be known well before the end of this year.’ A small subset of officials was randomly assigned to a vignette that said the results of the policy would not be known ‘for at least five years’. I thought this delay might dampen the effect of electoral context on predictions about the mayor’s behavior, because the policy’s outcome (success or failure) would be unlikely to be known before the election, and thus unlikely to affect the election outcome. Because of statistical power considerations, I only included the long-time horizon condition in cases where I thought it was likely to have an impact (close winners facing a policy with a positive expected value and close losers facing a policy with a negative expected value) and for the baseline retiring condition. Appendix Table A1 presents the number of respondents randomly assigned to each of the possible treatments.
RESULTS
I begin with the results for officials who were presented vignettes in which the policy results would be known by the end of the year. Figure 2 presents the differences and associated 95 per cent confidence intervals for the proportion of officials who expected the mayor to implement the uncertain policy in the expect to win and expect to lose conditions, relative to the retiring mayor.Footnote 11
Effect of election prospects for those learning outcome before election Note: the figure shows the effect of the treatment conditions relative to the retirement condition (and the associated 95 per cent confidence interval). The rate of adoption in the retiring condition was 57.5 per cent if the expected value was positive, and 15 per cent if the expected value was negative. Table A1 gives the number of observations per treatment condition.
As expected, officials thought the retiring mayor would be much more likely to implement the policy if the expected value was positive. When the expected value was positive, 57.5 per cent of the officials who read the vignette about a retiring mayor thought the mayor would implement the policy. By contrast, only 15 per cent of the officials thought the retiring mayor who faced a policy with a negative expected value would implement it. This result reassures us that officials were reading and considering the vignette. The city officials recognized that changing the probabilities affected the attractiveness of the policy choice and responded accordingly.
Most importantly, Figure 2 shows that respondents thought mayors who were expected to lose their race were significantly more likely to implement the uncertain proposal than retiring mayors. This was true whether the expected value of the uncertain policy was positive or negative. In both cases, the officials were 5–7 percentage points more likely to say that the mayor would choose the uncertain policy if they were expected to lose than if the mayor was retiring. This is consistent with the idea that electoral insecurity leads incumbents to undertake novel policy experiments.Footnote 12
However, there is no evidence that respondents thought that officials who were expected to win would play it safe (at least relative to a retiring incumbent). Regardless of the expected value of the policy, the fraction of officials who thought the mayor would undertake the risky project when he or she was expected to win was the same as when the mayor was retiring.
I now turn to the impact of the expected margin of victory on predictions about the mayor’s policy choice. When designing this study, I hypothesized that predictions about whether the mayor would undertake the policy experiment would depend on expectations about whether the election was likely to be close or to be a blowout. Specifically, I hypothesized that expected losers (winners) would be predicted to be more (less) likely to undertake the policy experiment when facing a close election than a blowout election.Footnote 13 The results, which are presented in Figure 3, provide mixed evidence.Footnote 14 The closeness of the race has no effect when the expected value of the policy option is positive. In fact, the only time there is a difference between a close race and a blowout is when the mayor is expected to lose the race and the expected budgetary impact of the policy proposal is negative. Under these conditions, the respondents reading about the close race were 7.5 percentage points more likely to predict the mayor would select the risky policy proposal relative to when the race was a blowout. However, this is the only case in which the closeness of the race matters.
Results by the expected closeness of the election Note: the figure shows the effect of the treatment conditions relative to the retirement condition (and the associated 95 per cent confidence interval). The rate of adoption in the retiring condition was 57.5 per cent if the expected value was positive, and 15 per cent if the expected value was negative. Table A1 gives the number of observations per treatment condition.
Finally, Figure 4 presents the results when varying the time horizon. The top portion of the figure presents the results when the policy had a positive expected value, while the bottom portion of the figure gives the results of varying the time horizon among those who were considering a policy with a negative expected value.Footnote 15 The time horizon did not affect whether winning mayors were expected to adopt the policy. As for mayors expected to lose, the results go in the predicted direction – the proportion of respondents predicting the mayor would undertake the risky proposal when its outcome is realized without delay is 3 percentage points greater than among those informed that the policy’s outcome would be delayed – but the difference is not statistically significant.
The effect of the time horizon on learning the results Note: the figure shows the effect of the time horizon (i.e., learning about the outcome before the election versus learning about it after the election) for different scenarios. Table A1 gives the number of observations per treatment condition.
When looking at the overall results in Figures 2–4, the only strong finding is that officials predict incumbents facing a loss will be more willing to try new policies with uncertain outcomes. Electoral vulnerability leads incumbents to be more willing to take risks in the policy domain.
CONCLUSION
From the literature on diversionary war to the literature on political business cycles,Footnote 16 there is an intuition that whether an incumbent politician undertakes a given policy depends in part on whether they are facing an easy or tough re-election contest. I empirically explore whether this is the case in the context of sticking with a safe policy vs. experimenting with a risky policy. I find evidence that municipal officials believe that expected election outcomes shape incumbent behavior. Most importantly, they believe that politicians who are expected to lose are more likely to experiment with risky policies.Footnote 17 Further, politicians who expect to lose are more likely to experiment with risky policies whether the expected value of the policy option is positive or negative.
This finding also highlights the important role that the prospect of losing has for innovation on policy in democracies. Schattschneider argued that politicians and interest groups who are not in power are the ones that upset the status quo by campaigning on new ideas to create new issue alignments that might bring them into office.Footnote 18 The results suggest another avenue by which policy innovation may occur – namely, the fear of losing may lead at-risk incumbents to try novel, yet risky, policies. This is yet another important way in which competitive elections affect policies in democracies.