Introduction
In schizophrenia, the relationship between brain activity in the resting state and in the task-activated state is complex. Depending on areas and tasks, both hypo- and hyperactivities have been described. Functional magnetic resonance imaging (fMRI) data show that the regions usually more active at rest in control participants, such as the default mode network (DMN), including, for example, medial frontal, posterior cingulate, lateral parietal and hippocampal areas (Spreng et al. Reference Spreng, Mar and Kim2009), do not decrease their amount of activity as expected during the performance of a cognitive task (Pomarol-Clotet et al. Reference Pomarol-Clotet, Salvador, Sarro, Gomar, Vila, Martinez, Guerrero, Ortiz-Gil, Sans-Sansa, Capdevila, Cebamanos and McKenna2008). In addition, the regions that should increase their activity with the task do not activate properly (Pomarol-Clotet et al. Reference Pomarol-Clotet, Salvador, Sarro, Gomar, Vila, Martinez, Guerrero, Ortiz-Gil, Sans-Sansa, Capdevila, Cebamanos and McKenna2008; Whitfield-Gabrieli et al. Reference Whitfield-Gabrieli, Thermenos, Milanovic, Tsuang, Faraone, McCarley, Shenton, Green, Nieto-Castanon, LaViolette, Wojcik, Gabrieli and Seidman2009; Ongur et al. Reference Ongur, Lundy, Greenhouse, Shinn, Menon, Cohen and Renshaw2010). These data link evidence supporting decreased regional cortical activation during tasks known to engage the corresponding areas (Hill et al. Reference Hill, Mann, Laws, Stephenson, Nimmo-Smith and McKenna2004). Moreover, they are coherent with previous views of abnormal cortical functions subserving cognitive functions in schizophrenia, indicating a complex dysfunctional neural circuitry instead of an alteration at a single location (Manoach, Reference Manoach2003).
Although that disorganized pattern has usually been studied with fMRI, electroencephalography (EEG) may offer a complementary window to that end, given its high temporal resolution, non-invasive nature and relatively simple instrumental requirements. However, most of the previous EEG studies in schizophrenia do not discriminate between task-related and ‘background’ activity (Light et al. Reference Light, Hsu, Hsieh, Meyer-Gomes, Sprock, Swerdlow and Braff2006; Ford et al. Reference Ford, Roach, Faustman and Mathalon2008; Rutter et al. Reference Rutter, Carver, Holroyd, Nadar, Mitchell-Francis, Apud, Weinberger and Coppola2009; Spencer et al. Reference Spencer, Niznikiewicz, Nestor, Shenton and McCarley2009; Venables et al. Reference Venables, Bernat and Sponheim2009), thus not allowing an assessment of the balance between the corresponding patterns.
The study of gamma oscillations may be of particular interest in this context. The above-described disorganization found with fMRI in schizophrenia may be better reflected in the faster frequencies of the EEG, just as the association between gamma band oscillations and cerebral blood flow modulation seems stronger than the corresponding association of the latter with oscillations in other bands (Niessing et al. Reference Niessing, Ebisch, Schmidt, Niessing, Singer and Galuske2005). Scheeringa et al. (Reference Scheeringa, Fries, Petersson, Oostenveld, Grothe, Norris, Hagoort and Bastiaansen2011) recently presented direct evidence demonstrating that the coupling between fMRI signals and high-gamma band oscillations in animals also holds in humans performing a cognitive task.
In addition, the involvement of gamma band alterations in brain activity disorganization in schizophrenia makes sense from the point of view of the functions related to this band and the kind of symptoms that define this syndrome. These oscillations are key in coordinating neural circuits underlying higher cerebral functions, probably in relation to their capacity to subtend transient functional assembly formation, and therefore in cognitive functions (Singer, Reference Singer1993; Tallon-Baudry et al. Reference Tallon-Baudry, Bertrand, Peronnet and Pernier1998; Rutishauser et al. Reference Rutishauser, Ross, Mamelak and Schuman2010). There is evidence to uphold a role for the synchronization of gamma oscillatory responses in general cognitive functions (Uhlhaas et al. Reference Uhlhaas, Pipa, Lima, Melloni, Neuenschwander, Nikolic and Singer2009), including multisensory integration (Lakatos et al. Reference Lakatos, Chen, O'Connell, Mills and Schroeder2007), selective attention (Doesburg et al. Reference Doesburg, Roggeveen, Kitajo and Ward2008) and working memory (Jensen et al. Reference Jensen, Kaiser and Lachaux2007).
Indeed, alterations in gamma oscillatory responses have been reported in schizophrenia (Niessing et al. Reference Niessing, Ebisch, Schmidt, Niessing, Singer and Galuske2005; Barr et al. Reference Barr, Farzan, Tran, Chen, Fitzgerald and Daskalakis2010; Gandal et al. Reference Gandal, Edgar, Klook and Siegel2011). Reductions in gamma oscillation-evoked activity and/or phase synchronization in scalp-recorded EEG have been found in patients with this illness (Light et al. Reference Light, Hsu, Hsieh, Meyer-Gomes, Sprock, Swerdlow and Braff2006; Ford et al. Reference Ford, Roach, Faustman and Mathalon2008; Spencer et al. Reference Spencer, Niznikiewicz, Nestor, Shenton and McCarley2009). Moreover, the gamma signal-to-noise ratio (SNR) is reported to be reduced during cortical information processing in schizophrenia (Gandal et al. Reference Gandal, Edgar, Klook and Siegel2011).
In this context the study of ‘noise power’ is relevant. This term refers to the amount of scalp-recorded power not temporally locked to stimuli, quantified as the power difference in each band between the mean of single trials (i.e. trials total signal) and the magnitude of the averaged signals of all trials (Möcks et al. Reference Möcks, Kohler, Gasser and Pham1988; Winterer et al. Reference Winterer, Ziller, Dorn, Frick, Mulert, Wuebben, Herrmann and Coppola2000). In other words, noise power is the electrical power difference in each EEG band (delta, theta, alpha, beta and/or gamma) resulting from subtracting the power of the averaged signal, which is related to the task being performed, from the corresponding power in the total signal (which is composed of background EEG activity, unrelated to task processing, and the task-related signal). In this way, ‘noise power’, which can be determined with high reliability (Winterer et al. Reference Winterer, Ziller, Dorn, Frick, Mulert, Dahhan, Herrmann and Coppola1999), is equivalent to spontaneous background activity and jittering of the event-related signal, considering signals with different latencies across epochs would not survive averaging (Winterer et al. Reference Winterer, Coppola, Goldberg, Egan, Jones, Sanchez and Weinberger2004). Noise power assessment may therefore distinguish between task-related oscillations and oscillations underlying functions other than those related to the task being performed, that is functions likely to be active in the resting state that persist during the performance of a given task. Therefore, more EEG power would be expected in schizophrenia in the resting state, according to the referred fMRI data, with decreased power of the signals evoked by the task. In other words, higher noise power may be expected in schizophrenia, at least in the faster frequencies of the EEG, as sustained by previous findings (Winterer et al. Reference Winterer, Coppola, Goldberg, Egan, Jones, Sanchez and Weinberger2004).
In a previous study we reported elevated gamma noise power over Fz, P3 and P4 in drug-free patients with schizophrenia, predominantly first-episode patients (Suazo et al. Reference Suazo, Diez, Martin, Ballesteros, Casado, Martin-Loeches and Molina2012). In the current study we have included a broader sample and also patients' first-degree relatives, hypothesizing higher noise power in the gamma band in schizophrenia independently of patients' stage of illness (i.e. in both first-episode and chronic patients). We also expected higher noise power in first-degree relatives in comparison to healthy participants, and an association with symptoms and/or cognitive deficits between patients and their relatives. Moreover, we explored the spatial distribution of the resulting noise power by means of a factor analytical technique because it may yield valuable information concerning functional connectivity described with other techniques (i.e. the DMN described with fMRI). Given the relationship between gamma band and neural populations' coordination, cognitive correlates assessment of background oscillatory activity in the gamma band may help to understand the biological underpinnings of cognitive dysfunction in schizophrenia, as it may help to confirm that a higher background activity during task performance plays a role in this dysfunction.
The possibility of a gamma noise power excess in schizophrenia is also suggested by combining a probable inhibitory transmission decrease and the role that this transmission plays in gamma oscillations modulation (Gonzalez-Burgos & Lewis, Reference Gonzalez-Burgos and Lewis2012), which could in turn hamper cognitive performance.
To test this hypothesis, we assessed noise power in the gamma band during the target condition of an oddball task in patients, their relatives and healthy controls (HC).
Method
We recruited 59 patients with schizophrenia, 23 healthy first-degree relatives and 31 HC. Because of the small amount of segments left after filtering the EEG, we discarded the data of five patients and four HC prior to the analysis. The schizophrenia group included 25 stable cases, treated long term, and 29 untreated cases who had received minimal treatment before the EEG examination because of their acute psychotic state (minimally treated patients). All met the DSM-IV-TR criteria for paranoid (49 cases) or undifferentiated (five cases) schizophrenia.
The stable patients had been treated with atypical antipsychotics: risperidone (n = 16; 2–6 mg/day), olanzapine (n = 8; 5–20 mg/day), quetiapine (n = 4; 300–600 mg/day), aripiprazol (n = 2; 10–15 mg/day) and clozapine (n = 8; 100–350 mg/day). Thirteen patients received two different antipsychotics. Doses and drugs were unchanged during the 3 months preceding the EEG recordings.
Of the minimally treated patients, 17 had not received any previous treatment [first-episode (FE) patients] and 12 had stopped taking their medication before inclusion for a period longer than 1 month. Because of the acute psychotic state of these patients before inclusion, we administered a small amount of haloperidol (2–4 mg) the day before the EEG study, with a wash-out period of approximately 24 h before the EEG. The objective was to minimize the possible bias of only including patients able to cooperate with the EEG recording during an acute psychotic episode and without any previous treatment. To rule out the acute effects of haloperidol on noise power, five HC gave their informed consent to be studied with EEG before and 24 h after a 2 mg dose of haloperidol, approximately reproducing the treatment conditions of minimally treated patients.
Healthy first-degree relatives included parents or siblings with at least one family member diagnosed with schizophrenia. At the time of inclusion, the first-degree relatives had not received any psychiatric axis I diagnosis or psychiatric treatment.
We scored the clinical status of the patients by the Positive and Negative Syndrome Scale (PANSS; Kay et al. Reference Kay, Fiszbein and Opler1987). Marital status was stratified into single (single, divorced, separated) or living in a couple, employment status as employed (currently studying or working) or unemployed (looking for a job or retired), and educational level as completed academic courses.
We recruited HC through newspaper advertisements and remunerated their cooperation. They were previously assessed by a semi-structured psychiatric interview by one investigator (V.M.) to discard major psychiatric antecedents (personal or familial) and treatments.
The exclusion criteria included total IQ <70; a history of any neurological illness; cranial trauma with loss of consciousness; past or present substance abuse, except for nicotine or caffeine; the presence of any other psychiatric process or drug therapy; and treatment with drugs known to act on the central nervous system. We discarded toxic use in patients and HC with the information gathered in the interview and a urinalysis.
We obtained written informed consent from the patients, their families and HC after providing full written information. The research board endorsed the study according to the Code of Ethics of the World Medical Association (Declaration of Helsinki).
Cognitive assessment
We acquired cognitive assessment by the direct scores from the following subscales of the Spanish version of the Brief Assessment of Cognition in Schizophrenia (BACS; Segarra et al. Reference Segarra, Bernardo, Gutierrez, Justicia, Fernadez-Egea, Allas, Safont, Contreras, Gascon, Soler-Insa, Menchon, Junque and Keefe2011), administered by trained researchers (A.D. and V.S.): verbal memory (list learning), working memory (digit span), motor speed (token motor task), verbal fluency (categories), attention and processing speed (symbol coding) and executive function/problem solving (Tower of London). We used the Spanish version of the Wechsler Adult Intelligence Scale third edition (WAIS-III; Wechsler, Reference Wechsler1997) to assess IQ.
EEG methods
EEG recordings were performed while the participants underwent an oddball task. To elicit P3a and P3b components, an oddball three-stimulus paradigm was used with a 500-Hz tone target, a 1000-Hz tone distracter and a 2000-Hz tone standard stimulus (see online Supplementary Material). Accordingly, participants heard binaural tone bursts (duration 50 ms, rise and fall time 5 ms and intensity 90 dB) presented with random stimulus onset asynchrony of 1000 and 1500 ms. Random series of 600 tones consisted of target, distracter and standard tones with probabilities of 0.20, 0.20 and 0.60 respectively. We asked the participants to press a button whenever they detected the target tones, to close their eyes and avoid eye movements and muscle artifacts.
EEG recording
The EEG was recorded using BrainVision (Brain Products, Germany; (http://www.brainproducts.com/contact.php?tab=3) equipment from 17 tin electrodes mounted in an electrode cap (Electro Cap International, USA; http://www.electro-cap.com/about.htm). The electrode sites were Fp1, Fp2, F3, Fz, F4, F7, F8, C3, Cz, C4, P3, Pz, P4, T5, T6, O1 and O2 according to the revised 10/20 International System. Electrode impedance was always kept below 5 kΩ. The online register was referenced over the Cz electrode, the sampling rate was 250 Hz and the signal was recorded continuously.
Data analysis
Event-related potentials
We divided the continuous recording into 650-ms epochs starting 50 ms before stimulus onset. We used an offline 0.5–70-Hz filter. Artifacts were rejected automatically by eliminating epochs that exceeded a range of ±70 μ V in any of the channels. Based on a visual inspection we eliminated any epochs that still presented artifacts. Individual data were included in the analysis if 40 or more useful epochs were available for each stimulus condition. Overall, the mean rate of rejected segments was of 48.8%.
Data were re-referenced to electrode average activity (Bledowski et al. Reference Bledowski, Prvulovic, Hoechstetter, Scherg, Wibral, Goebel and Linden2004). We defined baseline as the available 50-ms prestimulus recording. P3a and P3b components were calculated respectively from distracter and target stimuli and defined as the mean amplitude in the 300–400-ms interval (see online Supplementary Material for details). For quantitative event-related EEG analysis, the recorded signals (–50 to 600 ms post-stimulus, target condition) were submitted to specific band filtering and spectrum analysis by a fast Fourier transform yielding spectral values. The absolute magnitude (averaged total power) in each frequency band was computed and expressed in μV2. The frequency band partition for gamma was 35–45 Hz.
Noise power
We calculated noise magnitude, or ‘noise power’, following the recommendations of Möcks et al. (Reference Möcks, Kohler, Gasser and Pham1988) and Winterer et al. (Reference Winterer, Coppola, Goldberg, Egan, Jones, Sanchez and Weinberger2004). This calculation was based on the SNR, a measure of the quality of the EEG signal applied to each band; it was calculated using BrainVision (2006) for the time window from −50 to +600 ms for the target stimuli (see online Supplementary Material for details).
For every individual participant, band and electrode, we calculated the averaged noise power from the already extracted averaged total power (the addition of the signal and noise power) and SNR (the average signal power quotient divided by the average noise power) using the following formula:
 $${\rm average}\;{\rm noise}\;{\rm power} \equals {{{\rm average}\;{\rm total}\;{\rm power}} \over {{\rm SNR} \plus 1}}.$$
In this way, quantification of the noise part of the activity related to the event is approximated and ‘noise’ is equivalent to activity that is not time locked to the stimuli.
Statistical analysis
Using χ2 tests, the Student t test or ANOVAs, where appropriate, we compared demographic, clinical and cognitive scores among the groups. Using separate ANOVAs we compared patients' P3a and P3b amplitudes with those of HC and first-degree relatives.
We introduced gamma noise power magnitudes in the 17 electrodes for all participants in a principal component analysis (PCA) with a varimax rotation to assess its factorial structure. The PCA examines the quantitative relationships between each pair of variables to describe which sets of variables covary; hence, the underlying structures could be described as factors.
Covariation of noise power values among a set of locations would include those electrodes in a certain factor and thus would support a relevant functional connectivity among the corresponding regions for that measure (i.e. task-unrelated bioelectrical activity). The principal components were selected using eigenvalues greater than one and we used a scree plot to corroborate the validity of the solution (i.e. if the ‘elbow’ of the diagram corresponded to the number of factors with eigenvalues greater than one). We saved the factor scores for each case and used them for the following analysis. We planned to verify that the same solution could be obtained from the healthy sample alone (HC and first-degree relatives), to confirm that a similar functional connectivity pattern was found in the different groups (i.e. its presence was not dependent on disease).
By using a MANOVA we assessed the statistical significance of differences in factor scores between patients, first-degree relatives and HC (group as the independent factor, and sex and age as covariates), with a Bonferroni correction. We repeated this test using only FE patients, first-degree relatives and HC to discard the effects of treatment and chronicity on arising differences.
We studied the association between noise power and symptoms, and noise power and cognitive values, using stepwise linear regression (using factor scores as previously defined as independent variables, and PANSS and cognitive scores as dependent variables), testing normal distribution and homoscedasticity of the residuals. These calculations were carried out separately in patients, first-degree relatives, and HC.
We assessed possible significant changes in noise power in the HC after a single dose of haloperidol with a Wilcoxon test for related samples.
Results
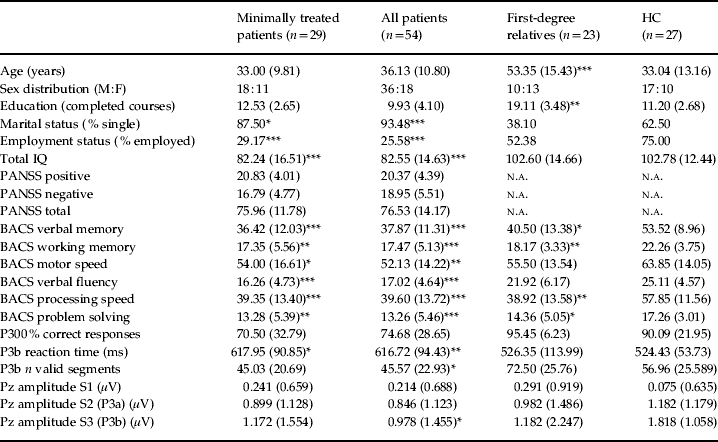
There were no significant differences in sex distribution (χ2 = 3.719, df = 2, p = 0.156) among the groups. Marital (χ2 = 23.840, df = 2, p < 0.001) and employment (χ2 = 15.706, df = 2, p < 0.001) status were significantly different among the groups because of lower rates of coupling and employment in the patients. Age (F = 19.467, df = 2, p < 0.001) and years of education (F = 19.460, df = 2, p < 0.001) were also significantly different among the groups because of the older mean age of the relatives and the higher education level of HC and relatives. IQ was significantly lower for both groups of patients in comparison to HC (F = 20.043, df = 2, p < 0.001; Table 1).
Demographic, clinical, neurocognitive and electrophysiological values in patients, first-degree relatives and healthy controls (HC). Minimally treated patients are shown separately for comparison. Differences with respect to HC are shown in the columns corresponding to each patient's subgroup and first-degree relatives. Differences between first-degree relatives and patients are described in the text

M, Male; F, female; PANSS, Positive and Negative Syndrome Scale; BACS, Brief Assessment of Cognition in Schizophrenia; S1, frequent tone; S2, distracter tone; S3, target tone; n.a., not applicable.
* p < 0.05, ** p < 0.01, *** p < 0.001 (Tamhane's post-hoc test).
Values are mean (s.d.) unless specified otherwise.
There were no significant differences in PANSS positive and total scores between the stable and minimally treated patients. PANSS negative scores were significantly higher in the stable patients (t = 3.643, df = 36, p = 0.001). All cognitive scores were significantly lower in both groups of patients in comparison to HC (Table 1). Relatives also showed lower cognitive scores in comparison to HC in verbal memory, working memory, processing speed and problem solving. Only verbal fluency was spared in first-degree relatives compared to HC (Table 1). However, there were no significant differences between patients and relatives groups for any of the other cognitive domains.
P300 comparisons
The mean amplitude for P3b was significantly lower in the patients in comparison to HC (t = –2.959, df = 79, p = 0.04) but not to relatives. Relatives and controls did not differ significantly in that measure (t = 1.44, df = 49, p = 0.15). There were no significant differences in P3a between any pair of groups. The percentage of correct responses (target detections) and the number of segments used for the P3b calculations were significantly higher for relatives compared to patients (t = –3.091, df = 38, p = 0.004 and t = –3.818, df = 66, p < 0.001 respectively). The reaction time for target detection was significantly lower for both HC (t = 3.744, df = 38, p = 0.001) and relatives (t = 2.740, df = 38, p = 0.009) in comparison to patients (Table 1). Online Supplementary Figs S1 and S2 depict mean across-subjects average waveforms and spatial distribution corresponding to distracter and target tones in patients and first-degree relatives in comparison to HC.
Factor structure of noise power and comparisons
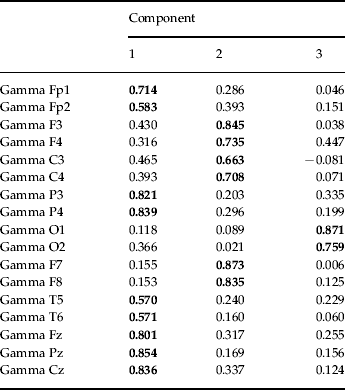
According to the eigenvalue greater than one criterion, a three-factor solution was found (Table 2) that explained 70.90% of the variance. The first factor (F1) was composed of gamma Fp1, Fp2, P3, P4, T5, T6, Fz, Pz and Cz noise power values and explained 52.46% of the variance (positive correlations). The second factor (F2) was composed of F3, F4, C3, C4, F7 and F8 noise power values and explained 11.38% of the variance (positive correlations). The third factor (F3) was composed of gamma O1 and O2 noise power values (positive correlations) and explained 7.07% of the variance. The corresponding correlation matrix is shown in online Supplementary Table S1. The scree plot confirms the three-factor solution. Approximately the same solution was obtained using data from HC and first-degree relatives (online Supplementary Table S2). The online Supplementary Table S3 displays gamma noise power values in the 17 electrodes.
Rotated components matrix for gamma noise power measures according to the eigenvalue greater than one criterion for all participants
Variables included in components solution appear in bold.
The MANOVA revealed a significant global effect of group (Wilks' lambda = 0.773, F = 3.595, p < 0.001) but not of covariates (age and sex). The between-subject effects test showed a highly significant effect of group on the factor loadings for F1 (type III sum of squares = 19.307, df = 2, F = 11.564, p < 0.001), with no significant effects on the other factors. Pairwise comparisons showed significantly higher factor loadings for F1 in patients compared to HC [between means difference = 0.880, 95% confidence interval (CI) 0.352–1.407, p < 0.001] and to first-degree relatives (between means difference = 0.900, 95% CI 0.263–1.537, p = 0.003). Factor loadings for F1 did not differ significantly between relatives and HC (between means difference = 0.031, 95% CI −0.757 to 0.695, p = 1.00). Table 3 shows the mean factor scores for all groups.
Mean gamma noise power factor scores in patients, healthy controls (HC) and first-degree relatives. Minimally treated patients are shown separately for comparison

DMN, Default mode network.
* p < 0.001 in all patients with respect to HC (pairwise comparisons from a multivariate general linear model, sex and age as covariates; see text for details).
Repeating the MANOVA with only FE patients, HC and first-degree relatives revealed a significant effect for loadings on F1 (type III sum of squares = 2.181, df = 2, F = 3.263, p = 0.045) between participants, and also significantly higher loadings in this factor in FE patients compared to HC (between means difference = 0.461, 95% CI 0.017–0.905, p = 0.040), but not in comparison to relatives (between means difference = 0.298, 95% CI −0.270 to 0.866, p > 0.1).
Regression with symptoms and cognitive performance
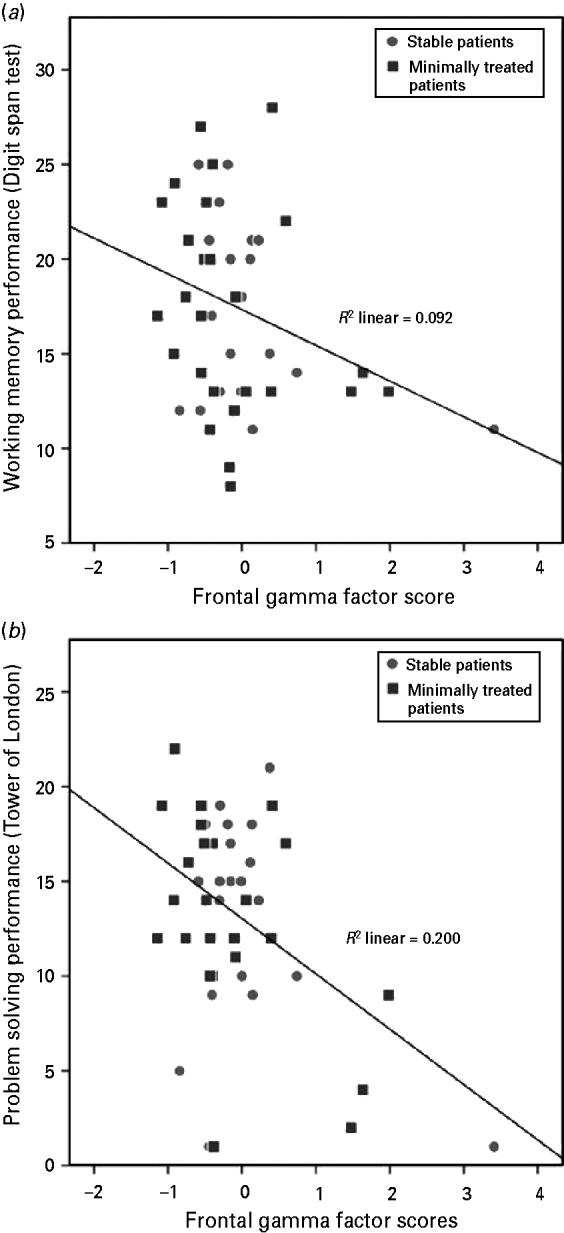
There was no association between positive, negative or total symptoms and factor scores. In the patients, F2 scores were significantly and inversely related to working memory (Digit Span: β = –3.304, R 2 = 0.092, F = 4.568, df = 1, p = 0.038) and problem-solving performance (Tower of London: β = –0.447, R 2 = 0.200, F = 11.011, df = 1, p = 0.002) (Fig. 1). Regression analysis did not reveal any association between cognitive performance and factor scores in the HC or in the first-degree relatives groups.
Scatterplots showing the association between (a) Brief Assessment of Cognition in Schizophrenia (BACS) working memory performance and frontal gamma noise factor scores and (b) executive function/problem-solving performance and frontal gamma noise factor scores in patients. Circles correspond to stable patients and squares to minimally treated patients.
We confirmed that the same association found in the patients was present in the minimally treated patients alone (n = 23) for working memory (Digit Span: β = –0.415, R 2 = 0.172, F = 4.372, df = 1, p = 0.049) and problem solving (Tower of London: β = –0.514, R 2 = 0.264, F = 8.256, df = 1, p = 0.009). When these associations were tested only in the FE (n = 17), the same relationship still held for problem solving (Tower of London: β = –0.578, R 2 = 0.334, F = 6.527, df = 1, p = 0.024). No other associations were detected between factor scores and cognition in patients.
Changes with haloperidol in HC
Gamma noise power lessened significantly with haloperidol over T5 (z = –2.02, p = 0.04). We did not find any significant changes with haloperidol in gamma noise power on P3 or Fz electrodes (see online Supplementary Table S4). In all cases, post-haloperidol gamma noise power values were lower than the corresponding basal values. There was no significant effect of haloperidol on P300 amplitude.
Discussion
According to previous literature we termed as noise power the gamma band activity unrelated to the oddball task that participants were performing. This type of activity is likely to reflect other processes carried out by the brain in addition to task processing, and its amount did not have any deleterious influence upon cognition in the HC and first-degree relatives. However, it was inversely associated with cognitive performance in the patients, which suggests that the factors underlying the higher background (‘noise’) in that group's gamma band may hamper their cognitive performance proportionally. This could be an effect of their psychotic state, although it seems unlikely because noise power was unrelated to symptoms. A putative factor that may elevate noise power and hamper cognition is inhibitory (i.e. gamma-aminobutyric acid, GABA) transmission alterations, for which there is support in schizophrenia (Lewis & Sweet, Reference Lewis and Sweet2009), as this type of transmission is a key factor in the genesis of gamma oscillations and neural assembly selection for task performance (Buzsáki, Reference Buzsáki2006a,Reference Buzsákib). Hence, GABA neurotransmission is relevant in the generation (Tallon-Baudry et al. Reference Tallon-Baudry, Bertrand, Peronnet and Pernier1998) and modulation (Teale et al. Reference Teale, Collins, Maharajh, Rojas, Kronberg and Reite2008) of high-frequency rhythms in the brain.
In our results, the first gamma noise power factor (F1 factor) was very reminiscent of the spatial distribution of the DMN as it included medial and lateral–parietal electrodes (Raichle et al. Reference Raichle, MacLeod, Snyder, Powers, Gusnard and Shulman2001). Nevertheless, it cannot be assumed that the source of an activated electrode is localized under it.
Given the described higher association between gamma oscillations and cerebral brain flow (Niessing et al. Reference Niessing, Ebisch, Schmidt, Niessing, Singer and Galuske2005; Scheeringa et al. Reference Scheeringa, Fries, Petersson, Oostenveld, Grothe, Norris, Hagoort and Bastiaansen2011), this factor may reflect the electrophysiological correlates of DMN, whose activity patterns have been described with positron emission tomography (PET) and fMRI (Raichle & Snyder, Reference Raichle and Snyder2007). Considering patients underwent an oddball task, their higher loadings in the gamma noise factor may indicate the lack of deactivation in this group, which would be expected if it indeed corresponds to the DMN. Another possible explanation for the higher factor scores in the patients is a lower level of engagement in the P300 task, but this seems unlikely given that patients, first-degree relatives and HC had similar behavioral performance in the task. Moreover, significant gamma band activity has been reported previously in schizophrenia regardless of P300 amplitude (Almeida et al. Reference Almeida, Vieira, Silveira, Ferreira-Santos, Chaves, Barbosa and Marques-Teixeira2011). That lack of deactivation is therefore compatible with data from a resting-state fMRI study that described more DMN activity in the schizophrenia patients than in the HC group (Zhou et al. Reference Zhou, Liang, Tian, Wang, Hao, Liu, Liu and Jiang2007). The lack of deactivation in the DMN regions predicted cognitive errors in HC during a flanker test (Eichele et al. Reference Eichele, Debener, Calhoun, Specht, Engel, Hugdahl, von Cramon and Ullsperger2008), which supports the possible involvement of higher noise power in the frontal gamma factor (F2 factor) loadings and the cognitive deficits displayed in our patients.
In our results, cognitive performance was unrelated to DMN gamma noise scores, although it was inversely related to frontal gamma noise factor (F2 factor) in the patient groups. Remarkably, the cognitive scores significantly related to this factor were working memory and problem solving, with a strong frontal basis and a known dysfunction in schizophrenia (Weisbrod et al. Reference Weisbrod, Hill, Niethammer and Sauer1999; Winterer et al. Reference Winterer, Coppola, Goldberg, Egan, Jones, Sanchez and Weinberger2004). Working memory has been proposed to involve oscillatory activity in the gamma band (Rutishauser et al. Reference Rutishauser, Ross, Mamelak and Schuman2010). Our results are compatible with findings of abnormal neural oscillations in schizophrenia participants in frontal gamma band during executive and working memory tasks (Uhlhaas & Singer, Reference Uhlhaas and Singer2010). These results highlight impairments in cognitive domains in this disease, possibly related to a disorganized spontaneous background activity of these EEG bands. In general, gamma rhythms may contribute to coherent percepts construction by the brain and to the strengthening and weakening of synaptic links and to integrate neural activity within and between regions in a range of cognitive functions (Phillips & Silverstein, Reference Phillips and Silverstein2003). It seems plausible that the lack of deactivation in the DMN gamma noise factor could contribute to interference between noise power in frontal regions and cognition, perhaps through a common underlying mechanism.
Our results are congruent with other electrophysiological assessments. For instance, a higher induced (non-phase locked) and a lower evoked (phase-locked) gamma response to auditory stimuli have been reported in schizophrenia (Singer, Reference Singer1993). This induced power is thought to reflect self-paced coordination of neural responses (Uhlhaas & Singer, Reference Uhlhaas and Singer2006), and a hypothetical underlying inhibitory deficit such as the one proposed in schizophrenia (Lewis et al. Reference Lewis, Hashimoto and Volk2005) may lead to both higher background and induced oscillatory activity. In addition, reduced stimulus-locked oscillatory activity has been reported in this disease. In this regard, an auditory oddball paradigm study described reduced evoked gamma band responses in a late latency range (220–350 ms) in unmedicated patients, particularly after target stimuli over right frontal scalp regions (Sohal et al. Reference Sohal, Zhang, Yizhar and Deisseroth2009). Taken in the context of these results, the elevated gamma noise power in our patients seems compatible with an uninhibited resting state that hampers the adequate coordination and synchronization of neural activity. Gamma oscillations may be mediated mainly by short-range cortico-cortical connections (Singer, Reference Singer1999) and the excess of intra-areal communication compatible with that elevated noise can restrict the necessary segregation of neural groups to focus on tasks or perceptions. This may explain why noise power was inversely associated with cognitive performance in our patients and is coherent with previous results displaying higher induced gamma-band activity in the prefrontal areas of HC but not in participants with schizophrenia (Spencer et al. Reference Spencer, Niznikiewicz, Nestor, Shenton and McCarley2009). These outcomes suggest a deficient regulation of functions subserving gamma oscillations in schizophrenia.
In our study EEG activity was not recorded during the performance of the cognitive tasks assessed in the participants. Very different patterns of brain network activity are expected with tasks other than P300 that engage cognitive function, such as those included in the BACS battery. Instead, the results of our study, along with those of previous studies (Winterer et al. Reference Winterer, Coppola, Goldberg, Egan, Jones, Sanchez and Weinberger2004), may indicate that a non-specific increase in gamma noise power, detectable even during a relatively simple task such as the oddball one, hampers performance on several cognitive domains.
We could not confirm our secondary hypothesis of higher gamma noise power in the healthy first-degree relatives of patients with schizophrenia in comparison to HC. This may suggest that elevated noise power is unrelated to the genetic factors shared by patients and their relatives; however, the relatives sample size is small. The present evidence does not support gamma noise power use as an endophenotype, although further studies may be needed to discard this possibility.
There are limitations to our study related to the spatial resolution of the EEG. In this respect fMRI could explore, as it has done in other studies (Whitfield-Gabrieli et al. Reference Whitfield-Gabrieli, Thermenos, Milanovic, Tsuang, Faraone, McCarley, Shenton, Green, Nieto-Castanon, LaViolette, Wojcik, Gabrieli and Seidman2009), a possible decreased deactivation of the DMN that underlies the higher noise activity in our patients. Additionally, we did not find any correlations with symptoms, despite the association DMN activity has with emotional processing and social cognition (Broyd et al. Reference Broyd, Demanuele, Debener, Helps, James and Sonuga-Barke2009). As stated in our results, the frontal factor (F2) was associated with cognitive variation but, contrary to previous studies (Whitfield-Gabrieli et al. Reference Whitfield-Gabrieli, Thermenos, Milanovic, Tsuang, Faraone, McCarley, Shenton, Green, Nieto-Castanon, LaViolette, Wojcik, Gabrieli and Seidman2009), there was no clinical variation. We did not compare resting and activated states but the noise power measurement allowed for discrimination between background and task-related activity. Our patients had received at least a short-term antipsychotic treatment (haloperidol) by the time of the EEG session but we ruled out its possible influence on noise power. Therefore, it is unlikely that we can explain our findings by alterations in this medication. Indeed, treatment administration allowed for a more realistic assessment of patients, and without it we would have excluded many cases only because of their clinical state.
Supplementary material
For supplementary material accompanying this paper visit http://dx.doi.org/10.1017/S0033291712002103.
Acknowledgments
This work was supported by Fondo de Investigaciones Sanitarias (Instituto de Salud Carlos III) (FIS PI080017; FIS PI1102203) and Gerencia Regional de Salud de Castilla y León (GRS 249/A/08; GRS 613/A/11) grants to V. Molina; a predoctoral research grant from the Consejería de Educación – Junta de Castilla y León and the European Social Fund to A. Díez; and a predoctoral scholarship from the University of Salamanca and Santander Bank to V. Suazo.
Declaration of Interest
None.