


INTRODUCTION
Strategic voting is fundamental to our understanding of the relationship between electoral systems and aggregate political outcomes. Most notably, Duverger (Reference Duverger1954) postulated that plurality systems tend to have two main parties partly because strategic voters abandon less popular candidates. This observation has since been formalized, generalized, and extended to other electoral systems (e.g., Cox Reference Cox1997). Meanwhile, a large empirical literature has studied election surveys and aggregate election results to assess the proportion of voters who vote strategically.Footnote 1 The answers have varied widely, partly because of disagreements about how strategic voting should be defined and measured. In general, however, the evidence indicates that strategic voting is sufficiently prevalent to help explain aggregate results not only in plurality elections in the United Kingdom (e.g., Fisher Reference Fisher2004), Canada (Black Reference Black1978), and the United States (Abramson et al. Reference Abramson, Aldrich, Paolino and Rohde1992; Hall and Snyder Jr. Reference Hall and Snyder2015) but also in elections held under proportional or mixed rules.Footnote 2
In this article, we address a different question from most previous research: rather than asking to what extent voters are strategic in general, we seek to understand inequalities in strategic voting behavior across types of voters. Does strategic voting behavior vary systematically with voter characteristics such as age, education, income, gender, or political leaning? Inequalities in strategic voting matter because voters who are less strategic will on average be less successful at electing their preferred candidates;Footnote 3 across many close elections, this difference in strategic behavior could affect how well different groups of voters are represented. (To take a prominent example, the results of the U.S. presidential elections of both 2000 and 2016 might have been reversed if left-leaning voters had voted more strategically or right-leaning voters had voted less strategically.) If there are inequalities in strategic voting, they could be addressed by improving the public’s understanding of the electoral system, by raising the quality and visibility of polling information (Hall and Snyder Jr. Reference Hall and Snyder2015), or by adopting an electoral system that less commonly rewards strategic behavior.
Despite the clear normative and policy value of understanding how strategic voting behavior varies across types of voters, there has been relatively little research on the topic. A few existing studies have compared strategic voting across groups of voters, but generally only as a secondary concern (e.g., Abramson et al. Reference Abramson, Aldrich, Paolino and Rohde1992; Black Reference Black1978; Merolla and Stephenson Reference Merolla and Stephenson2007; Niemi, Whitten, and Franklin Reference Niemi, Whitten and Franklin1992, though see Evans Reference Evans1994; Fisher Reference Fisher2001).Footnote 4 In fact, there remains little agreement on how to measure strategic voting in the first place, with cutting-edge work in the field continuing to focus on measurement issues (e.g., Fisher and Myatt Reference Fisher and Myatt2017; Herrmann, Munzert, and Selb Reference Herrmann, Munzert and Selb2015; Kawai and Watanabe Reference Kawai and Watanabe2013). This may explain why much less is known about inequalities in strategic voting than about inequalities in turnout (e.g., Gallego Reference Gallego2014; Kasara and Suryanarayan Reference Kasara and Suryanarayan2015; Verba, Schlozman, and Brady Reference Verba, Schlozman and Brady1995), even though failing to vote strategically can be just as much a waste of a ballot as failing to vote at all.
We introduce and implement a generalizable and theoretically grounded way to study inequalities in strategic voting that more effectively addresses key methodological challenges. The basis of our approach is a new scalar measure of the incentive to cast a strategic vote for a candidate other than one’s favorite. This measure, which we call τ, can be calculated for any voter given a proxy for the voter’s cardinal preferences over candidates or parties and a model of counterfactual election outcomes. τ plays two roles in our analysis. First, it identifies voters for whom an insincere vote would produce a better expected election outcome than a sincere vote. (Previous research lacked such a measure, relying instead on proxies that less precisely identify these voters.) Given survey data indicating how each voter voted, this allows us to estimate our basic measure of “strategic-ness,” called strategic responsiveness, which in the three-candidate case measures how much more likely one is to vote for one’s second choice when such a vote is beneficial than otherwise. (Unlike previous measures of strategic behavior, strategic responsiveness considers what voters do both when an insincere vote is called for and when it is not.) Second, τ acts as a control variable in our comparisons of strategic responsiveness across groups: it helps ensure that our conclusions reflect differences in voters’ behavior rather than in their preferences or circumstances. (More so than previous attempts to measure and control for tactical incentives, our measure of tactical incentives is grounded in a coherent theory of voting behavior, as explained in the next section.) With the methods we introduce in this article, researchers can calculate τ and apply our method for comparing strategic voting behavior using data from any electoral survey that reports respondent vote choices and preferences.Footnote 5
We apply this approach to data from the British Election Study for the 2005, 2010, and 2015 UK general elections. We find widespread strategic behavior overall, with around half of all voters casting the correct strategic vote when the incentive to vote insincerely is largest. We then look for differences in strategic responsiveness across five politically salient social characteristics: education, income, gender, age, and general left-right political orientation. In contrast to several previous studies (Black Reference Black1978; Fisher Reference Fisher2001; Merolla and Stephenson Reference Merolla and Stephenson2007; Niemi, Whitten, and Franklin Reference Niemi, Whitten and Franklin1992), we do not find substantial differences in strategic voting by education. We do, however, find that younger voters vote less strategically than older voters and that low-income voters on average vote less strategically than higher income voters, although the differences by income vary across election years. We also find some evidence that voters on the left vote slightly more strategically than those on the right, and that women vote slightly more strategically than men, although these differences are small and more sensitive to model specifications. Notably, the observed differences in strategic voting by age and income tend to exacerbate known inequalities in political participation,Footnote 6 although the scale of the voting differences we observe is substantially smaller than the corresponding turnout differences. We show that differences in strategic responsiveness by age and income are not easily explained by measurement error or differences in voters’ accuracy of beliefs; there is some evidence, however, that older voters vote more strategically because they approach voting more pragmatically than younger voters do.
We emphasize that our focus in this article is on whether voters vote strategically (and how this varies across voters), not whether voters think strategically. Others may ask to what extent voters engage in valid strategic reasoning, e.g., whether they have beliefs about the likelihood that their vote is pivotal in various ways, whether they vote in a way that is consistent with their beliefs about pivotality, or whether they refer to this process of strategic thinking when they explain their vote. By contrast, we ask to what extent voters vote in a way that advances their interests (given the objective strategic incentives they face) whatever the thought process that leads to their vote: after all, the effect of a given vote is the same whether the voter thought strategically based on good information about likely outcomes, thought strategically based on bad information about likely outcomes, used a simple heuristic, or was simply instructed how to vote by her friends. Our approach may reveal less about voters’ thought processes, but we believe it says more about possible differences in voters’ ability to obtain desired outcomes in elections.
In brief, this article makes four main contributions. First, it focuses attention on a mostly overlooked but normatively relevant question: who votes more strategically? Second, it offers a new measure of voting behavior (strategic responsiveness) that provides a better basis for comparison. Third, it defines and shows how to estimate a new, theoretically grounded measure of tactical incentives that is used both to measure and to compare strategic responsiveness across groups. Fourth, it applies these innovations to provide new evidence about inequalities in strategic voting in the British electorate. It remains to be seen whether the inequalities we find are specific to the setting we study, but the approach we introduce can be used to investigate the generalizability of our results.
A NEW APPROACH TO MEASURING AND COMPARING STRATEGIC VOTING
To determine whether some voters vote more strategically than others, we must first clarify what it means to vote strategically, decide how “strategic-ness” should be measured, and develop a feasible strategy for measuring and comparing strategic voting across voters. We address each of these issues in turn before summarizing our approach.
Notation and Terminology
A representative voter decides how to vote in a plurality election involving K candidates. Denote by p(j) = (p 1(j), p 2(j),…, p K(j)) the probability that each candidate is elected conditional on the voter voting for candidate j. (p(j) differs from p(k) to the extent that a single vote may decide the outcome. We discuss the interpretation and estimation of these probabilities below.) Denote by u j the Von Neumann–Morgenstern (VNM) utility the voter receives as a result of candidate j being elected, which might reflect the perceived effect of electing that candidate on policy outcomes (including through government formation) or the voter’s satisfaction with being represented by that candidate in policy debates. We will refer to u j as outcome-based utility because it depends on which candidate is elected but not on which candidate the voter votes for. Denote by u = (u 1, u 2,…, u K) the vector of these utilities, one for each candidate; label the candidates such that u 1 > u j ∀ j > 1, such that candidate 1 is the voter’s favorite. Note that p(j)·u is the voter’s expected outcome-based utility given a vote for candidate j.
We can now define key terms that we use throughout the article:
Definition. A sincere vote is a vote for candidate 1; an insincere vote is a vote for another candidate.
Definition. Among insincere votes, the best insincere vote is the one that maximizes expected outcome-based utility, i.e., it is a vote for a candidate j > 1 such that p(j)·u ≥ p(k)·u for all k > 1.
We focus on the best insincere vote because it helps us distinguish strategic voting from protest voting and other types of insincere behavior.
Definition. The tactical voting incentive, τ, is the difference in expected outcome-based utility between the best insincere vote and a sincere vote:
 $$\tau \,\equiv\, \mathop {\max }\limits_{j > 1} {\bf{p}}\left( j \right) \cdot {\bf{u}} - {\bf{p}}\left( 1 \right) \cdot {\bf{u}}.$$
Thus, τ measures the maximum expected benefit (or minimum expected cost) of an insincere vote.
Definition. Purely strategic voting means casting the best insincere vote when τ > 0 and otherwise casting a sincere vote.
Departures from Purely Strategic Voting
Voters may deviate from purely strategic voting for several reasons. They may be expressive, in the sense that they value voting according to their true preferences (Hamlin and Jennings Reference Hamlin and Jennings2011). They may care about future policy outcomes and believe that their vote affects those outcomes directly or by affecting future elections (Castanheira Reference Castanheira2003; Franklin, Niemi, and Whitten Reference Franklin, Niemi and Whitten1994; Piketty Reference Piketty2000). Or they may make a mistake because of poor information or incorrect reasoning.
To simply formalize these ideas, suppose a representative voter receives benefit b ≥ 0 from voting for candidate 1 (which captures the expressive benefits and perceived policy benefits of a sincere vote);Footnote 7 suppose also that ε measures the voter’s misperception of τ, so that if the true tactical incentive is τ the voter perceives a benefit of τ − ε. Then, the voter casts a best insincere vote when τ > b + ε and otherwise votes sincerely, and b + ε captures the degree to which she overvalues a sincere vote relative to the best insincere vote due to expressiveness, perceived effects of the vote on policy, and misperceptions.
We hypothesize that no voter is either purely strategic or completely unresponsive to strategic incentives: in terms of the simple model just introduced, no voter approaches every voting decision with b + ε = 0 or |b + ε| = ∞.Footnote 8 Voters may differ in how closely their behavior approximates the pure strategic ideal of b + ε = 0, however, and it is this variation that we seek to understand.
Strategic Responsiveness
As noted earlier, a purely strategic voter is one who casts a best insincere vote when τ > 0 and otherwise votes sincerely. Let y i be 1 if voter i casts a best insincere vote and 0 otherwise, and let τ i be the tactical incentive faced by voter i. We propose strategic responsiveness (SR) as a measure of how closely the voting behavior of a voter or collection of voters approximates pure strategic voting:
 $${\rm{SR}} \,\equiv\, E\left[ {{y_i}\,|\,{\tau _i} > 0} \right] - E\left[ {{y_i}\,|\,{\tau _i} \,\le\, 0} \right].$$
In words, SR is the difference in the proportion of best insincere votes when such a vote maximizes the voter’s expected outcome-based utility and when it does not.Footnote 9 If we view τ i > 0 as “treatment” and τ i ≤ 0 as “control,” then SR is the effect of treatment on the probability of casting the best insincere vote; our objective is to measure heterogeneity in this treatment effect across types of voters. SR is at a maximum of 1 for purely strategic voters, at a minimum of −1 for voters who vote insincerely when they should vote sincerely and vice versa, and zero for voters whose probability of a best insincere vote is unrelated to the tactical incentive τ i.
Strategic responsiveness innovates on previous measures of strategic behavior in three respects. First, it rewards insincere voting only among the subset of voters for whom an insincere vote is actually optimal (subject to measurement error in τ i), i.e., those with τ i > 0. By contrast, many previous approaches measure insincere voting among voters for whom an insincere vote may be optimal, for example, because their favorite candidate finishes third or lower, (e.g., Alvarez, Boehmke, and Nagler Reference Alvarez, Boehmke and Nagler2006; Blais and Nadeau Reference Blais and Nadeau1996; Fisher Reference Fisher2001; Merolla and Stephenson Reference Merolla and Stephenson2007). Second, by focusing on the proportion casting the best insincere vote rather than the proportion casting any insincere vote, our measure tends to limit the role of protest voting and other insincere behavior in settings with more than three candidates. (When there are only three candidates, a vote for one’s second choice is always the best insincere vote.) Third, it punishes voters who cast a best insincere vote when a sincere vote is actually optimal, i.e., when τ i < 0; these votes may be due to misperception or the desire to send a message, and therefore represent departures from purely strategic voting as we define it.Footnote 10
Comparing Strategic Responsiveness
To compare strategic responsiveness across two types of voters, we suggest the diff-in-diff-like regression
 $$E\left[ {{y_i}} \right] = {\beta _1}{W_i} + {\beta _2}I\left\{ {{\tau _i} > 0} \right\} + {\beta _3}{W_i} \,\times\, I\left\{ {{\tau _i} > 0} \right\} + g\left( {{\tau _i}} \right),$$
where y i indicates whether voter i casts a best insincere vote, W i indicates voter i’s type (e.g., male vs. female),Footnote 11 I{τ i > 0} indicates whether the voter benefits from an insincere vote, and g(τ i) is a flexible function of τ i. Omitting g(τ i), β 3 measures the raw difference in SR across levels of W i. Including g(τ i), β 3 measures the difference in SR controlling for τ, which addresses concerns that the intensity of treatment (i.e., the magnitude of τ) might differ across types of voters conditional on the sign of τ.
The simple conceptual model above justifies this control strategy: to isolate differences in b + ε across groups, we want to compare voting behavior conditional on τ, which is the only possible confounding variable in that model. By contrast, most previous literature controls additively for various proxy measures that might be correlated with τ.Footnote 12 A key advantage of our approach is that, because τ is a scalar, we can use less parametric functional forms and present results more transparently; also, unlike many of the standard measures of preference intensity and competitiveness, τ is easily extended to elections with any number of candidates.
Of course, for τ to make sense as a control variable, we must believe that the scale of the utility measure used to compute τ is roughly comparable across groups being compared. (Note, however, that scale comparability is not necessary for the sign of τ to correctly indicate whether the voter benefits from a tactical vote or not.) This scale comparability assumption is difficult if not impossible to test, although a similar assumption is made by all previous studies that use party or candidate ratings as control variables (e.g., Fisher Reference Fisher2001; Fisher and Myatt Reference Fisher and Myatt2017; Merolla and Stephenson Reference Merolla and Stephenson2007) and Fisher (Reference Fisher2001) shows that measures of party preference intensity constructed from such ratings (which we will use below when measuring τ) are a strong predictor of vote choice.Footnote 13 As it happens, the results of this article do not depend on whether we control for τ (and thus do not depend on scale comparability), but in general, we advocate controlling for τ as the best way to address potential differences in strategic contexts across groups of voters being compared.
Measuring Tactical Incentives
Measuring and comparing strategic responsiveness requires measuring τ, which in turn requires (for each voter) measures of (1) the voter’s VNM utility from electing each candidate and (2) the probability of each candidate being elected as a function of the voter’s vote.
For (1), we suggest using voters’ numerical ratings of candidates, parties, and/or party leaders such as are commonly included on voter surveys such as the Comparative Study of Election Systems (CSES).Footnote 14 Research in health economics has shown that the numerical ratings patients assign to hypothetical health states (e.g., mild back pain and loss of a limb) are imperfect but suitable proxies for VNM utility measures elicited using “standard gamble” methods (e.g., Dolan and Sutton Reference Dolan and Sutton1997; Drummond et al. Reference Drummond, Sculpher, Claxton, Stoddart and Torrance2015; Brazier et al. Reference Brazier, Ratcliffe, Saloman and Tsuchiya2016), which suggests that numerical ratings could also capture VNM utilities over candidates or parties. In many surveys, voters are asked to rate parties and party leaders, and in some, they are asked to rate candidates; in this article, we focus on party ratings and show similar results using leader ratings (Online Appendix C). A key question is whether giving a high rating to a party means the same thing as wanting to elect a candidate from that party. One reason it might not is that voters may consider how electing an MP from each party is likely to affect government formation or policymaking (e.g., Bargsted and Kedar Reference Bargsted and Kedar2009; Duch, May, and Armstrong Reference Duch, May and Armstrong2010), which could in turn create a difference between preferences over candidates/parties in the abstract and preferences about who gets elected in one's constituency; thus, a voter who most prefers the Greens in the abstract might prefer to see a Labour MP elected in her constituency, believing that an extra Labour MP diminishes the chance of a Conservative government (and raises the chance of a preferred Labour government) more than an extra Green MP.Footnote 15 To the extent that true VNM utilities do not map linearly onto the proxies being used (for whatever reason), there will be measurement error in τ and possibly bias in SR. Given our goal of comparing strategic responsiveness across types of voters, we arrive at fundamentally incorrect conclusions only if this measurement error affects different types of voters differently;Footnote 16 we assess differential measurement error below.
For (2), we suggest extracting election probabilities from a model of counterfactual elections that matches observed results on average but reflects the objective (un)predictability of elections as reflected in forecasting errors. Following Fisher and Myatt (Reference Fisher and Myatt2017) (see also Myatt and Fisher Reference Myatt and Fisher2002), we model the vote shares of each candidate in an election using a Dirichlet distribution with parameter vector s v ≡ (sv 1, sv 2,…, sv K), where v is the vector of expected vote shares and s is a precision parameter. Like Fisher and Myatt (Reference Fisher and Myatt2017), we set v equal to the vector of vote shares that is actually observed in each constituency.Footnote 17 We then use a maximum likelihood procedure to choose the value of the precision parameter s that makes constituency-level forecasts as unsurprising as possible, given that v is the observed result. We thus calibrate the precision of the model to match the uncertainty facing the most well-informed observers in advance of elections (arising from, e.g., sampling variation in polls, scientific error in modeling vote choice and turnout, and unexpected events that occur between the forecast and the election); we take this to be the best estimate of the true underlying variability of election outcomes.Footnote 18
Given this model of counterfactual election outcomes, we next extract the probabilities required to estimate τ. In Online Appendix A, we show that τ can be estimated as a function of pivot probabilities—the probability of each pair of candidates tying for the first place—and utilities only, ignoring events in which any candidate wins by more than one vote. Fisher and Myatt (Reference Fisher and Myatt2017) derived an analytical expression for these probabilities in three-candidate elections (with Dirichlet beliefs).Footnote 19 To accommodate more than three candidates, we first make an independence assumption: letting x 1, x 2,…, x K denote a vector of realized vote shares, we assume that (for any indexing of the candidates)
 $$\Pr \left( {{x_1} = {x_2} = y,{x_3} \,\lt \,y, \ldots ,{x_K} \,\lt\, y} \right) \approx \Pr \left( {{x_1} = {x_2} = y} \right)\prod\limits_{i = 3}^{K} \,{\Pr \left( {{x_i} \lt y|{x_1} = {x_2} = y} \right)} .$$
In words, we assume that the probability of candidates 1 and 2 tying for first at a vote share y is the same as the probability of candidates 1 and 2 each receiving vote share y times the (conditional) probability of candidate 3 receiving less than y times the (conditional) probability of candidate 4 receiving less than y, etc. Using the aggregation property of the Dirichlet distribution (Frigyik, Kapila, and Gupta Reference Frigyik, Kapila and Gupta2010), and letting Dir(x; s v) denote the Dirichlet density with parameters s v evaluated at x = (x 1, x 2,…, x K), the probability of a tie for first between candidates 1 and 2 (given n voters) is then approximately
 $${1 \over n}\int_{{1 \over K}}^{{1 \over 2}} {{\rm{Dir}}\left( {y,y,1 - 2y;s{v_1},s{v_2},s\left( {1 - {v_1} - {v_2}} \right)} \right)} \prod\limits_{i = 3}^{K} \,{\int_0^y {{\rm{Beta}}} } \left( {{z \over {1 - 2y}};s{v_i},s\sum\limits_{j = 3}^{K} {{v_j} - s{v_i}} } \right){\rm{d}}z\;{\rm{d}}y,$$
which can be computed by numerical integration. Online Appendix A explains this derivation further, shows that the resulting estimates match simulation-based estimates at much lower computational cost, and relates tie probabilities to election probabilities.
To be clear, we do not assume that the model of election results we use to compute τ reflects the beliefs of the typical voter, nor that voters are capable of reproducing our calculations to compute τ; rather, τ is meant to capture the voter’s objective strategic situation, which is closer to how it would be perceived by an expert forecaster who knows the voter’s preferences. This reflects our overall aim, which is to measure the extent to which different types of voters cast the best insincere vote when they objectively should and vote sincerely otherwise. Given this aim, discrepancies between voters’ perceptions and the objective reality (as we model it) are one reason why voters may depart from the strategic ideal (via ε in the model above). Other researchers may seek instead to measure the extent to which voters’ vote choices are consistent with voters’ own subjective beliefs about the strategic implications of their vote; this would require a different model of beliefs and a different interpretation of resulting differences in strategic responsiveness, but could otherwise closely reflect our method. Still other researchers may seek to predict voter behavior, in which case the best approach may be considerably different from our own: past vote choice and simple heuristics such as “vote for your favorite viable party” may be better predictors of voting behavior than τ.
Summary of Our Approach
Given a measure of a voter’s VNM utility from each possible election outcome and a measure of the probability of each election outcome as a function of the voter’s vote, one can estimate the maximum expected benefit of an insincere vote (relative to a sincere vote) for the voter. We call this τ. A purely strategic voter casts an insincere vote if τ is positive and a sincere vote otherwise. Voters may not be purely strategic for various reasons.
To measure how closely voters approximate purely strategic voting, we take the difference between the probability of the best insincere vote when τ > 0 and when τ ≤ 0. We call this measure strategic responsiveness (SR). To measure τ, we use observed results and election forecasts to build a counterfactual model of election results and combine these with the voter’s numerical ratings of parties, leaders, and/or candidates. To address the possibility that different groups of voters face different types of voting situations, we suggest using τ as a single, flexible, scalar control variable that arises from a theoretically coherent model of vote choice. The effectiveness of τ as a control variable relies on the assumption that different voters use the utility scale similarly, but others have made a similar assumption, and the alternative of ignoring preference intensity is unappealing.
TACTICAL INCENTIVES IN THE BRITISH ELECTORATE
We apply our framework to data from the internet panels of the British Election Study (BES) for the 2005, 2010, and 2015 general elections.Footnote 20 In this section, we describe how we estimate tactical incentives in the British case, including illustrative examples, and briefly characterize the distribution of tactical incentives in the data.
Voter Preferences
As proxies for utility scores, we use voters’ ratings of the parties competing in their constituency. Specifically, BES respondents are asked, “On a scale that runs from 0 to 10, where 0 means strongly dislike and 10 means strongly like, how do you feel about the [e.g., Labour] Party?”Footnote 21 The BES’s postelection wave asks voters to rate the major parties immediately after the election (with the large majority of ratings being given during the three days following the election); in 2005 and 2010, the BES postelection wave did not ask about smaller parties, so we obtain these ratings for all years from the preelection wave of the panel, which takes place around six weeks before the election.Footnote 22
In cases where a voter gives two or more parties the same top rating on the 0–10 scale, we identify the voter’s preferred candidate/party using questions in which the voter is asked whether they feel closer to any particular party. If the tie is between parties A and B but the voter indicates she feels closest to party C, we exclude the voter from analysis on the basis that her preferences are inconsistent. We also exclude voters who provide like–dislike scores for fewer than three parties and those who respond that they did not vote, do not know how they voted, or refuse to report how they voted.Footnote 23 This leaves a sample of 24,923 respondents, with the number per survey being 4,778 (2005 BES), 11,539 (2010 BES), and 8,606 (2015 BES).Footnote 24
Probability of Ties for First
As noted earlier, our model of counterfactual election outcomes is a Dirichlet distribution centered on the actual election outcome, with the variance parameter tuned to maximize the likelihood of forecasts of constituency vote shares.Footnote 25 Calibration on the 2005, 2010, and 2015 UK elections produced a level of precision corresponding to s = 85. At this level of precision, the standard deviation of support for a party with a mean support of 0.3 is 0.05; the standard deviation of support for a party with a mean support of 0.10 is 0.032. The results of our analysis are nearly indistinguishable if we instead center the distribution on the forecasted outcomes (as shown in Online Appendix C); this is because forecasts are rarely incorrect about which parties are competitive in a given constituency, even if they sometimes fail to identify the eventual winner. The results are also similar (as shown in Online Appendix C) if we assume higher levels of aggregate uncertainty by setting s to 20 (which roughly doubles the variance of the party vote shares) or to 12 (which is the level of uncertainty Fisher and Myatt (Reference Fisher and Myatt2017) ascribe to British voters in recent elections).
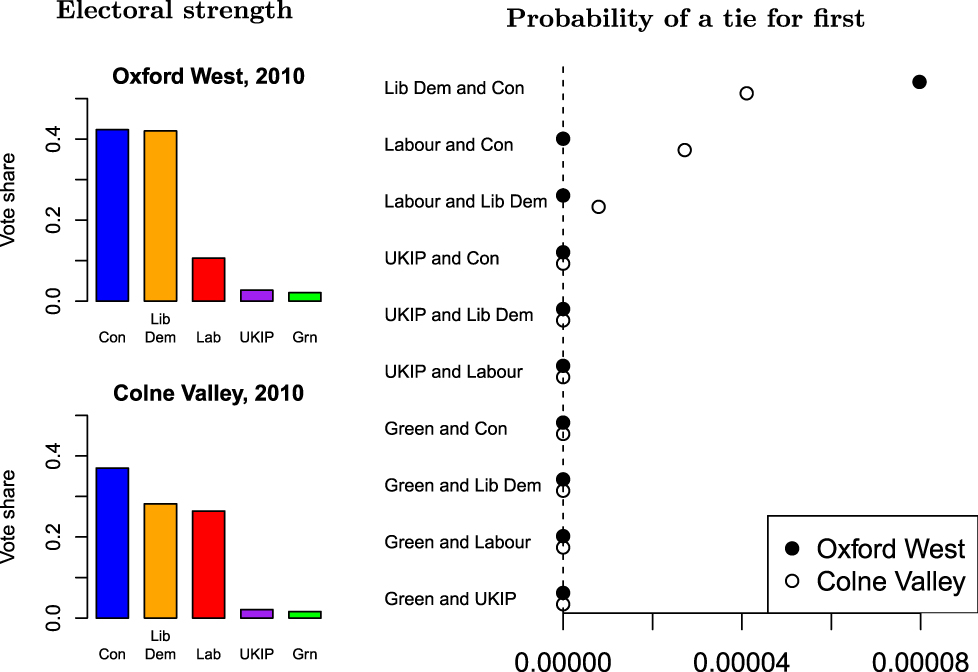
Figure 1 shows two election results (the Oxford West & Abingdon constituency and the Colne Valley constituency in 2010, left top and left bottom) along with the probability of each possible tie for first calculated by our method.Footnote 26 In Oxford, the Conservative candidate very narrowly defeated the Liberal Democrat, with Labour in a distant third and UKIP and the Greens further back. Our procedure estimates the probability of a tie for first between the two leading candidates as about 8 in 100,000, with all other tie probabilities indistinguishable from zero at this scale.Footnote 27
Electoral Strength and Pivot Probabilities: Two Examples
Note : We use a Dirichlet distribution to model counterfactual election outcomes based on observed results. The right panel shows the estimated probability of a tie for first between each pair of parties based on the 2010 election results (shown in the left panel) in Oxford West & Abingdon (solid circles) and Colne Valley (open circles).

The order of finish in Colne Valley was the same, but the Conservative candidate won with a larger margin and Labour finished narrowly behind the Liberal Democrat. The probability of a tie for first between the Conservative and the Liberal Democrat is about half as large in Colne Valley as in Oxford West, reflecting the larger margin; the probability of a tie for first involving the Labour candidate and the Conservative is only slightly lower, followed by the Labour–Liberal Democrat pair, with all of the others effectively zero.
Tactical Incentives: Examples and Distribution
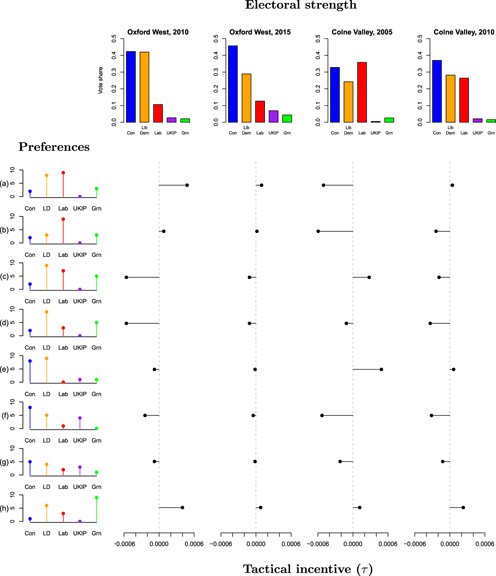
In Figure 2, we provide examples to illustrate how the tactical incentive τ relates to voter preferences and the electoral context. Along the left side of the figure, we depict eight sets of preferences, labeled (a)–(h), where in each diagram the height of the dot corresponds to the rating the voter assigns to the party on the 0–10 like–dislike scale. Along the top of the figure, we characterize the electoral strength of the five parties in four contests: the Oxford West & Abingdon constituency in 2010 and 2015, and the Colne Valley constituency in 2005 and 2010 (note that we plotted tie probabilities for the first and fourth of these contests in Figure 1 above). In the center of the figure, we plot the tactical incentive τ for each combination of preferences and electoral contests, for a total of thirty-two examples.
Tactical Incentives for Different Preferences in Different Elections
Note: Each column of dots shows the tactical incentive (τ) for a different hypothetical voter given electoral results indicated by the bar chart at the top of the column. The party preferences of these hypothetical voters are indicated by the diagrams along the left. For example, the third dot from the top in the left-most column shows that τ is roughly −0.0006 for a voter in Oxford West & Abingdon in 2010 who assigns ratings of 2, 9, 7, 0, and 5 to the Conservatives, Liberal Democrats, Labour UKIP, and Greens.

We can summarize the lessons of Figure 1 as follows. When only two candidates could realistically tie for first, as in the Oxford elections shown here, tactical incentives are relatively simple: the sign depends on whether the voter’s preferred candidate is a frontrunner, whereas the magnitude depends on both the strength of the voter’s preference between the frontrunners and how close the election is between them. When three candidates are competitive, as in the Colne Valley elections, some things remain straightforward: a voter who prefers the leader will have a negative tactical incentive, whereas a voter who prefers a hopeless candidate (and has preferences among the frontrunners) will have a positive tactical incentive; in both cases, the magnitude depends on preference intensity and the chance of a tie. But other subtleties arise: a voter whose most preferred candidate is running second or third may or may not benefit from an insincere vote, depending on the voter’s preferences and the candidates’ relative electoral strength. For example, consider the Colne Valley election in 2010, in which Labour finished third. A Labour supporter who rates the Liberal Democrats almost as highly as Labour (preference profile (a), first row) would benefit from an insincere vote for the Liberal Democrat, whereas a Labour supporter who rates the Liberal Democrats almost as low as the Conservatives (preference profile (b), second row) would do better with a sincere vote for Labour. A similar reversal takes place in the same election between preference profiles (d) and (e): a voter whose favorite candidate is running second is better off with a sincere vote when she strongly prefers her favorite to the frontrunner (preference profile (d), fourth row), but when she is nearly indifferent between the two frontrunners and strongly opposed to the third-place candidate, she is best off with an insincere vote (preference profile (e), fifth row).Footnote 28
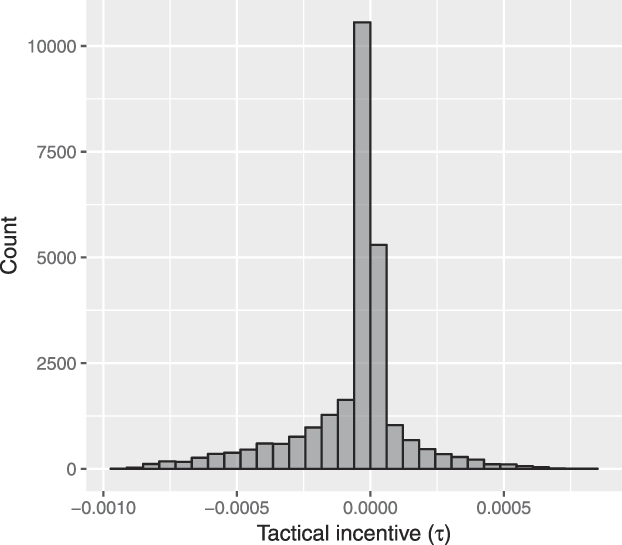
Figure 3 shows a histogram of tactical incentives in the BES sample. The distribution is clearly unimodal, with the mode being slightly below zero (indicating that a sincere vote is slightly more beneficial than a tactical vote). This makes sense if most voters’ favorite party is a local frontrunner and most elections are not decided by narrow margins. Approximately 1/3 of all respondents have a positive tactical incentive. The largest observed value of τ is around 0.0008; thus, no voter can expect their rating of the winner to increase by more than 0.0008 points on the 0-10 like-dislike scale from voting strategically.Footnote 29
Distribution of Tactical Incentives in the BES Sample
Note: The histogram shows the distribution of tactical incentives (τ) in our BES sample. About one-third of respondents have τ > 0, indicating that a tactical vote would maximize their (short-term) outcome-based utility.

MEASURING AND COMPARING STRATEGIC BEHAVIOR IN THE BRITISH ELECTORATE
Aggregate Strategic Responsiveness
Before using our measure of τ to investigate heterogeneity in strategic responsiveness across types of British voters, we first briefly examine voting behavior in the entire sample as a function of τ both to validate the measure and to establish links to previous studies of tactical voting in the British electorate.
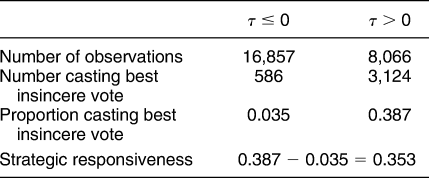
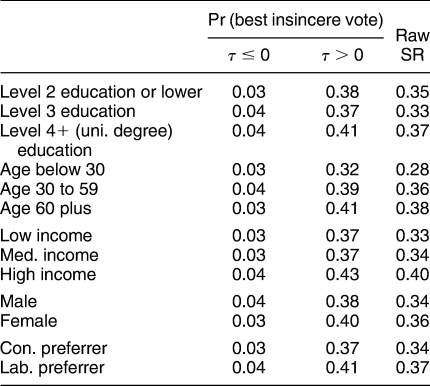
Table 1 describes the strategic voting behavior for the whole British electorate over the three elections we study. The probability of casting a best insincere vote is low when τ ≤ 0: of the nearly 17,000 BES respondents who faced τ ≤ 0, 3.5% (586) do so. By contrast, the probability of casting a best insincere vote jumps substantially when τ is positive: of the roughly 8,000 BES respondents who faced τ > 0, 38.7% (3,124) do so. Aggregate strategic responsiveness—the difference between these two rates—is thus around 0.35.
Raw Strategic Responsiveness in 2005, 2010, and 2015 BES Samples

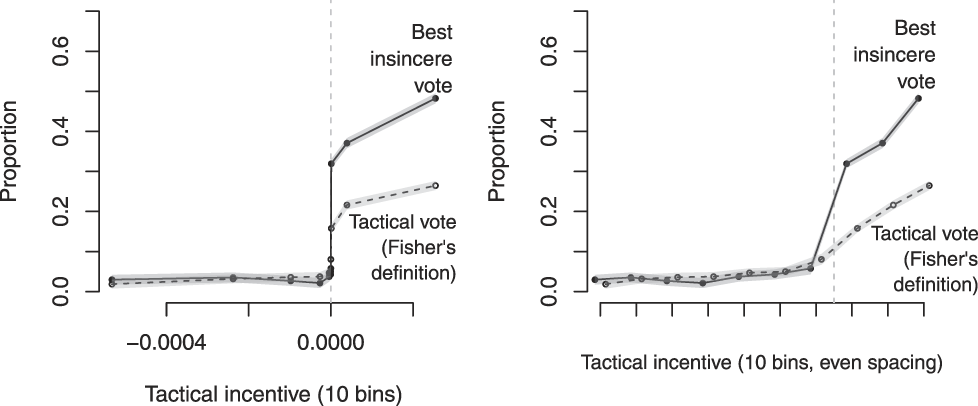
Figure 4 shows how aggregate voting behavior depends on the tactical incentive τ for the entire BES sample. We focus first on the left panel. The solid line shows the probability of a best insincere vote as a function of τ. To estimate this function, we first construct ten nearly equal-sized bins of τ: we start with bins that contain the deciles of τ and then move the smallest (in absolute value) bin boundary to zero, such that no bin has observations with positive and negative τ. The figure shows the proportion of best insincere votes in each of these bins with 95% confidence intervals shown in the shaded area.Footnote 30 In the left panel of Figure 4, the dots are located along the horizontal axis at the mean value of τ within the corresponding bin. Because the bins are so close together near τ = 0, in the right panel, we show the same function where the bin means are equally spaced along the horizontal axis. The rate of best insincere voting clearly increases monotonically as τ becomes more positive.
Voting Behavior as a Function of τ: Aggregate
Note: Each diagram shows two measures of strategic voting behavior as a function of τ. The solid line shows the proportion casting the best (i.e., the expected utility maximizing) insincere vote; the dashed line shows the tactical voting rate as measured by Fisher (Reference Fisher2004), which is essentially the proportion who say their vote was a tactical vote. The left and right diagrams show the same information on a different horizontal scale, as explained in the text.

The voting patterns in Table 1 and Figure 4 are broadly consistent with Fisher and Myatt (Reference Fisher and Myatt2017) and Kiewiet (Reference Kiewiet2013), who each conclude (on the basis of disparate approaches) that roughly one-third of British voters strategically desert their preferred party when it is not locally viable. Note, however, that around half of voters in the highest decile of τ are willing to abandon a preferred candidate. The monotonic relationship between τ and the rate of insincere voting (given τ > 0) suggests that any attempt to classify voters as strategic or sincere inevitably conflates voters’ strategic orientation with the type of decisions they typically face.Footnote 31
To further link our analysis to previous literature, the dashed line in Figure 4 shows the proportion of tactical votes according to Fisher (Reference Fisher2004)’s definition, which essentially requires that the voter claimed that the vote was tactical and did not report preferences that contradict that claim. Measured in this way, the overall proportion is substantially lower, but the function has a similar monotonic shape.Footnote 32 Thus, not only voters’ reported votes but also their reported explanations for their votes are responsive to τ, which offers validation of τ as a measure of tactical voting incentives. Further validation appears in Table B.2 in the Online Appendix, which shows that voting behavior is more responsive to τ among voters who have a greater sense of vote efficacy, who correctly anticipate the local winner, and (especially) who explicitly endorse a more strategic approach to voting.
Strategic Responsiveness and Social Characteristics
We now assess whether voters with different social characteristics differ in their strategic responsiveness. We focus on heterogeneity by education, age, income, gender and ideological leaning. We choose these variables primarily because each is plausibly associated with—or in the case of ideological leaning, actively describes—preferences over political outcomes. The link between income and preferences over economic policies is well established (e.g., Gelman Reference Gelman2008; McCarty, Poole, and Rosenthal Reference McCarty, Poole and Rosenthal2006), but education and age are related to key emerging political cleavages in the United States and United Kingdom, with more educated and younger voters tending to hold more socially liberal, cosmopolitan views (Ford and Goodwin Reference Ford and Goodwin2014; Inglehart and Norris Reference Inglehart and Norris2017). Regarding gender, past research also shows that men and women differ in their average preferences over gender roles and gender equality policies (Campbell, Childs, and Lovenduski Reference Campbell, Childs and Lovenduski2009). Thus, substantial differences in strategic responsiveness by any of these characteristics would be a cause for concern on normative grounds, as it would suggest that types of voters who differ in their political preferences also differ in their ability to secure preferred electoral outcomes.
Of the five characteristics chosen, age and education have received attention in existing studies of heterogeneity in strategic behavior across voters. Neither Evans (Reference Evans1994) nor Fisher (Reference Fisher2001) find evidence that age is associated with tactical voting rates. Evans (Reference Evans1994) also finds no evidence that education is associated with tactical voting rates, but Fisher (Reference Fisher2001) shows a positive relationship between education and tactical voting among voters who might benefit from voting tactically. Black (Reference Black1978) and Merolla and Stephenson (Reference Merolla and Stephenson2007) also find that measures of strategic incentives better explain voting behavior among more educated voters.
Table 2 shows how raw strategic responsiveness (SR) varies by social characteristic, again pooling the 2005, 2010, and 2015 BES samples. Rows 1–3 of the table indicate that, when we divide the sample into three groups according to educational attainment,Footnote 33 raw strategic responsiveness varies only moderately across these groups (SR = 0.35, SR = 0.33, SR = 0.37, respectively). Rows 4–6 of the table instead divide the sample by age and suggest quite substantial differences in strategic responsiveness, with voters aged below 30 notably less responsive (SR = 0.28) than voters aged between 30 and 59 (SR = 0.36) and 60 or above (SR = 0.38). Rows 7–9 divide the sample by income tercile and also reveal notable differences in strategic responsiveness, with high-income voters (those in the top income tercile in the sample) more responsive than their low- and medium-income counterparts (0.40 vs. 0.33 and 0.34). The remaining rows show slightly higher strategic responsiveness among women than men (0.36 vs. 0.34) and among voters who assign a higher like/dislike score to Labour than to the Conservatives (0.37 vs. 0.34).
Raw Strategic Responsiveness by Social Characteristics

As noted above, a difference in strategic responsiveness between two groups of voters could arise because the two groups approach similar voting decisions differently or because the two groups face different types of voting decisions. We therefore compare strategic responsiveness across voter groups using the regression specification given above in equation (2), which controls for τ values.
To flexibly control for τ, we include dummy variables for the ten nearly equal-sized bins of τ we used for Figure 4 above, thus allowing the baseline propensity to vote tactically to vary across bins of τ.Footnote 34 We also include an indicator for each election year and, in models that control for bins of τ, we interact these bins with the election year indicators to allow baseline responsiveness to τ to vary across years.
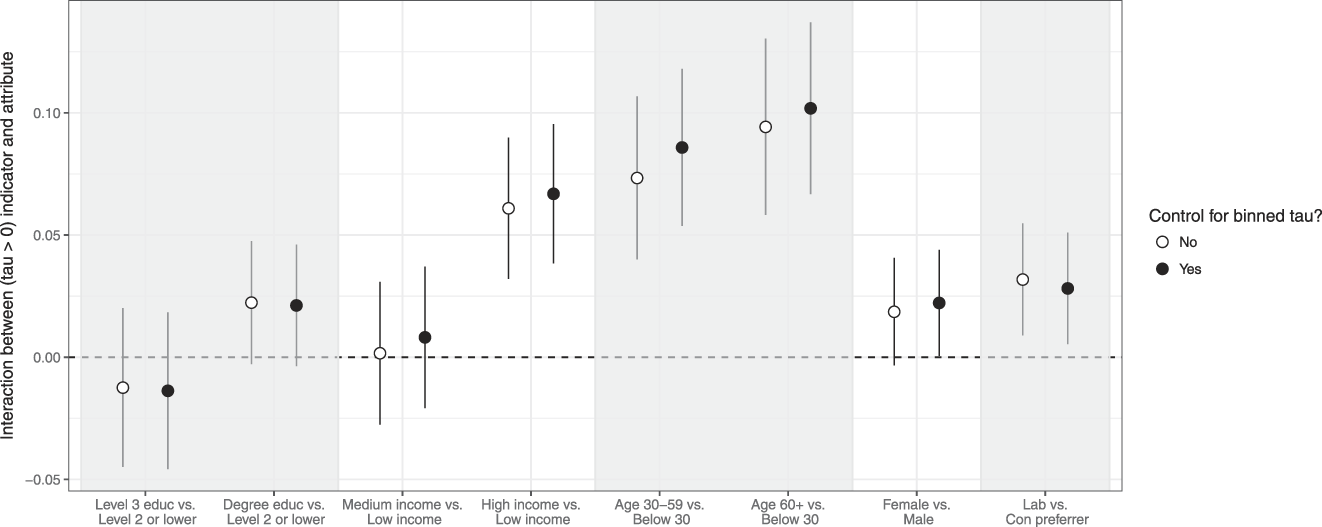
Figure 5 shows our estimates of and 95% confidence intervals for β 3 from regressions like expression 2, both with and without controls for τ (solid and open circles, respectively). (Thus the open circles depict the differences in SR reported in Table 2.) The main takeaway is that the estimated differences in SR do not change much when we control for τ, which suggests the distribution of τ is fairly similar across these subsets (conditional on the sign of τ). The figure also shows that the larger differences in SR we reported in Table 2 are highly statistically significant; the Labour-vs-Conservative preferrer difference is also significant in both specifications and other differences are insignificant or marginally significant.
Heterogeneity in Responsiveness to Tactical Incentive by Social Characteristics
Note: Each dot shows the estimated difference in strategic responsiveness between two groups of voters [β 3 in equation (2)], with 95% confidence intervals shown by vertical lines. The closed (open) circles come from regressions with (without) controls for bins of τ.

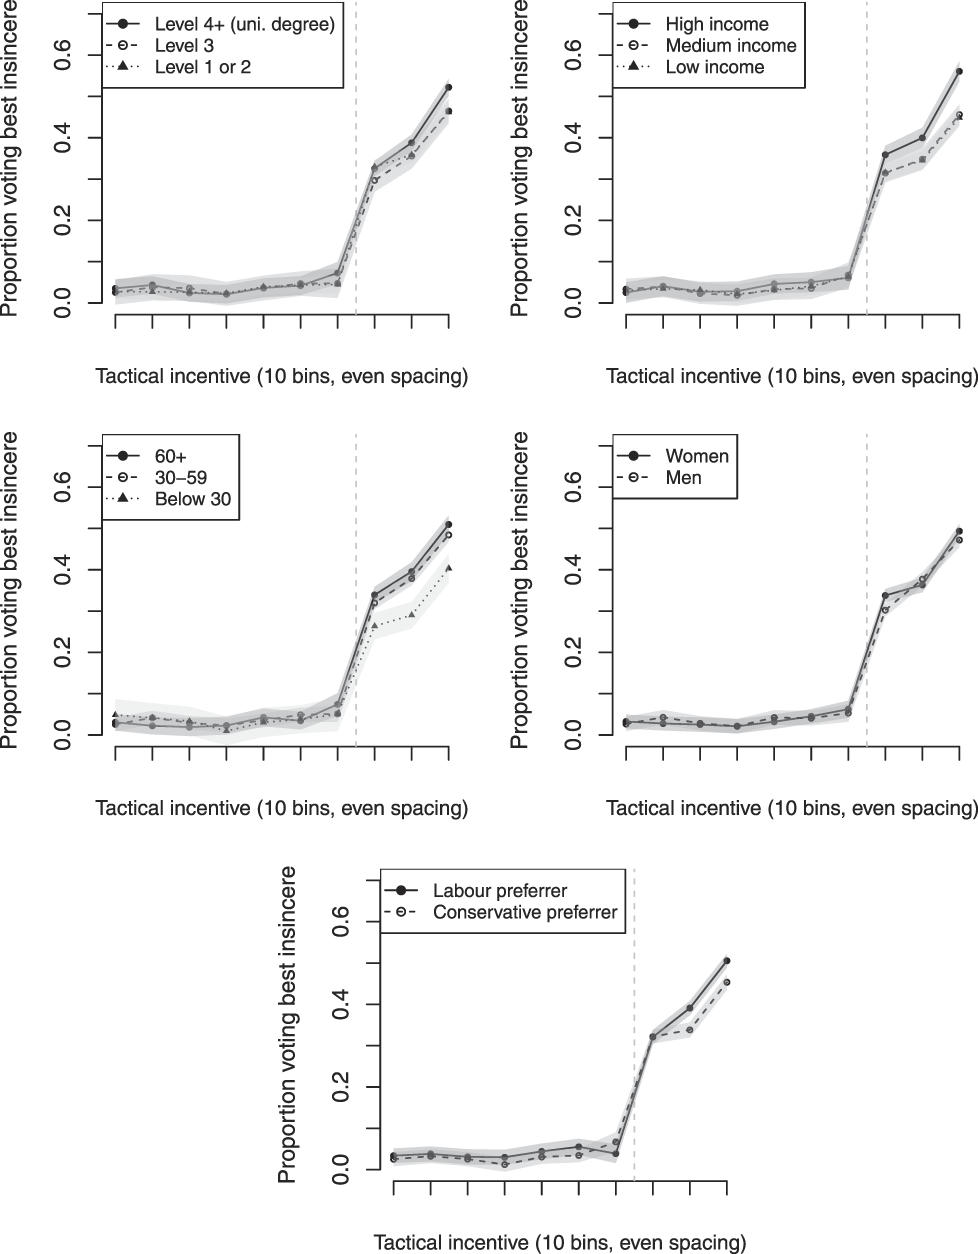
Figure 6 provides another view of the heterogeneity we detect in strategic behavior. Here we depict the rate of best insincere voting as a function of τ separately by social characteristic. In the cases where our regression analysis shows a significant difference in SR (especially age and income), the curvature of the function varies noticeably across groups.
Strategic Response Functions by Social Characteristic
Note: Each diagram shows, as a function of τ and with subsetting by social characteristic, the proportion of respondents casting a “best insincere” vote, i.e., the insincere vote that yields the maximum expected outcome-based utility among insincere votes. Online Appendix Figure C.8 shows the same relationships when the outcome is “any insincere vote.”

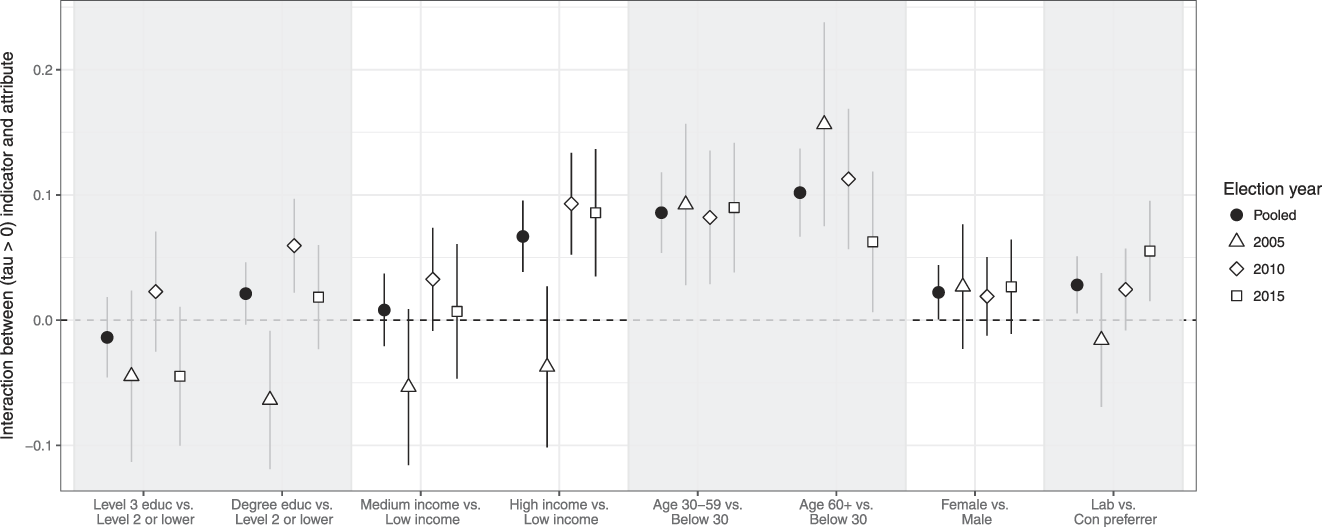
How stable are these results when we break down our data by election year? Figure 7 shows the estimated interactions between group membership and I{τ i > 0} when we estimate equation (2) separately by election year (2005, 2010, and 2015) and in all years pooled together, each time controlling for bins of τ.Footnote 35 Each point estimate in this figure comes from a separate regression. The pooled estimates (filled black dots) correspond to the estimates in Figure 5 that control for bins of τ. For age-group and gender the point estimates of the interaction coefficients appear to be reasonably stable across election years. The interactions involving education, income levels, and ideological leaning vary more across years.
Heterogeneity in Responsiveness to Tactical Incentive Across Election Years
Note: Each point shows the estimated difference in strategic responsiveness between two groups of voters [β 3 in equation (2)], with 95% confidence intervals shown by vertical lines. The solid circles show estimates for all years together; others show estimates for a single election year.

Putting Magnitudes in Context
To help put these results in context, we can compare the extent to which different types of voters in recent British elections are predicted to waste their vote due to departures from purely strategic voting (our focus) and due to failing to vote at all (i.e., abstention). Assuming that Pr(τ i > 0) is about 1/3 for all types of votersFootnote 36 and that (consistent with Table 2) the probability of an insincere vote (best or otherwise) when τ i < 0 is about the same for all types of voters, the difference in the proportion of votes wasted due to departures from purely strategic voting for two groups of voters is approximately 1/3 the difference in SR between the two groups of voters.Footnote 37 Based on Table 2, then, the difference in the wasted vote rate for young and old voters is about  ${1 \over 3}\left( {0.38 - 0.28} \right) \approx 0.033$ and for poor and rich voters is about
 ${1 \over 3}\left( {0.40 - 0.33} \right) \approx 0.023$. By comparison, analysis of validated turnout in the face-to-face 2015 BES indicates a difference in abstention rates between young and old voters of around 0.34 (c.f. Prosser et al. Reference Prosser, Fieldhouse, Green, Mellon and Evans2018), i.e., around 10 times larger, and between poor and rich voters of around 0.14, i.e., around 7 times larger. In terms of wasted votes, then, the differences we observe in strategic behavior are much smaller than the corresponding differences in turnout; still, a policy proposal capable of reducing the turnout gap across age-groups by 10% or across income groups by 15% would undoubtedly deserve attention.
What Explains Heterogeneity in Strategic Responsiveness?
As noted above, differences in measurement error across types of voters could produce apparent differences in strategic responsiveness: if the party ratings we use are an especially noisy proxy of preferences for one group of voters, then we will have less precise measures of their τ, leading us to conclude that they are less responsive to strategic incentives than they actually are. Could differences in strategic responsiveness that we have documented, most notably by age and income group, simply reflect differential measurement error?
In Online Appendix C we study various plausible ways in which differential measurement error might arise and show that none of these appear to explain the differences in strategic responsiveness by age and income that we find in our main analysis. These estimated differences remain similar when we measure preferences based on either party leader ratings or postelection party ratings rather than (as in the main analysis) a mix of post- and preelection party ratings. This stability indicates that the age and income results cannot easily be explained by differential measurement error that arises due to either one type of voter caring less about party leaders (rather than the party as a whole) than another or one type of voter having preferences that are more consistent over time than another. Neither do we find evidence that the observed age and income results are driven by differential measurement error that arises due to one type of voter caring more about local candidates (rather than the party as a whole) than another: when we examine the proportion of each type of voter who explains their vote choice in terms of local candidates, the types more likely to do so—and thus for whom party-based preference measures are likely to be noisiest—are those we find to be more strategic (i.e., older and richer voters). Finally, we reestimate our main analysis allowing strategic responsiveness to vary by preferred party and by strength of party identification, both of which are plausibly associated with differential measurement error in the mapping of true preferences to party ratings (e.g., because respondents with stronger party ID tend to overstate the utility they receive from their preferred party winning).Footnote 38 The differences in SR by age and income persist.Footnote 39
What then explains the differences in strategic responsiveness that we have observed? The simple model of voting behavior introduced above suggests that voters deviate from purely strategic voting for two main types of reason: first, because they obtain additional benefit from casting a sincere vote (a larger b parameter), due either to their expressiveness or their desire to affect future elections or policy outcomes; or second, because they misperceive the strategic incentive (a larger ε value) due to information or reasoning errors. Which of these reasons explains observed differences in strategic responsiveness by, for example, age and income groups? Online Appendix B reports some initial evidence relating to this question, which we summarize here.
First, to test whether our main findings reflect differences in the degree to which voters care about casting a sincere vote versus short-term outcome-based utility, we use two 2015 BES items asking respondents to consciously weigh up these considerations: to the extent that respondents agree with the statement “People who vote for small parties are throwing away their vote” and disagree with the statement “People should vote for the party they like the most, even if it’s not likely to win” we measure them as having a more strategic disposition (oriented more toward short-term outcome-based utility than to expressive or long-term considerations). We show in Online Appendix B that respondents with stronger strategic disposition judged by this measure are substantially more strategically responsive. We also show that, once we allow strategic responsiveness to vary by strategic disposition, differences by age (but not by income) are substantially attenuated. This suggests that older voters are more strategically responsive in part because they are consciously more instrumental in their vote decisions. In the terminology of our simple model, younger voters may have a larger b parameter than older voters, whether because they enjoy expressing themselves or because they care more about the effect of their vote on future elections.
Second, we test whether observed differences in strategic responsiveness arise due to differences in voters’ accuracy of perceptions. We find that voters who correctly predict the local winner and who have been contacted by parties during the campaign are more strategically responsive. Controlling for these and other proxies for voters’ information levelFootnote 40 does not, however, affect the differences in responsiveness that we find by age and income. We also find that voters who believe that their vote is more likely to affect the outcome are more strategically responsive (perhaps because this inflates perceived τ); controlling for subjective vote efficacy does not, however, substantially alter our main results concerning age and income. Thus, we uncover little evidence that differences in strategic responsiveness by age and income arise because older or higher income voters are better informed or perceive strategic incentives differently to younger or lower income voters.
DISCUSSION AND CONCLUSION
In their article “In Praise of Manipulation,” Dowding and Van Hees (Reference Dowding and Van Hees2008) argue that strategic voting is not as normatively problematic as many democratic theorists think. They recognize that it may be worrying if some voters have the “information and understanding” necessary to vote strategically, whereas others do not (p. 4), but they downplay that concern by arguing that democracy benefits when voters seek the information and understanding that would make them better strategic voters (p. 10).
Whereas Dowding and Van Hees discuss inequalities in strategic voting as a hypothetical problem, their sanguine view may be more difficult to sustain once we take into account the findings of this article, which shed new light on the empirical extent of such inequalities. In particular, we find that richer and older voters (who already participate in elections at a higher rate in the United Kingdom and elsewhere) appear to be further advantaged when it comes to strategic voting. Although we agree with Dowding and Van Hees’s view that it is good for democracy if “the inherent possibilities of strategic voting encourage voters to learn more about their democracy and the views of their fellows” (p. 10), this benefit must be weighed against the possibility that certain types of voters are underrepresented because of systematic differences in strategic behavior. In the case of age, inequalities in strategic behavior may have more to do with voters’ time horizons than with their “information and understanding,” which further complicates Dowding and Van Hees’s case: if younger voters are more likely than older voters to “waste” their vote on a certain party because they care more about who is in power several elections in the future, then inequalities in strategic voting will not disappear even if younger voters seek out better information and understanding (whatever other benefits this search may have for democracy). In this scenario, the only way to make younger voters more effective at determining the outcome of current elections is to make them less effective at determining the outcome of future elections. In light of these observations, we conclude that the case for “praising” or even tolerating inequalities in strategic voting becomes weaker, and the argument for adopting electoral systems that are less likely to reward strategic voting becomes stronger.
We see two main tasks for future research on inequalities in strategic voting. First, researchers can apply and improve our framework to measure inequalities in other settings, which would help determine the extent to which the differences we find are deep-seated or due simply to the particularities of the three UK elections we study. Our results should be compared with results from other elections in the United Kingdom, plurality elections elsewhere, and elections carried out under different electoral rules. Researchers could also investigate whether strategic behavior directed at government formation also varies across groups. Second, additional research could help us understand why differences in strategic voting arise. We took a first step by checking whether observed differences in strategic responsiveness disappear when we control for specific factors that might differ across groups, such as levels of information or general attitudes toward vote choice. Future studies might go further not just by extending our approach (ideally with better measures of these alternative factors) but also by using panel data to explore the role of experience in explaining differences in strategic behavior by age, experimentally varying the information available to voters, or priming different aspects of vote choice.
SUPPLEMENTARY MATERIAL
To view supplementary material for this article, please visit https://doi.org/10.1017/S0003055419000820.
Replication filess can be found on Dataverse: https://doi.org/10.7910/DVN/E5KOKE.






Comments
No Comments have been published for this article.