


Introduction
Most of the Antarctic ice sheet is covered by snow, but over about 1% of the surface blue ice is exposed (Reference Winther, Jespersen and ListonWinther and others, 2001). Blue ice occurs where annual net ablation exceeds accumulation, removing the snow and firn cover from the top of the ice sheet and exposing older, denser ice beneath. The exposure is often a result of flow over buried bedrock features, and in some cases this leads to high vertical strain into the ablation zone, and an accumulation of a lag deposit on the surface of all non-volatile materials within the ice, notably meteorites. At the margins of a blue-ice region, a delicate climate-dependent balance exists between annual accumulation of snow and ablation (Reference Bintanja, Jonsson and KnapBintanja and others, 1997). It has long been suspected that blue-ice extent might change over time due to changes in climate (e.g. Reference Orheim and LucchittaOrheim and Lucchitta, 1990; Reference Bintanja and van den BroekeBintanja and Van den Broeke, 1995). However, Reference Bintanja and van den BroekeBintanja and Van den Broeke (1995) found that blue-ice extent was relatively stable near exposed nunataks in Dronning Maud Land, Antarctica.
This project attempts to determine whether blue-ice area has been increasing or decreasing over the past 30 years on a portion of the East Antarctic plateau near Byrd Glacier (80˚ S, 155˚ E). The study area encompasses several low-relief blue-ice regions on the edge of the plateau (Fig. 1). We selected regions with low relief, and somewhat separated from exposed mountain ridges, to maximize the potential for climate response. It is hypothesized that the steep mass-balance gradients found by Reference Bintanja and van den BroekeBintanja and Van den Broeke (1995) were due mainly to terrain influences, creating a microclimate leading to blue-ice formation and persistence. Proximity to nunataks and mountain ridges leads to steep spatial gradients in wind speed and accumulation. Blue ice near these features is relatively insensitive to climate change. Our ‘bare plateau’ regions, which we name Darwin, Butcher and Bates after nearby geographic features, are likely to have much lower gradients near their edges. This conjecture is supported by the presence of broad areas of exposed deep firn surrounding each of the sites. Although all the features have nearby exposed bedrock, the features extend many kilometers away from the rock ridges.
Location of the study areas. Map image is based on MODIS (Moderate Resolution Imaging Spectroradiometer) data. The study areas are named informally for this study, based on local nunataks or glaciers.
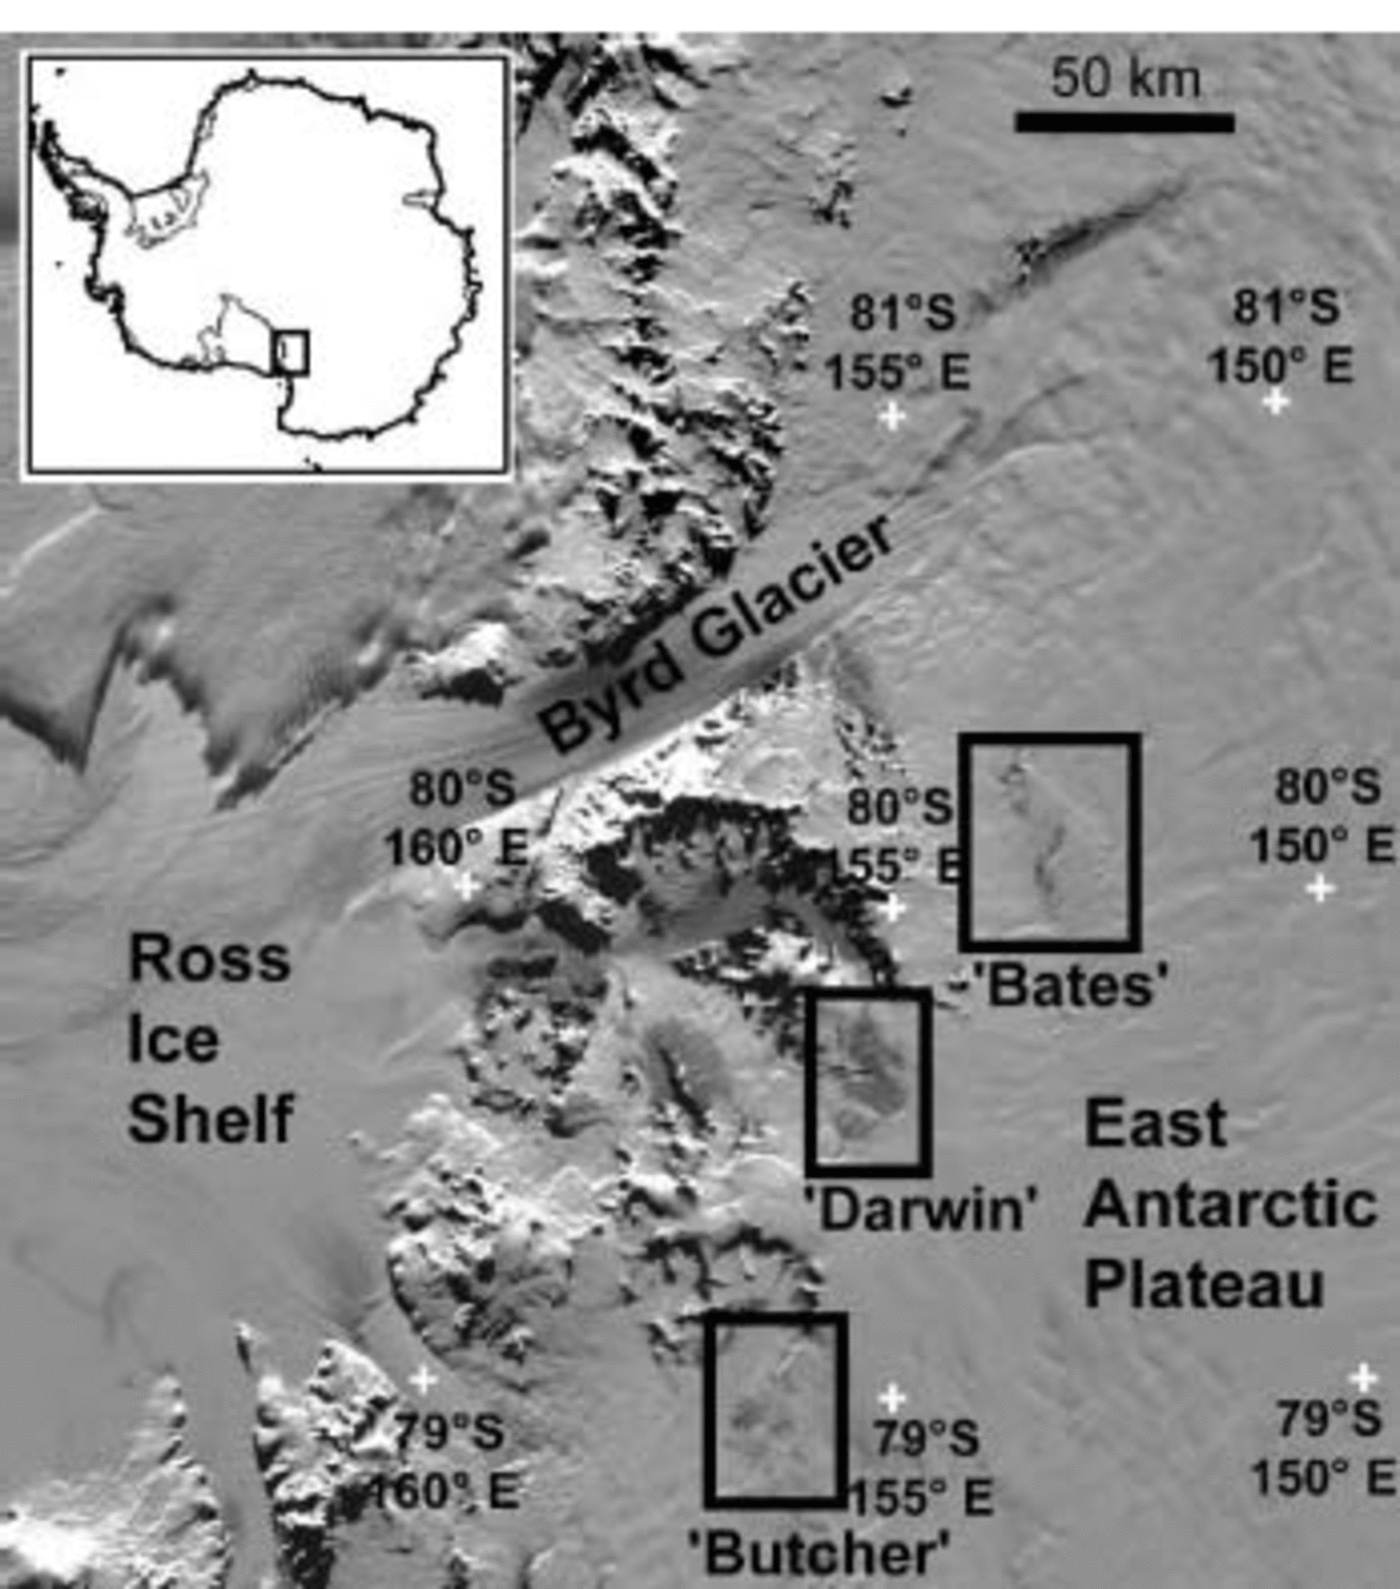
The three study areas are north of the main Byrd Glacier trunk. The ‘Darwin’ blue-ice area (79.6˚ S, 155.2˚ E) is a broad expanse of blue ice (∼220km2) near Meteorite Hills on the north side of the upstream end of Darwin Glacier. It is an ideal site for the study because of its extent and low surface relief, particularly along its western edge. ‘Butcher’ (78.9˚ S, 156.0˚ E) is a region of scattered blue ice and deep firn exposure (about 50 km2 in aggregate given our thresholds, described below) extending north of Butcher Ridge. ‘Bates’ is a cluster of well-defined blue-ice areas totaling roughly 25 km2 near the Bates Nunataks (80.0˚ S, 153.0˚ E). One of the patches of blue ice is closely associated with the rock exposures, but a string of other exposed areas to the north is not near exposed rock. All three of the sites are at ∼1800m elevation. No automated weather station data are available for the sites.
We use recent summertime data from the Moderate Resolution Imaging Spectroradiometer (MODIS) on the Terra satellite, and Landsat digital imagery of the study area spanning three decades (Landsat Multispectral Scanner (MSS); Thematic Mapper (TM); and Enhanced Thematic Mapper Plus (ETM+)). We cross-calibrate these sensors using selected small sites of snow, firn and blue ice that appear to be unchanged over the period. Our study seeks to determine both intra-annual variations, i.e. seasonal changes in blue-ice exposure over the last few years, and interannual variations through the three-decade period. For the intra-annual variations, we use MODIS data. This sensor provides frequent coverage of the study area through the austral spring and summer seasons since 2000/01, and the images are provided at no cost. The resulting plots of seasonal exposure allowed us to select appropriate Landsat images for year-to-year blue-ice extent comparison. However, as developed below, the use of these two different types of sensors requires different algorithmic approaches. A key factor was insuring that consistent blue-ice measurements were being made by the sensor series, and that images were free from the effects of thin clouds.
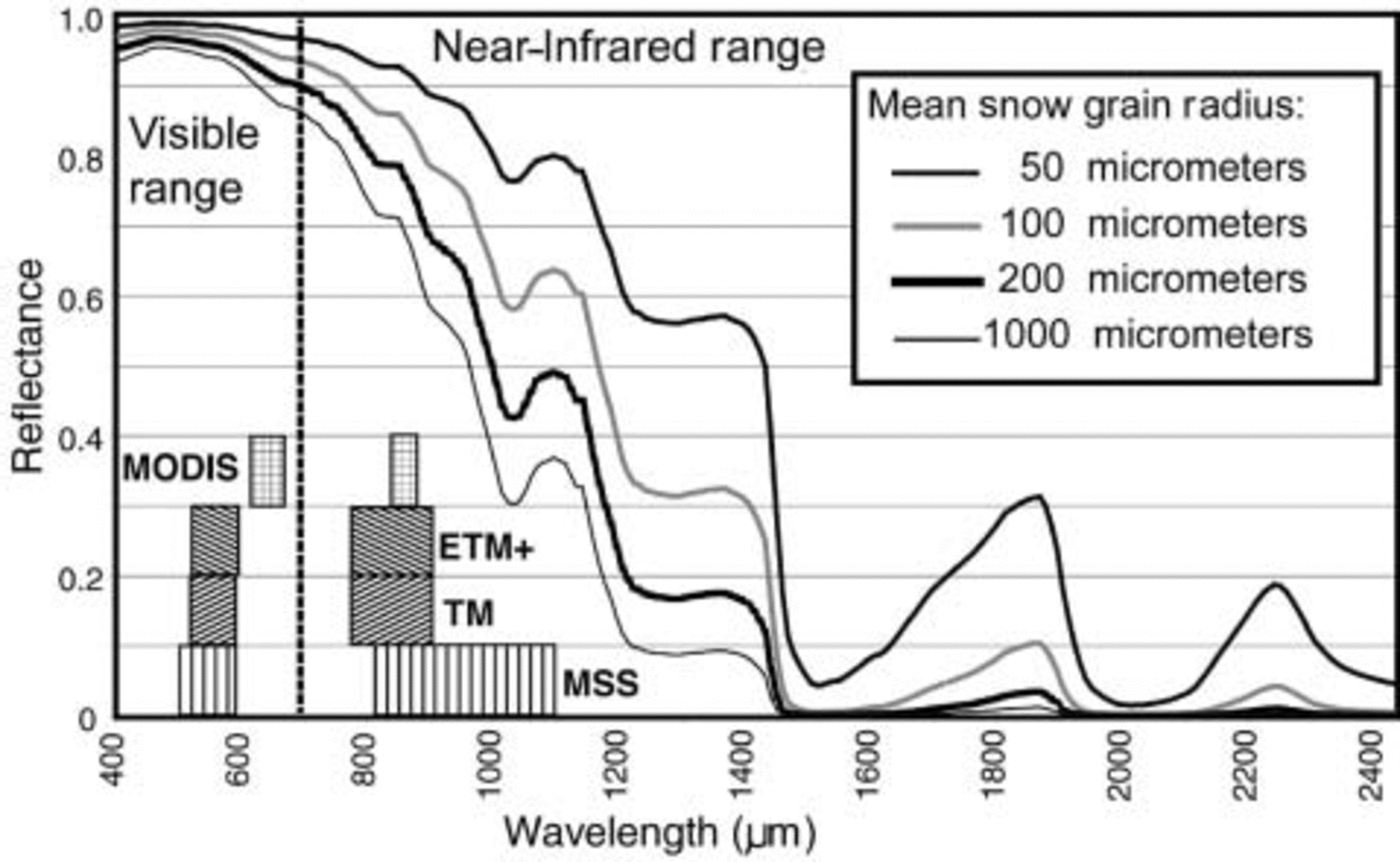
Both algorithms are based on the increased infrared absorption of ice with grain-size (Fig. 2). This method is discussed by Orheim and Lucchitta (1990). In the visible light range (wavelengths 0.45–0.7 μm), particularly in the blue end, snow and coarse-grained firn and ice have approximately the same reflectance. However, in the near-infrared (NIR; wavelengths 0.8–1.2 μm) the reflectance of the coarser-grained ice is much lower. This is due to a broad ice absorption band in the near infrared (which extends slightly into the red end of the spectrum, giving blue ice its characteristic color). Both snow and ice absorb infrared light, but in larger crystals, as in ice, the light travels a greater mean distance before being reflected back to the satellite. This causes more of the infrared and red light to be absorbed.
Spectral reflectance of ice at various grain-sizes. Also shown are the spectral bands used in our NDSI-like algorithm for mapping blue-ice extent. Reflectance data from Reference Nolin and DozierNolin and Dozier (1993) and A. W. Nolin (personal communication).
Satellite Measurement Method
MODIS blue-ice area measurement
MODIS data were selected by examining browse images available on the MODIS Rapid Response System site (http://rapidfire.sci.gsfc.nasa.gov). Level 1B quarter-kilometer scenes were downloaded and geolocated onto a polar stereographic grid using software developed at the US National Snow and Ice Data Center (the MODIS Swath-to-Grid Toolkit, or MS2GT, available to the public at http://nsidc.org/PROJECTS/HDFEOS/MS2GT). This code was also used to calibrate the two 250 m resolution channels (bands 1 and 2 of the sensor) and correct for solar zenith angle variations across the study area. We identified 56 near-cloudless scenes for the three summer seasons. We selected only scenes where the study area was near the nadir track. Earliest usable scenes were in late October, and latest scenes were in early to mid-March.
Pixel brightness values from the two geo-gridded, calibrated channels showed a broad range of absolute values over the image series. This is due to large variations in viewing and illumination over the October–March time-frame, and the broad-swath viewing geometry of the MODIS scanner. To reduce these effects, we corrected for solar elevation (dividing by the cosine of the solar zenith angle). However, even with this correction, normalized-difference-based algorithms still gave slightly inconsistent results. We suspect that these variations are due to scattering effects that result from the broad range of viewing geometry in the image series (despite selecting generally near-nadir data) and the scattering properties of snow and ice – effects that are less severe for narrow-swath satellites like Landsat. Throughout the scene series, and for all three years, cross-plots of the two channels had a characteristic shape (Fig. 3). We used this characteristic shape to develop a consistent MODIS blue-ice mapping algorithm. Due to the coarser pixel size of MODIS data, we applied this algorithm only to the largest blue-ice study area, Darwin.
MODIS pixels imaging a fresh-snow surface form a highly linear trend with generally high values of reflectance in both channels. Extending off this trend are firn, mixed-surface and blue-ice pixels. Pixels not lying on the roughly Z-shaped trend, a small fraction of the total, were either exposed bedrock, cloud or cloud shadow. We determined that the near-parallel linear trends representing snow and blue ice owed their extents to surface topography. Pixels lying on sunward slopes were bright in both channels, and slopes facing away from the sun were darker; but the ratio between the two channels was different for blue ice and snow.
To calculate blue-ice area, we set a threshold between the two trends parallel to the snow trend. This threshold is set by first masking pixels lying below the trend and then calculating a linear fit line to the snow pixels. Although the masking was accomplished by manual selection, the high number of pixels in the snow trend for the images (typically 10 000–12 000) made the determination of the linear trend robust. Correlation value (r) was typically 0.95 or higher. A threshold of 0.1085 was set to separate pixels with a reflectance below the snow trend, i.e. darker in channel 1 adjusted reflectance by this value relative to the pure snow trend. These pixels were counted as snow-free blue ice. The threshold value is chosen to match our early Landsat 7-based interpretations of blue-ice extent at the study sites. The threshold line separates the data across a minimum in the two-dimensional bimodal distribution of points, as shown by Figure 3. Thus the algorithm is relatively insensitive to small shifts of the chosen threshold value. Overall, the algorithm is better (more conservative) than a pure normalized-difference snow index (NDSI)-type algorithm at discriminating darker blue ice from shaded or dimly lit snow or rock–snow mixtures. It is also sensitive to sub-pixel mixtures of snow over blue ice; patchy snow cover of ∼40% of the surface will give reflectance values outside the allowed range for blue ice.
Cross-plot of MODIS band 1(red) and band 2 (NIR) for 29 December 2000 over the Darwin area, illustrating the basis for the blue-ice mapping algorithm.

Random errors in the MODIS measurement of the Darwin site’s blue-ice area are estimated to be on the order of a few (∼2) km2. We base this estimate on the similarity of repeat measurements made within 1–3 days during the midsummer maximum periods. Systematic error cannot be estimated because our criterion for identifying blue-ice pixels is fundamentally arbitrary: we selected thresholds and offsets that seemed to accurately represent what we visually interpreted to be snow-free blue ice from an examination of Landsat and MODIS scenes. Once we selected appropriate thresholds (for both the MODIS and Landsat algorithm), cross-validation among sensors (described below) attempted to maintain a consistent measurement. Year-to-year systematic errors for MODIS are unlikely because of the accurate calibration applied to the raw sensor data (calibration information is provided by NASA/Earth Observing System (EOS)).
Landsat sensor series blue-ice area measurement
Near-nadir, mid-summer viewing conditions for the Landsat sensor series images favored the use of a normalized-difference algorithm. Normalized-difference indices are standard algorithms used to determine the extent of vegetation and other basic spectral properties. One widely-applied example is the normalized vegetation index (NDVI), used to map green-leaf coverage. It has been adapted to a variety of sensors. It is based on the formula:

This combination enhances reflectance differences between the red and NIR bands but corrects (normalizes) the differences for variations in illumination. For some previous studies (e.g. Reference Bourdelles and FilyBourdelles and Fily, 1993; Reference Hall, Riggs and SalomonsonHall and others, 1995), this algorithm was used with the Landsat TM band 5 (1.55–1.75 μm) as the NIR channel for greater contrast between grain-sizes. Here, however, we modify the algorithm to:

The result is an NDSI algorithm that can be used across the Landsat sensor series for long-term analysis of blue-ice extent changes. This modification increases the sensitivity of the algorithm relative to NDVI because of the higher, more uniform reflectivity for snow and ice in the green channel for all grain-sizes (see Fig. 2). Using the blue band would potentially improve the algorithm still further, but scattered light from the atmosphere is a significant problem in the blue channel, and there is no blue band available in the older MSS imagery. Similarly, there is no channel at ∼1.6 μm in MSS. In our NDSI images, blue ice stands out as bright (high ratio values), and finer-grained firn and snow are dark (low ratio values).
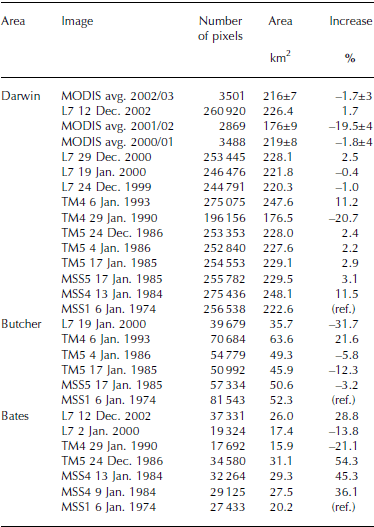
Fifteen clear-sky Landsat images were selected from the United States Geological Survey archive using browse images on the web site ‘Earth Explorer’ at http://edcimswww.cr.usgs.gov/pub/imswelcome/plain.html (see Table 1). Based on results of the MODIS seasonal area investigation (discussed below), we selected images as close to mid-summer as possible, ranging from 12 December to 29 January. Among the available images, we identified a Landsat 5 TM and MSS pair of images acquired on the same day (17 January 1985), permitting accurate sensor cross-calibration.
Landsat images used for interannual variability of Byrd blue-ice areas
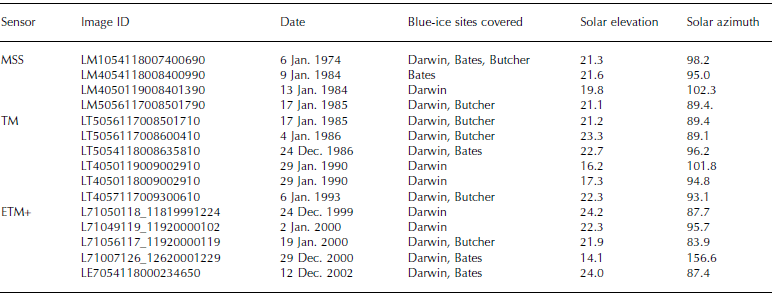
Images were rotated, resampled to 30m pixels and reprojected to a polar stereographic projection. They were then registered to two Landsat 7 images: 19 January 2000 for the Darwin and Butcher regions, and 2 January 2000 for the Bates region. This was done by picking 15–20 registration points and using a RST (rotation, scale, translation) transformation with cubic convolution resampling. This kept the image brightness data as close to the original sensor values as possible and preserved the boundary shape of the blue-ice regions. Nearest-neighbor resampling provides greater radiometric fidelity, but can distort edges in the output scene.
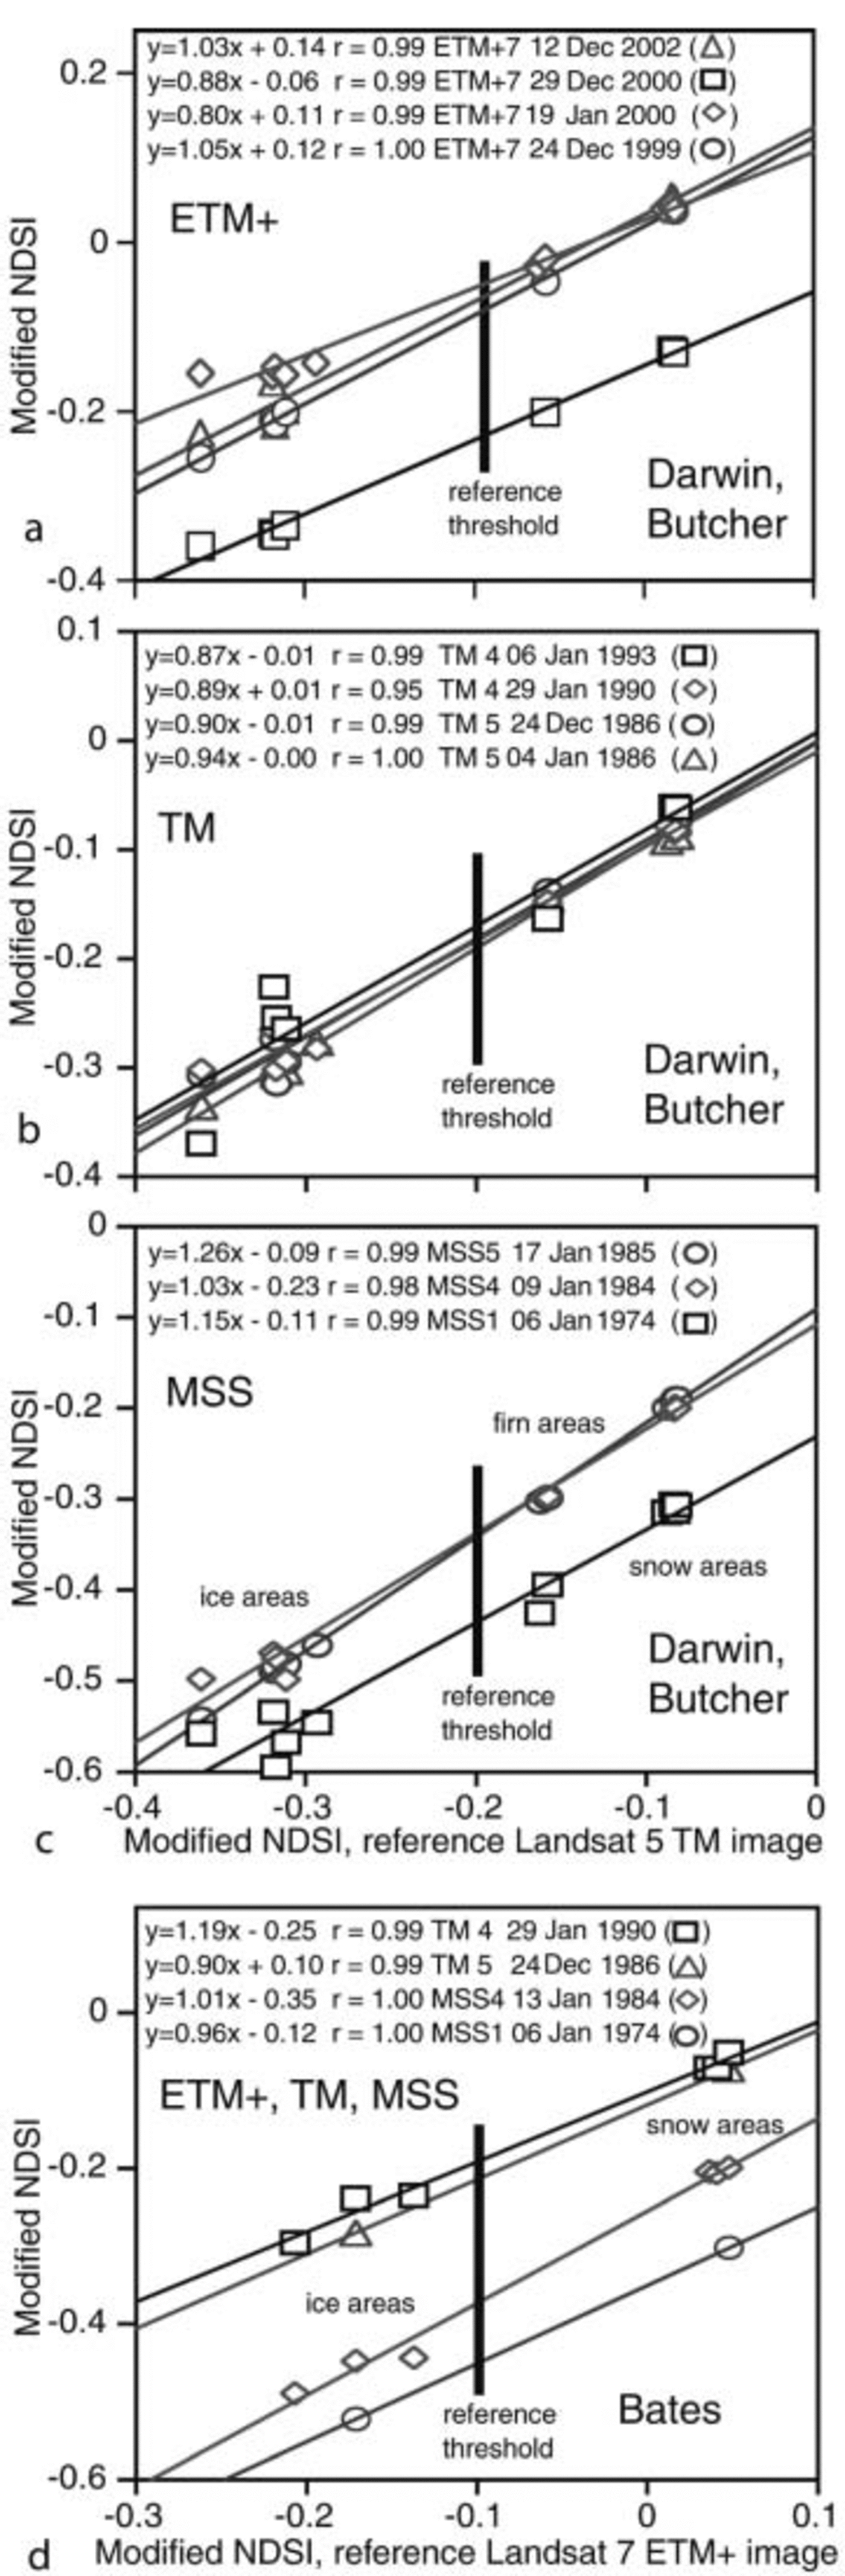
To determine the area of blue ice, we counted all pixels having a NDSI value within a range of thresholds. For intercalibration of the images, test regions were selected in areas of pure snow, pure blue ice, and mixed snow and ice that appeared to show no changes over the interval of investigation (Fig. 4). The mean, standard deviation, minimum and maximum of the separate bands and the NDSI parameter were determined for all test areas in all images. Standard deviations of the bands and the NDSI parameter were small, typically 2–6DN (‘data number’, the raw sensor count from the sensor) for the bands, and ∼0.02 or less for the NDSI parameter (see Fig. 5). The means were compared to means of a master image (17 January 1985 TM) to determine a linear relationship relative to the master. The master image threshold is arbitrarily set to select pixels that appeared to mark our visual assessment of the blue-ice extent in this image. Adjustments to this threshold were then applied based on the linear trends of the reference test sites (using y = mx+ b, where y is the comparison image threshold value, m is the slope of the fit, x is the master image threshold, and b is the intercept for the fit). Linear fits for the test sites in the image-to-image cross-plots were highly correlated (r values > 0.95; Fig. 5).
Landsat MSS and TM NDSI images (13 January 1984, MSS (a); 29 January 1990, TM (b)) showing the Darwin study area during high exposure and low exposure with surface-type sub-areas used for intercalibration of Landsat sensors. Similar calibration sub-areas were selected for the Butcher and Bates areas.

(a–d) Cross-plots of NDSI values for several Landsat sensors relative to the selected reference images: Landsat 5 TM scene acquired 17 January 1985 (Darwin, Butcher areas (a–c)) and a Landsat 7 ETM+ scene acquired 2 January 2000 (Bates area (d)). Linear fits to the test-area values for each image are used to adjust the threshold value used in mapping blue-ice extent. Threshold values for the y-axis images are simply the intersection of the reference threshold with the fit lines. Error, or scatter, for the individual pixels in the sub-areas is at most two times the symbol size.
MSS sensor images had some saturated areas in the green-light band (band 4). In order to compensate, a mask was created for the saturated pixels in the MSS green band. Blue-ice extent in both the MSS image and the master image (which had no saturated pixels) was then measured with the mask applied. The ratio of masked to unmasked blue-ice area in the master image was determined, and this ratio was inverted and used to correct the MSS blue-ice area to create an adjusted blue-ice extent. The masked, or saturated, portion of the blue-ice areas in the MSS scenes ranged between 5% and 27%.
An estimate of overall error for the Landsat sensor series measurements comes from a comparison of the MSS and TM image pair for 17 January 1985. While the area difference between the two datasets for the Darwin study area is small (0.4km2), the same pair give a larger difference for the smaller, more distributed Butcher region (4.8km2), about 9% of the total area. This larger error may stem from the high proportion of ‘edge’ pixels for the Butcher area. Another estimate comes from the MSS image pair of 9 January and 13 January 1984 for the Bates region. Here the difference is relatively low (1.9km2), although it is a large proportion of total area for this region (∼9%). It is unclear how much of the difference may be related to exposure area changes over the 4 day interval. Our best estimate of error for the Landsat sensor series image is 2–4km2, highest for the MSS images (having larger sensor pixel size, lower quantization accuracy, and a saturation problem in the green channel), and lower for the TM and ETM+ sensor. It also seems likely that the error magnitude among the study regions is related to an edge-to-area ratio, rather than a uniform fraction of total area, given the characteristics of the algorithm and measurement technique.
Intercalibrating the MODIS and Landsat algorithms
We have near-simultaneous coverage of Landsat 7 and MODIS for both 29 December 2000 and 12–14 December 2002. The MODIS algorithm threshold was ‘set’ to match the Landsat ETM+ area on 29 December 2000. Using their respective thresholds, the Landsat algorithm indicated 228.1 km2, and MODIS gave 228.4 km2. A check of consistency is provided by the 12–14 December images. Using the thresholds determined from the year 2000 images, the 2002 images gave 226.4 km2 (Landsat 7 ETM+ from 12 December) and 222.7km2 (MODIS from 14 December; difference <2%).
Results and Discussion
MODIS data reveal that exposed snow-free blue-ice area as mapped by our algorithm has a significant variation over the course of the austral summer season (Fig. 6). There is steady growth in October–November, reaching a maximum by mid- to late December, small variations about the maximum through mid-January, and gradual reduction beginning as early as mid-January (e.g. 2003) or as late as late February (e.g. 2002). Throughout this overall pattern, significant area reductions lasting 2 weeks or more may occur (e.g. in early November and mid-December 2001).
Seasonal variations of snow-free blue-ice surface area for the Darwin study site from MODIS over the spring and summer seasons 2000/01, 2001/02 and 2002/03. Patchy snow partially obscures blue ice early and late in the season. At the top is a time plot of Landsat MSS, TM and ETM+ acquisition dates for the images used to map blue-ice area in Figure 7.
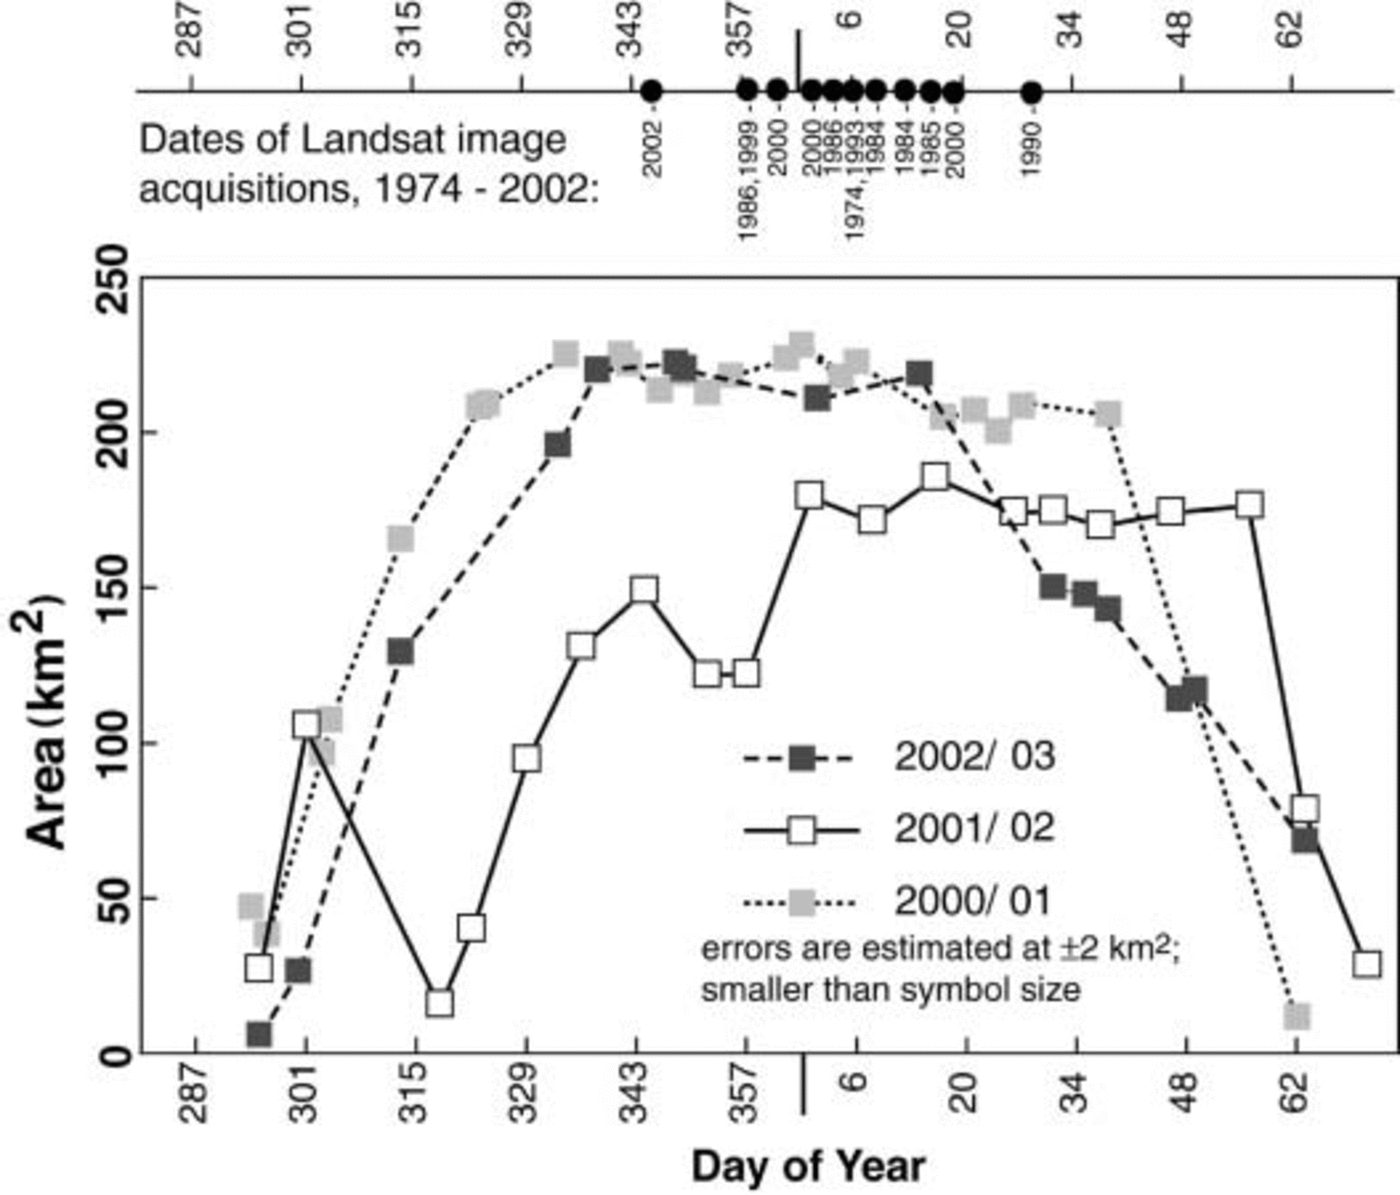
We interpret this pattern as resulting from the effect of sub-pixel distributions of mixed snow and blue ice. Blue ice is not completely obscured at either the beginning or end of the season, but reflectance values in band 2 of MODIS change considerably. The general outline of the Darwin blue-ice area is visible in all the MODIS images we used, but the spectral contrast between blue ice and snow is greatly reduced in early spring and late summer. We infer that snow partially obscures blue ice in early austral autumn, and is removed in austral spring. Field photographs of blue-ice areas often show snowpatches (e.g. Reference Bintanja, Reijmer and HulscherBintanja and others, 2001, Fig. 1).
This seasonal pattern of snow cover results from a large change in surface mass balance due to sunlight. Sunlight brings greatly increased sublimation (shown in Reference Bintanja, Jonsson and KnapBintanja and others (1997) in plots of shortwave radiation (their Fig. 6), and in specific humidity (their Fig. 2); and in their heat-budget plots later in the paper). We hypothesize that blowing snow is thinly deposited during winter, or during occasional storms in spring, but that high sublimation rates in summer remove the patchy winter build-up. Sublimation is higher in blue-ice areas than adjacent snow plains in summer because of locally higher wind speeds and warmer air near the surface. Warmer near-surface air is a result of the lower albedo of blue ice (the blue ice is not completely covered). Blue-ice albedo is generally 0.55–0.60, while snow is 0.8–0.9 (Reference Bintanja and van den BroekeBintanja and Van den Broeke, 1995; Reference Bintanja, Jonsson and KnapBintanja and others, 1997).
MODIS data in Figure 6 indicate a significant drop in maximum exposed area for the Darwin site in the 2002 season (for the following discussion, we will refer to summers by the year in January; e.g. austral summer 2001/02 will be termed ‘2002’). For the 2001 summer, ‘Darwin’ had a mean extent of 219 ± 8km2 (29 November–17 January; 13 image measurements); for 2002, only 176 ± 9 km2 (31 December– 25 February; 8 measurements); and for 2003, the extent was 216 ± 7km2 (4 December–4 January; 5 measurements). The 2002 season also reaches its maximum later in the season, and re-covering with snow occurs later in the summer than in
the other years. This suggests that blue-ice exposure (or persistence of patchy snow cover) can be highly variable. We note that in the following season, 2003, the exposure of blue ice was delayed relative to the 2001 season. This may be a consequence of thicker snowpatches in areas that were never cleared in the 2002 season.
Mid-summer area results for the three study areas from the combined Landsat and MODIS record (Fig. 7; Table 2) show that in most years the Darwin site area lies within a narrow range (e.g. 215–230km2), but small upward variations can occur (10–12% increase for 1984 and 1993) and sharp drops in area are possible, such as the anomalous 30% reduction in extent in 2002. In general, the Bates and Butcher areas are more variable, but track the trend seen for the Darwin site. This variability is likely due to the distributed, discontinuous geometry of the other two sites, resulting in a high proportion of ‘edge’ pixels. The 1990 extents are low for both the Bates and Darwin regions; however, the acquisition date for the 1990 Landsat TM scene is 29 January. As demonstrated in Figures 4 and 6, this date is during the period when increasing snow cover typically begins to obscure blue ice.
Exposed blue-ice area for Darwin, Bates and Butcher study regions for mid-summer period from Landsat MSS, TM and ETM+ sensors, and the mean value from MODIS during the three midsummer periods.
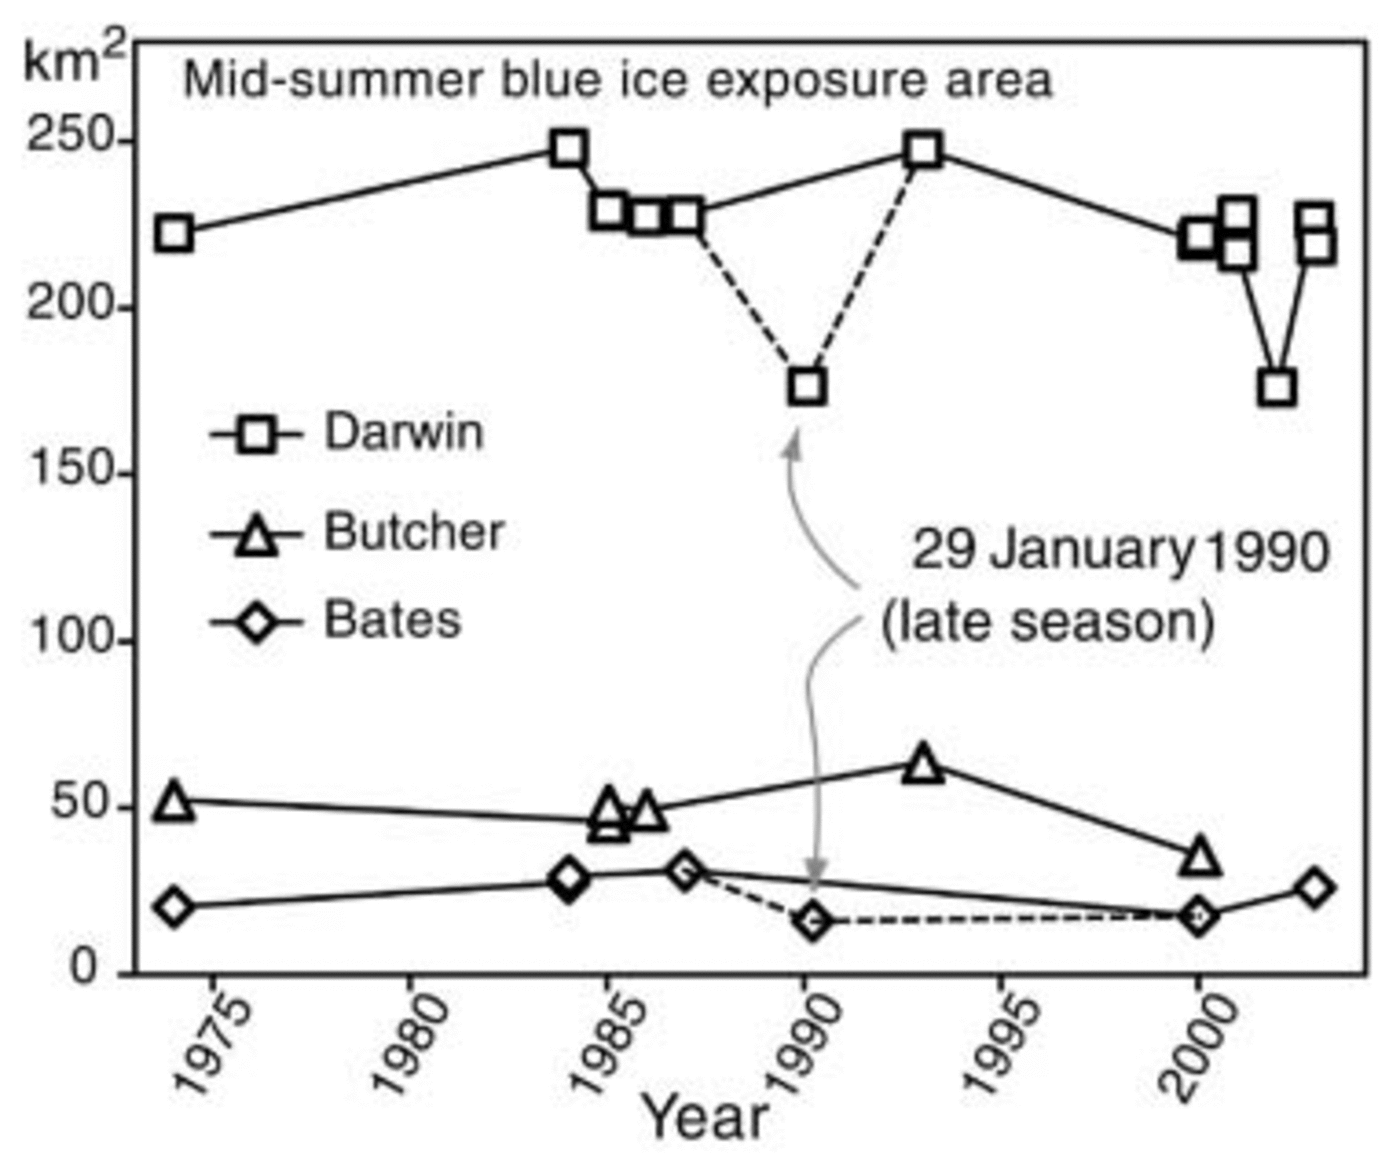
Area variations of Byrd blue-ice sites using MODIS and Landsat
The 2002 mean mid-summer extent for Darwin comes from a mean of eight MODIS measurements, and is unlikely to be significantly in error. With the elimination of the 1990 data point due to its lateness in the season, 2002 shows by far the smallest area of the 11 seasons measured. This implies that 2002 was an exceptional year climatologically for the Antarctic Plateau near Byrd. Anecdotal evidence suggests regional weather may indeed have been unusual. The warmest December temperature ever recorded at McMurdo (10˚C) was in late December 2001; extreme warmth persisted through much of early January; also, an unusually strong December storm occurred near solstice. The 2002 austral summer was not a period of large Southern Oscillation index of either sign: it was neither an intense ‘La Niña’ nor ‘El Niño’ period. However, an unusual, and unusually persistent, pattern of high-latitude high- and low-pressure areas led to extreme weather events throughout the Southern Hemisphere (Reference MassomMassom and others, 2004). One of many manifestations of the unusual climate for the 2002 austral summer was the break-up of the Larsen B ice shelf after the warmest peninsula season on record.
Summary
In comparing summer maximum extents over several years, and in considering the evidence provided by the seasonal cycle of snow cover over the Darwin blue-ice site, we note that large reductions in exposed blue-ice area are more likely than large increases. A relatively small change in seasonal climate, resulting in persistent, thicker snow cover over a summer, is more likely than the multi-year increases in sublimation that would be required to ablate dense firn and expand the exposure of blue ice. Thus, in a long series of blue-ice summertime maximum measurements, such as ours, decade-scale maxima are likely to be only slightly greater than the mean, while minima, or downward deviations from the long-term trend, may be greater and more variable. Our data show that the 1984 and 1993 extents for Darwin are likely to be the current maximum possible exposure (and are just ∼10% greater than the mean exposure), while 2002 represents a short-term, but larger, deviation downward due to thin snow cover. Bates and Butcher are more variable, and therefore harder to interpret. Figure 7 indicates that in general these sites show exaggerated variations of the same sign as the Darwin site.
As noted above, Reference Bintanja, Jonsson and KnapBintanja and others (1997) discuss the importance of summertime shortwave energy input in the annual energy budget of blue ice; and in earlier work, Reference Bintanja and van den BroekeBintanja and Van den Broeke (1995) identify the related parameter of surface mass balance as being paramount. The surface energy input is highly dependent on the lower albedo of blue ice relative to snow. Thus, a climate ‘feedback’ may make some blue-ice areas sensitive to slight increases in accumulation. Blue-ice regions that are sensitive, having gentle gradients in wind and snowfall (i.e. near-zero surface mass balance), may disappear quickly under conditions of climate change. Conversely, growth of blue-ice areas by an opposite change of similar magnitude will probably be slower.
Satellite images can be used to monitor blue-ice extent, but an image sensor permitting several measurements per season, such as MODIS, would be able to eliminate several uncertainties associated with Landsat-based analysis. The ability to track the seasonal exposure and re-covering of blue ice year-to-year provides a more robust indication of climate variations and long-term changes in extent. As the MODIS record grows through time, long-term trends, and the effects of climate variation, may become easier to discern.
Acknowledgements
We thank the Summer Undergraduate Research Experiences (SURE) program and the Undergraduate Research Opportunities Program (UROP), both at the University of Colorado. Research was also supported by NASA grant NAG5-3438. T. Haran and B. Raup assisted with MODIS and Landsat image processing.



