Introduction
Cotton (Gossypium hirsutum L.) is a multipurpose cash crop that is grown worldwide for its major products of fibre and feed for global industries. Cotton crop is a major contributor to the economy of Pakistan being the main source of foreign exchange earnings. Pakistan exports of cotton were US$3.24 billion during 2019, according to the United Nations COMTRADE database on international trade. The cropping systems, i.e. cotton-wheat, cotton-chickpea and cotton-fodder, delayed the cotton sowing from May (normal sowing) to June (late sowing) in Pakistan due to late harvesting of wheat, chickpea and fodder crops (Ali et al., Reference Ali, Farooq, Batool, Zahoor, Azeem, Mahmood, Jabran, Jabran and Chauhan2019). The seasonal temperature may exceed up to 45–50°C in cotton-growing regions in June and July, which is 20°C higher than the optimum temperature (Rahman et al., Reference Rahman, Malik and Saleem2004; Abro et al., Reference Abro, Rajput, Khan, Sial and Tahir2015). The optimum temperature for cotton growth and development is 20–32°C, whereas >36°C is considered as heat stress (Bibi et al., Reference Bibi, Oosterhuis and Gonias2008). Generally, the May sowing of cotton faced high temperature at peak flowering and may shed much of their flowers. The earlier studies revealed that crops can achieve only 25% of their yield potential under high temperature (Boyer, Reference Boyer1982). The past trend of global climate reveals that the last three decades were the warmest and the same trend may continue till the end of the 21st century with the increase of global mean temperature from 1 to 4°C (Driedonks et al., Reference Driedonks, Rieu and Vriezen2016). Similarly, in Pakistan, during summer, air temperature exceeds to 40°C in central and southern Punjab, which is the major threat to cotton production (PMD, 2009). The reproductive phases of crop plants are most vulnerable to regional and seasonal variations in temperature that leads to a loss in yield (Wahid et al., Reference Wahid, Gelani, Ashraf and Foolad2007; Bita and Gerats, Reference Bita and Gerats2013; Driedonks et al., Reference Driedonks, Rieu and Vriezen2016).
High temperature negatively influenced the flowering, boll retention and boll development, which ultimately results in lower seed cotton yield (SCY) (Singh et al., Reference Singh, Wijewardana, Gajanayake, Lokhande, Wallace, Jones and Reddy2018). The high temperature also resulted in the malformation of female organs such as embryos, style and ovaries (Ekinci et al., Reference Ekinci, Basbag, Karademir and Karademir2017). High-temperature tolerance assessment based on physiological mechanisms has been well studied. Among several physiological mechanisms, relative cell injury (RCI) was realized as an efficient tool to assess the high-temperature tolerance in the cotton crop (Rahman, Reference Rahman2006; Bibi et al., Reference Bibi, Oosterhuis and Gonias2008).
Sowing time adjustment had been used to study high-temperature stress at peak flowering period (Reddy et al., Reference Reddy, Doma, Mearns, Boone, Hodges, Richardson and Kakani2002). Similarly, very early sowing time is an important management practice that involved the escape of peak flowering from the onset of high-temperature stress (Saleem et al., Reference Saleem, Bilal, Anjum, Khan, Sarwar and Farhad2014). However, sub-optimal weather conditions in late sowing dates may affect SCY (Gormus and Yucel, Reference Gormus and Yucel2002; Dong et al., Reference Dong, Li, Tang, Li, Zhang and Niu2006; Zhao et al., Reference Zhao, Wang, Shu, Li and Zhou2012). Genotypic response for various traits including RCI, chlorophyll content (CC), bolls per plant (BP), boll retention percentage (BR), SCY and yield components were significantly influenced under high-temperature stress (>35°C) during peak reproductive phase in cotton (Rahman et al., Reference Rahman, Malik and Saleem2004; Rahman, Reference Rahman2006; Liu et al., Reference Liu, Yuan, Liu, Yu and Rao2006; Azhar et al., Reference Azhar, Ali, Akhtar, Khan and Trethowan2009; Karademir et al., Reference Karademir, Karademir, Ekinci, Basbag and Basal2012).
The breeding of thermo-tolerant cotton is highly demanded and a challenging task for improving SCY. The narrow genetic base of modern cotton cultivars could be dealt with on multi-level approaches including laboratory and field studies. The hypothesis of this research is that ‘are there different sowing dates that induce high-temperature stress to screen the cotton germplasm?’ Our objectives were (i) to evaluate the various agro-physiological markers for high-temperature tolerance, (ii) to select the best parents for breeding high-temperature-tolerant cotton cultivars.
Materials and methods
Planting material
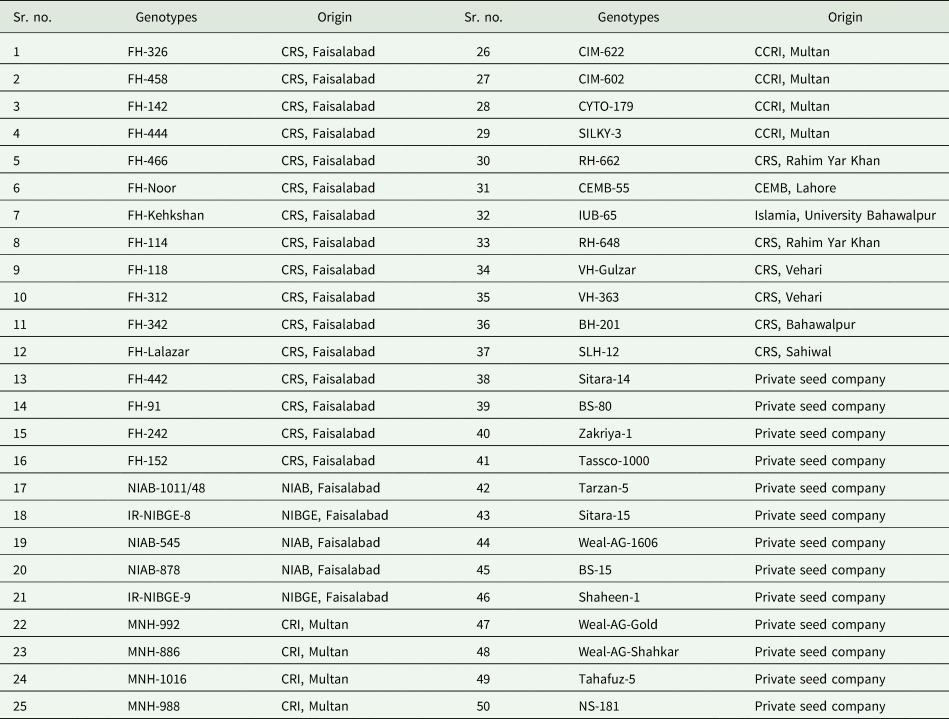
Fifty cotton genotypes were collected from various cotton research institutes/stations of Pakistan (Table 1). These cotton genotypes were highly diverse based on their growth habit as belonging to different climatic zones of Pakistan.
Name and origin of 50 cotton genotypes included in the study

CRS, Cotton Research Station; NIAB, Nuclear Institute for Agriculture and Biology; NIBGE, National Institute for Biotechnology and Genetic Engineering; CRI, Cotton Research Institute; CCRI, Central Cotton Research Institute; CRS, Cotton Research Station; CEMB, Centre for Excellence in Molecular Biology.
Experimental design
These cotton genotypes were evaluated following a split-split-plot design under field condition. Two years were considered as the main plot, two sowing time treatments were adjusted in sub-plot and genotypes were arranged in sub-sub plot. Fifty cotton genotypes were raised in a randomized complete block design (RCBD) with three replications in each sowing date. For both years, the experiment was conducted at Cotton Research Station, Faisalabad, Pakistan (longitude 73.1°E, latitude 31.43°N). The experimental unit for each genotype was a plot size of 3 × 5 m with a row to row and plant to plant distance at 75 and 30 cm, respectively. All recommended management practices were made throughout the season for commercial cotton production in Punjab, Pakistan. Fertilizers were applied to maintain crop nutrients including nitrogen (200 kg/ha), phosphorus (60 kg/ha) and potash (100 kg/ha). All the phosphorus and potash, and 1/4th of nitrogen were applied at bed preparation, whereas the remaining nitrogen splits into 1/4th after 30 days, 1/4th at flowering and 1/4th at peak boll formation. The experiment was sprayed adequately to control insect pests when required. Irrigations (3084 m3) were applied by flooding to eliminate the effect of drought especially at the time to start flowering and boll maturation period.
Treatments
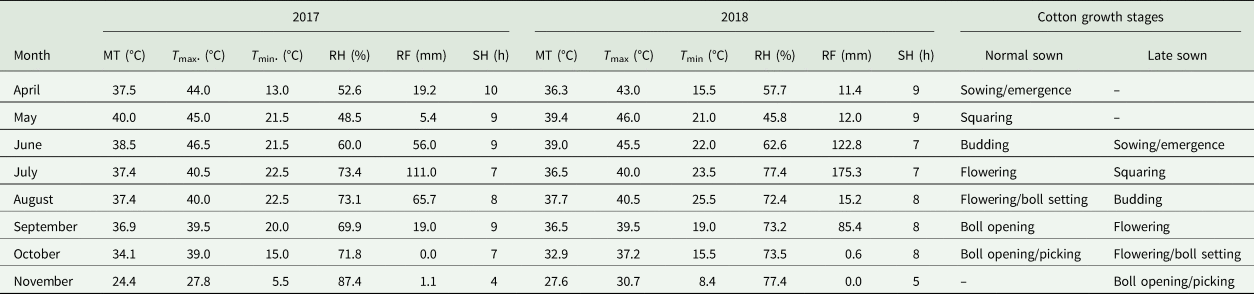
Two treatments were adjusted by variable sowing dates as normal sown (NS) and late sown (LS) during both years (2017 and 2018). The normal sowing was done on 15 April and LS on 6 June during both years. Mean max temperatures observed for early sown were 37.4 and 37°C for 2017 and 2018, respectively. For LS during 2017 and 2018, the mean max temperatures were 34.4 and 32.9°C, respectively. The peak flowering period was synchronized to high-temperature stress and optimum temperature under field conditions as customizing the dates of sowing in mid-April and the first week of June, respectively. Meteorological data for consecutive years (2017 and 2018) of the experiment were obtained from the observatory of Plant Physiology Section, Agronomic Research Institute, Faisalabad, Pakistan, which is situated at 400 m away from the experimental site (Table 2).
Monthly weather data and crop growth stage for early and late sown cotton at experimental site during 2017 and 2018

MT, mean temperature per month; T max, daily maximum temperature; T min, daily minimum temperature; RH, relative humidity percentage; RF, rainfall per month; SH, sunshine hours per month.
Measurements of agronomic and physiological traits
Data were recorded for relative cell injury percentage (RCI%), CC, canopy temperature (CT), BR, BP, boll weight (BW), hundred seed weight (HSW), sympodial branches per plant (SBP), plant height (PH) and SCY. Among all the traits, some were measured at peak flowering/reproductive phase involving RCI, CC and CT, whereas yield and yield-related attributes were measured at harvesting time.
Relative cell injury
RCI of cotton genotypes was measured after ~75–85 days of seedling emergence from the selected, fully expanded leaves (20–22 days older). Two leaf discs with a diameter of 10 mm per disc were punched from each leaf and ten discs were collected in each falcon tube set of control and heat-treated. Leaf discs were collected from the field at 13.00–15.00 h and placed in a test tube with 10 ml deionized water. Leaf discs were thoroughly rinsed with deionized water to remove the electrolytes both adhering to leaf discs and leaked from the cut surface. The falcon tubes (control set) containing leaf discs were filled with 20 ml deionized water and kept at room temperature for 24 h. The heat-treated set was incubated for 30 min at 50°C in a water bath. The deionized water (10 ml) was added in heat-treated set and kept at room temperature for 24 h to allow diffusion of electrolytes. On the next day, tubes were gently shaken for electrolytes mixing and initial electric conductivity (EC) was recorded with the help of EC meter (HANNA Instruments, HI-933300 conductivity meter, USA). Falcon tubes were autoclaved at 0.10 MPa to release all electrolytes in both sets. The falcon tubes were kept at room temperature and the final EC was measured with EC meter. RCI% was calculated using the following formula as proposed by Sullivan (Reference Sullivan, Rao and House1972).

T1, EC value of heat-treated set in water bath; T2, EC value of heat-treated set after autoclaving; C1, EC value of control set at room temperature; C2, EC value of control set after autoclaving.
Chlorophyll content
CC was measured with the help of hand-held chlorophyll content meter (CCM-200 Plus, USA). CC varies with the age and level of stress on leaves which are initially high and decreased with the progression of high-temperature stress. The measurements were recorded from five guarded plants of each genotype from each replication. Each measurement was taken from a fully expanded green leaf from the top, middle and bottom positions of the cotton plant during peak flowering at a PH of 80–90 cm.
Canopy temperature
CT has been recognized as such a trait that is used for the assessment of plants response under stress environments to distinguish genotypic differences. CT observations were recorded between 14.00 and 15.30 h, on a cloudless, bright day with the help of hand-held Infrared Thermometer (IR-880A, UK). CT measurements were taken at 0.5 m from the sides of the canopy and 50 cm above the canopy at an angle of 30–45°C for each genotype. For CT, three measurements were taken from the top, middle and bottom positions of the cotton plant. All the measurements for CT were made on the same day for both years.
Boll retention
The total number of bolls was counted on five central selected plants from each replication of each cotton genotype at maturity. Similarly, total numbers of flowers (fruiting sites or tagged flowers) per plant were counted and BR percentage was calculated by the following formula (Liu et al., Reference Liu, Yuan, Liu, Yu and Rao2006; Cottee et al., Reference Cottee, Tan, Bange, Cothren and Campbell2010; Lokhande and Reddy, Reference Lokhande and Reddy2014).

Yield and yield attributes
SCY and yield attributes (SBP, BP, BW, HSW and PH) were recorded at the final harvesting time. The SBP was designated as direct bolls bearing branches along the length of the mother shoot of the cotton plant. The number of branches was counted from five plants in each replication and their mean was calculated. The total number of picked bolls was counted from selected plants from each replication and their mean was calculated for each genotype. BW was calculated in grams from randomly picking off 50 bolls of selected plants in each replication and their total weight was divided into 50 bolls to calculate a single BW. HSW was taken by counting a hundred seeds from randomly selected samples of seeds of each replication and their replicated means were calculated in grams for each genotype. The height of the main stem was measured between the cotyledonary nodes to the apical bud when growth ceased. SCY of all genotypes was measured by picking all opened bolls from five central plants from each replication and weighed in grams on electronic balance separately and calculated SCY per plant.
Statistical analysis
The data of all traits were subjected to analysis of variance (ANOVA at probability values **P ≤ 0.01 and *P ≤ 0.05) for split-split plot design under RCBD with main factors, sub-factors and sub-sub factors years, treatments (sowing times) and genotypes, respectively (Steel et al., Reference Steel, Torrie and Dickey1997). Descriptive statistics for cotton genotypes were also calculated under different sowing times across years. The mean plots with standard errors for six selected cotton genotypes were also created for each sowing times and years using Microsoft excel. The correlation among various traits (Pearson, Reference Pearson1920) and heat map analysis of 50 cotton genotypes were also analysed using R 3.6.1 statistical package.
Results
Seasonal meteorological conditions during 2017 and 2018
Meteorological conditions during two consecutive years (2017 and 2018) have been found to be similar while seasonal variability was portrayed in Table 2. The seasonal mean maximum temperature was recorded around 24–40°C and the mean minimum temperature around 17.7–18.8°C during 2017 and 2018. The mean maximum temperature was around 38–39°C at the onset of the peak flowering period (June–July) for 15 April sown genotypes. The mean normal temperature remained 24–32°C at peak flowering period (October–November) of 6 June sown genotypes which was observed over two consecutive years (Table 2).
Assessment of genetic variation in cotton genotypes for high-temperature tolerance (2017 and 2018)
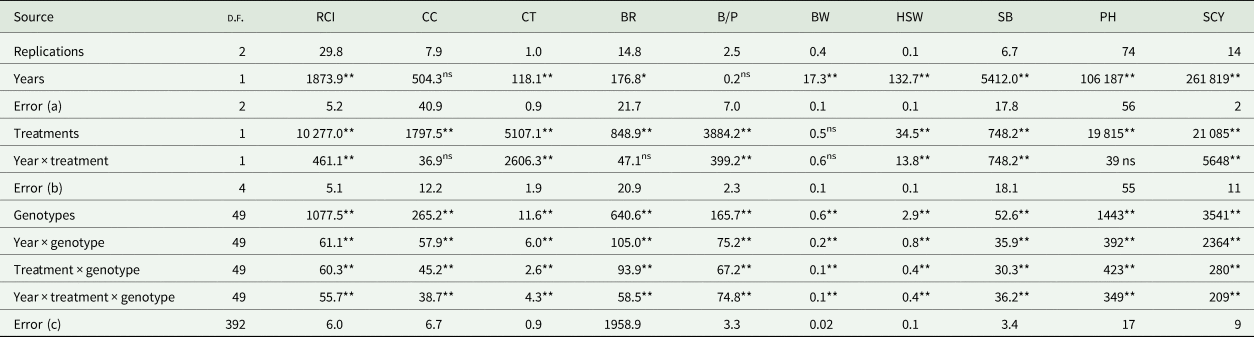
The present study was comprised of an extensive screening method for 50 cotton genotypes under different sowing dates (NS and LS) for two consecutive years (2017 and 2018). The screening was based on RCI%, CC, CT, BR, BP, BW, sympodial branches, HSW, PH and SCY. The ANOVA results described in Table 3 showed that there exist highly significant differences under both levels of significance (P < 0.01 and P < 0.05) among genotypes and treatments indicating that there could be potential for high-temperature tolerance among genotypes for all the traits. The year × genotype, treatment × genotype and year × treatment × genotype were significant for all traits, which imply that the genotypes performed differently for 2 years and treatments (Table 3). The detailed results of different agro-physiological traits regarding the performance of cotton genotypes under both treatments (NS and LS) are explained below.
Mean squares of different morpho-physiological traits of 50 cotton genotypes during 2017 and 2018

d.f., degree of freedom; RCI (%), relative cell injury percentage; CC, chlorophyll contents; CT, canopy temperature; BR (%), boll retention percentage; B/P, bolls per plant; BW, boll weight; HSW, hundred seed weight; SB, sympodial branches; PH, plant height; SCY, seed cotton yield.
**Significance at P ≤ 0.01.
Relative cell injury
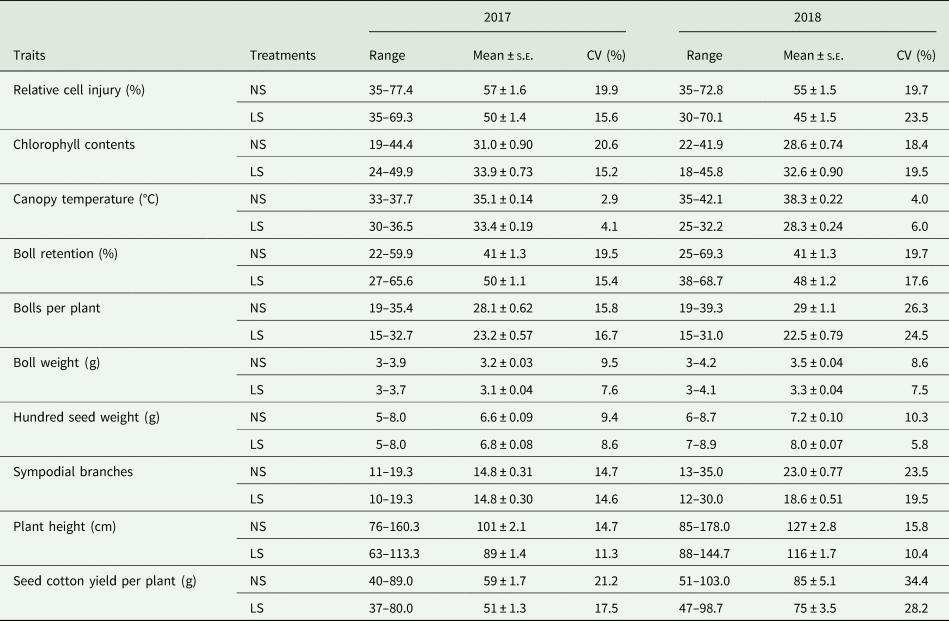
RCI showed a decreasing trend for all cotton genotypes under late sowing due to low air temperature, whereas overall higher cell injury was found in NS except tolerant genotypes. The range of RCI% was 35.7–77.4 and 35.2–72.8, mean (±s.e.) was 57 ± 1.6 and 55 ± 1.5 and CV (%) was 19. 9 and 19.7 for NS2017 and NS2018, respectively. The range of RCI% under LS2017 and LS2018 was 35.3–69.3 and 30.3–70.1, mean (±s.e.) was 50 ± 1.4 and 45 ± 1.5 and CV (%) was 15.6 and 23.5 for 2017 and 2018, respectively (Table 4).
Morpho-physiological assessment of cotton 50 genotypes under normal and late sown during 2017 and 2018

NS, normal sown (after 15 April); LS, late sown (1st week of June).
Chlorophyll content
NS cotton face discolouration/scorching of leave due to severe high-temperature stress at peak flowering time and showed decreased CC. The CC ranged from 18.6–44.4 to 22.1–41.9 μmol/m2, mean (±s.e.) was 31.0 ± 0.90 and 28.6 ± 0.74 and CV (%) was 20.6 and 18.4 for NS2017 and NS2018, respectively. Whereas the LS being optimum temperature showed high CC with range 24.4–49.9 and 18.3–45.8 μmol/m2, mean (±s.e.) was 33.9 ± 0.73 and 32.6 ± 0.90 and CV (%) was 15.2 and 19.5 during LS2017 and LS2018, respectively (Table 4). The higher CC criteria were considered as a high-temperature tolerance indicator.
Canopy temperature
CT (°C) was higher under normal sowing due to higher air temperature and affected canopy shape by shedding of plant parts as compared to the late sowing. Under NS2017 and NS2018, CT ranged from 33.2–37.7 to 35.0–42.1°C, mean (±s.e.) was 35.1 ± 0.14 and 38.3 ± 0.22 and CV (%) was 2.9 and 4.0, respectively. While the range was 29.9–36.5 and 25.1–32.2°C, mean (±s.e.) was 33.4 ± 0.19 and 28.3 ± 0.24 and CV (%) was 4.1 and 6.0 in LS2017 and LS2018, respectively (Table 4). The lowest CT was the selection criteria for high-temperature tolerance.
Boll retention
BR (%) was higher under LS due to optimum temperature, whereas under NS higher resultant genotypes were selected as tolerant for high-temperature stress. The range of boll retention under NS2017 and NS2018 was 22.1–59.9 and 24.7–69.3%, mean (±s.e.) was 41 ± 1.3 and 40.6 ± 1.3 and CV (%) was 19.5 and 19.7, respectively. Similarly, the LS2017 and LS2018 ranged from 27.3–65.6 to 37.7–68.7%, mean (±s.e.) was 50 ± 1.1 and 48.4 ± 1.2 and CV (%) was 15.4 and 17.6, respectively (Table 4).
Bolls per plant
BP increased under NS due to the indeterminate behaviour of cotton genotypes and lengthens the growing period of the crop. The LS genotypes revealed a lesser number of bolls because of the short growing period and very low temperature at the late vegetative phase-delayed squares formation. BP ranged from 19.3–35.4 to 19.0–39.3, mean (±s.e.) was 28.1 ± 0.62 and 29 ± 1.1 and CV (%) was 15.8 and 26.3 in NS2017 and NS2018, respectively. Whereas LS2017 and LS2018 ranged from 14.7–32.7 to 15.0–31.0, mean (±s.e.) was 23.2 ± 0.57 and 22.5 ± 0.79 and CV (%) was 16.7 and 24.5, respectively (Table 4).
Sympodial branches per plant
SBP was increased under NS as compared to LS during both years of study (2017 and 2018). SBP ranged from 10.7–19.3 to 12.7–35.0, mean (±s.e.) was 14.7 ± 0.31 and 23.0 ± 0.77 and CV (%) was 14.7 and 23.5 in NS2017 and NS2018, respectively. Under LS2017 and NS2018, the range of SBP was 310.3–19.3 and 12.0–30.0, mean (±s.e.) was 14.8 ± 0.30 and 18.6 ± 0.51 and CV (%) was 14.6 and 19.5 in 2017 and 2018, respectively, for SBP (Table 4).
Plant height
PH was increased under NS in all-cotton genotypes because of the extended period for vegetative growth as compared to LS in consecutive years of study. Under NS2017 and NS2018, PH ranged from 76.0–160.3 to 85.0–178.0 cm, mean (±s.e.) was 101 ± 2.1 and 127 ± 2.8 and CV (%) was 14.7 and 15.8, respectively. The range of PH was 62.7–113.3 and 88.3–144.7 cm, mean (±s.e.) was 89 ± 1.4 and 116 ± 1.7 and CV (%) was 11.3 and 10.4 for LS2017 and LS2018, respectively (Table 4).
Boll weight
BW displayed higher results under NS and ranged from 2.6–3.9 to 3.1–4.2 g, mean (±s.e.) was 3.2 ± 0.03 and 3.47 ± 0.041 and CV (%) was 9.5 and 8.6 for NS2017 and NS2018, respectively. While for LS2017 and LS2017 it ranged from 2.6–3.7 to 2.9–4.1 g, mean (±s.e.) was 3.1 ± 0.04 and 3.3 ± 0.04 and CV (%) was 7.6 and 7.5, respectively (Table 4).
Hundred seed weight
HSW (g) decreased under NS as compared to LS, the range of HSW was 5.2–8.0 and 5.7–8.7 g, mean (±s.e.) was 6.6 ± 0.09 and 7.2 ± 0.10 and CV (%) was 9.4 and 10.3 in NS2017 and NS2018, respectively. Under LS2017 and LS2018, the range was 5.3–8.0 and 7.0–8.9 g, mean (±s.e.) was 6.8 ± 0.08 and 8.0 ± 0.07 and CV (%) was 8.6 and 5.8, respectively, for HSW (Table 4).
Seed cotton yield
SCY per plant (g) showed increasing trends because of the extended reproductive phase of NS genotypes, whereas decreasing trend was observed under LS due to post seasonal very low temperature and limited reproductive phase. SCY under NS2017 and NS2018 ranged from 39.9–89.0 to 51.0–103.0 g, mean (±s.e.) was 59 ± 1.7 and 85 ± 5.1 and CV (%) was 21.2 and 44.4, respectively. Under LS2017 and LS2018, the range was 36.9–80.0 and 47.2–98.7 g, mean (±s.e.) was 51 ± 1.3 and 75 ± 3.5 and CV (%) was 17.5 and 28.2, respectively (Table 4).
Heat map analysis based on mean values for agro-physiological traits
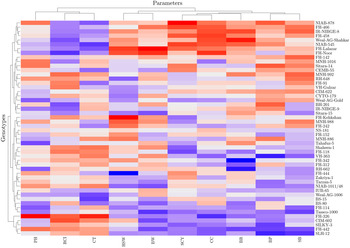
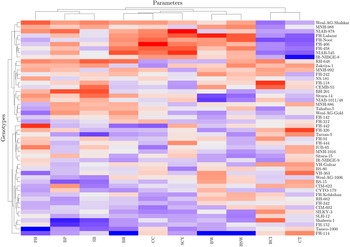
Heat map analysis for NS2017 classified 50 cotton genotypes into four clusters on the base of ten agro-physiological traits (Fig. 1). The eight cotton genotypes viz., NIAB-878, FH-466, IR-NIBGE-8, FH-458, Weal-AG-Shahkar, NIAB-545, FH-Lalazar and FH-Noor were identified as high-temperature-tolerant and attaining higher values for CC, BR, BP, BW, HSW, SBP, PH and SCY except for RCI and CT. Under LS2017, heat map analysis again classified the cotton genotypes into four clusters on the base of ten agro-physiological traits (Fig. 2). The nine cotton Weal-AG-Shahkar, MNH-988, NIAB-878, FH-Lalazar, FH-Noor, FH-466, FH-458, NIAB-545 and IR-NIBGE-8 were present in cluster-1. These genotypes were identified as high-temperature-tolerant due to attaining higher values for all agro-physiological except RCI% and CT.
Heat map analysis based on mean values of agro-physiological traits for normal sown cotton in 2017 (NS2017). PH, plant height; RCI, relative cell injury percentage; CT, canopy temperature; HSW, hundred seed weight; BW, boll weight; SCY, seed cotton yield; CC, chlorophyll contents; BR, boll retention percentage; B/P, bolls per plant; SB, sympodial branches.

Heat map analysis based on mean values of agro-physiological traits for late sown cotton in 2017 (LS2017). PH, plant height; RCI, relative cell injury percentage; CT, canopy temperature; HSW, hundred seed weight; BW, boll weight; SCY, seed cotton yield; CC, chlorophyll contents; BR, boll retention percentage; B/P, bolls per plant; SB, sympodial branches.

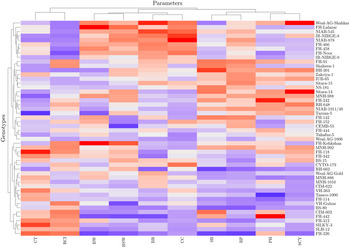
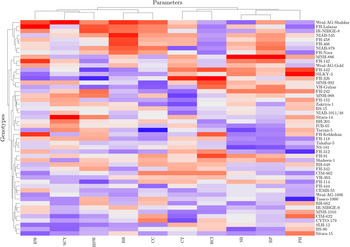
The heat map analysis under NS2018 classified the cotton genotypes into six major clusters (Fig. 3). The ten cotton genotypes falling in cluster-1 were Weal-AG-Shahkar, FH-Lalazar, NIAB-545, IR-NIBGE-8, NIAB-878, FH-466, FH-458, FH-Noor, IR-NIBGE-9 and FH-91. These genotypes were identified as high-temperature-tolerant as they attained higher values for all agro-physiological and lower mean values for RCI% and CT. For LS2018, the heat map analysis classified cotton genotypes into four major clusters (Fig. 4). Weal-AG-Shahkar, FH-Lalazar, IR-NIBGE-8, NIAB-545, FH-458, FH-466, NIAB-878 and FH-Noor were classified in cluster-1. These cotton genotypes attained higher mean values for all studied traits except RCI and CT. These genotypes were identified as high-temperature-tolerant.
Heat map analysis based on mean values of agro-physiological traits for normal sown cotton in 2018 (NS2018). PH, plant height; RCI, relative cell injury percentage; CT, canopy temperature; HSW, hundred seed weight; BW, boll weight; SCY, seed cotton yield; CC, chlorophyll contents; BR, boll retention percentage; B/P, bolls per plant; SB, sympodial branches.

Heat map analysis based on mean values of agro-physiological traits for late sown cotton in 2018 (LS2018). PH, plant height; RCI, relative cell injury percentage; CT, canopy temperature; HSW, hundred seed weight; BW, boll weight; SCY, seed cotton yield; CC, chlorophyll contents; BR, boll retention percentage; B/P, bolls per plant; SB, sympodial branches.

Correlation among various traits under normal and late sown conditions during 2017 and 2018
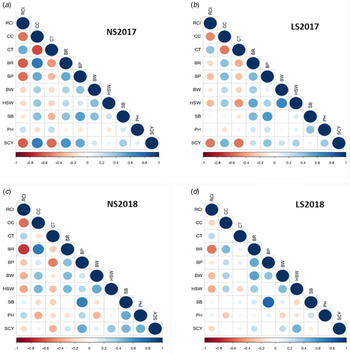
Correlations were studied among all traits under LS and NS conditions during consecutive years of 2017 and 2018. Under NS2017, BW had a significant positive correlation with BR, CC, BP, SBP and HSW. Similarly, CC revealed a significant positive correlation with BR, BP, SBP, HSW and SCY, whereas it correlated negatively with CT and RCI. CT had a significant negative correlation with BR, BP, SBP and SCY; although, it showed a significant positive correlation with RCI. BP significantly and positively correlated with BR, SBP, HSW and SCY, whereas it correlated negatively with RCI. A significant positive correlation was observed between BR and SCY. SCY correlated positively with SBP and negatively with RCI (Fig. 5(a)).
Correlation coefficient among various traits in 50 cotton genotypes under: (a) normal sowing during 2017 (NS2017), (b) late sowing 2017 (LS2017), (c) normal sowing during 2018 (NS2018) and (d) late sowing 2018 (LS 2018). RCI, relative cell injury percentage; CC, chlorophyll contents; CT, canopy temperature; BR, boll retention percentage; B/P, bolls per plant; BW, boll weight; HSW, hundred seed weight; SB, sympodial branches; PH, plant height; SCY, seed cotton yield.

Similarly, under LS2017, BW had a positive significant correlation with BR and HSW. CC was correlated positively with BR, BP, HSW and SCY and negatively with CT and RCI. CT had a negative correlation with BR, BP, HSW and SCY; whilst it correlated positively with RCI. A positive association was also recorded for PH with SBP and SCY. RCI showed a significant negative correlation with HSW and SCY. SBP also revealed a positive correlation with BR. HSW was positively correlated with BR and SCY. HSW and SCY were correlated positively with each other under LS2017 (Fig. 5(b)).
Under NS2018, BW was correlated positively with BR, CC and HSW and it showed a negative correlation with PH and RCI. The CC had a positive significant correlation with BR and HSW and a significantly negative correlation with PH and RCI. CT showed a positive significant correlation with RCI, whilst it correlated negatively with PH, HSW and SCY. BP revealed a significant positive correlation with BR, PH, SBP, HSW and SCY. PH had a significant positive correlation with RCI, SBP and SCY. RCI showed a significant negative correlation between BR and HSW. SBP had a positive significant correlation with SCY. HSW and SCY had a positive significant correlation with each other (Fig. 5(c)).
Under LS2018, BR showed a positive correlation with BP and BW. BP revealed a significant positive correlation for BR and SBP. RCI showed a significant negative correlation for BR and HSW under LS2018. HSW had a positive significant correlation with SCY and BR under LS2018sssss (Fig. 5(d)).
Discussion
Cotton cultivation has been found to be adversely affected by high-temperature stress (>36°C) at the peak flowering/reproductive phase. The variable sowing dates methodology under field conditions was adopted to synchronize the peak flowering stage with variable temperature regimes to screen out a set of diverse cotton genotypes. Furthermore, this study helped to evaluate the effect of high temperature on the morphological and physiological mechanisms that are being used in the screening of cotton germplasm (Reddy et al., Reference Reddy, Doma, Mearns, Boone, Hodges, Richardson and Kakani2002; Rahman, Reference Rahman2006; Zahid et al., Reference Zahid, Ali, Shah, Younas, Shah, Shahwar, Hassan, Ahmad, Qi, Lu and Iqbal2016). When temperature elevation (>32°C) was observed in the present study at reproductive phase, flowers, bolls and yield components reduced rapidly and decreased economic yield, similar to the observations in other studies (Hodges et al., Reference Hodges, Reddy, McKinion and Reddy1993; Brown, Reference Brown2008).
At the cellular level, membrane leakage was measured by the mechanism of RCI which significantly differentiates cotton genotypes and determined the improvement liability among selected cultivars. RCI% was found to be high during NS of cotton genotypes under high temperature (38–39°C) at the peak flowering time than optimum temperature (18–31°C) for the reproductive stage (Table 4). High temperature caused injury to the membranes of the chloroplast that reduce CO2 assimilation and inhibit photosynthesis. Similarly, CC also damaged under high-temperature stress and findings of the present study revealed NS of cotton genotypes usually synchronized the reproductive phase with high temperature which directly affected these physiological mechanisms (Bibi et al., Reference Bibi, Oosterhuis and Gonias2008). The best results of selected tolerant genotypes for RCI and CC were considered as a reliable and rapid screening tool for indirect selection at younger stage against high-temperature stress (Rahman et al., Reference Rahman, Malik and Saleem2004; Cottee et al., Reference Cottee, Tan, Bange, Cothren and Campbell2010; Salman et al., Reference Salman, Khan, Rana, Maqsood and Azhar2016). Among selected tolerant genotypes, FH-Noor and NIAB-545 showed lower RCI and higher CC under NS as high-temperature stress during consecutive years of study. CT recognized the significant genotypic differences under high-temperature stress and applied for selecting tolerant genotypes under high-temperature stress that had been used in several studies against abiotic stresses (Wanjura et al., Reference Wanjura, Maas, Winslow and Upchurch2004; Mohammadi et al., Reference Mohammadi, Karimizadeh, Sabaghnia and Shefazadeh2012; Khan et al., Reference Khan, Azhar, Khan and Ahmad2014; Purushothaman and Krishnamurthy, Reference Purushothaman and Krishnamurthy2014). Similarly, NS time synchronized the reproductive phase with high-temperature stress and the selected genotypes, NIAB-545 and NIAB-878, revealed lower CT being tolerant during 2017 and 2018.
Boll retention was reduced under NS at peak flowering period and increased shedding of unfertilized flowers and squares due to higher temperature stress, whereas the success of fertilization and flower retention depends upon the optimum range of temperature. An amplitude of temperature (38–39°C) may decrease pollen viability and drop-down unfertilized flowers which ultimately reduced the percentage of bolls in NS of each genotype as compared to the LS under optimum temperature (24–32°C) at peak reproductive phase (Reddy et al., Reference Reddy, Hodges and McKonion1993; Liakatas et al., Reference Liakatas, Roussopoulos and Whittington1998; Kakani et al., Reference Kakani, Reddy, Koti, Wallace, Prasad, Reddy and Zhao2005; Liu et al., Reference Liu, Yuan, Liu, Yu and Rao2006; Lokhande and Reddy, Reference Lokhande and Reddy2014; Tariq et al., Reference Tariq, Yasmeen, Ahmad, Hussain, Afzal and Hasanuzzaman2017; Singh et al., Reference Singh, Wijewardana, Gajanayake, Lokhande, Wallace, Jones and Reddy2018). The results for BR under NS of NIAB-545 and FH-458 mitigated the effects of high-temperature stress during both years of study (2017 and 2018).
Phenology of cotton observed an indeterminate pattern of growth habit that may continue their vegetative and reproductive phase side by side till the same harvesting time for both NS and LS under varying degree of temperatures (Liu et al., Reference Liu, Yuan, Liu, Yu and Rao2006; Iqbal et al., Reference Iqbal, Ul-Allah, Naeem, Hussain, Ijaz, Wasaya and Ahmad2018). The high temperature under NS at pre-harvest stages caused considerable damage for yield attributes including bolls, sympodial branches, stem apical parts and leaves discolouration which may significantly reduce final crop yield (Wahid et al., Reference Wahid, Gelani, Ashraf and Foolad2007; Lokhande and Reddy, Reference Lokhande and Reddy2014). Whereas, NS took a maximum growth period than LS and usually contained a greater number of bolls, SBP and PH although being exposed to high-temperature stress. The tolerant genotypes NIAB-878, NIAB-545 and FH-458 revealed superior results among the six selected genotypes for BP, SBP and PH during both years of study.
BW being important yield components significantly increased under NS than LS during consecutive years of the experiment. BW was found to be increased under NS as early studies reported that varying degree of high temperature stimulated high assimilates transport and transfer process in various parts of the plant (Taiz and Zeiger, Reference Taiz and Zeiger2006). Whereas, present findings in contrary to Lokhande and Reddy (Reference Lokhande and Reddy2014) in which increased boll maturation rate under NS was inversely proportional to boll maturation period under high temperature and produced small bolls led to enforced boll opening. HSW during NS decreased under high-temperature stress as reported in the earlier studies of Lokhande and Reddy (Reference Lokhande and Reddy2014). Whereas six selected tolerant genotypes relatively showed higher HSW under NS. The genotypes FH-466, FH-Lalazar and NIAB-545 revealed the best results for temperature tolerance both for BW and HSW under NS during 2017 and 2018.
SCY under NS was higher than LS during the two years of consecutive study. The reason for high SCY during NS was the gain of a maximum growth period for vegetative and reproductive phase than LS, while both treatments harvested at the same time. A very lower temperature (<20°C) causes hindrance in sink source relationship that led to the decline of assimilates transport that delayed squaring, flowering and plant contained immature/unopened bolls which ultimately dropped-down SCY in LS (Taiz and Zeiger, Reference Taiz and Zeiger2006; Saleem et al., Reference Saleem, Bilal, Anjum, Khan, Sarwar and Farhad2014). The observations recorded for SCY under NS were considered the best for the selection of six tolerant genotypes under high-temperature stress conditions. The genotype NIAB-545 followed by FH-458 resulted in high SCY among the selected tolerant genotypes under NS during 2017 and 2018.
SCY and yield-related traits were considered as the selection criteria under elevated temperature. Correlation analysis revealed a significant association among different traits that were evaluated to identify thermo-tolerant genotypes. Among morphological traits, SYC had a significantly positive correlation with BP, SB under NS2017 and NS2018. In our study, CT was negatively associated with SCY, due to higher boll shedding which was also depicted by a negative association between SCY and BP. SCY had a significant positive correlation with BR in 2017 along with PH and HSW in 2018. BP and BR revealed a strong positive correlation between one another because of pollen viability, fertilization and ultimately flower drop under varying temperature regimes (Liu et al., Reference Liu, Yuan, Liu, Yu and Rao2006; Snider et al., Reference Snider, Oosterhuis, Skulman and Kawakami2009; Singh et al., Reference Singh, Wijewardana, Gajanayake, Lokhande, Wallace, Jones and Reddy2018). SCY was also found to show a positive correlation with CC as reported by Demirel et al. (Reference Demirel, Copur and Gur2016) because higher photosynthetic efficiency contributed positively towards yield. Whereas negative association was observed between CC and RCI as increasing temperature caused damage to chloroplast cells with higher RCI (Bibi et al., Reference Bibi, Oosterhuis and Gonias2008; Karademir et al., Reference Karademir, Karademir, Ekinci, Basbag and Basal2012; Abro et al., Reference Abro, Rajput, Khan, Sial and Tahir2015). Heat stress increased RCI and further added accompanied by a positive correlation of CT. Similarly, selection based on good correlation for physiological traits (RCI and CC) may be separately operated for trait improvement which indirectly contributed to SCY.
Conclusion
The present study established the screening strategy for high-temperature tolerance in cotton genotypes of Pakistan origin. It was evident that the occurrence of high-temperature stress in the month of June–July synchronized with the peak reproductive phase of NS cotton genotypes which may affect the final SCY. RCI, CC, CT and BR promoted screening at seedlings to flowering stages. While, BP, BW, SBP and PH can be used as direct selection criteria for SCY under high-temperature stress. Among six selected genotypes the most reliable genotypes, FH-Noor, FH-Lalazar, NIAB-545 and NIAB-878, displayed high-temperature tolerance for all the studied traits and could be propagated through various breeding techniques in future climate resilience challenges.
Financial support
The authors would like to acknowledge the Higher Education Commission of Pakistan for providing the financial support to conduct this research under the grant number 518-82240-2AV5-112 (50042870).
Conflict of interest
None.
Ethical standards
Not applicable.