Lactobacillus strains are found in many different ecological niches, including human oral cavity, vagina and the gastrointestinal tract. Lactobacilli have been used in human nutrition for centuries, and are generally regarded as safe (GRAS status). Their usage in preparation or conservation during production of foods such as yogurt, cheese, meat (Stiles & Holzapfel, Reference Stiles and Holzapfel1997; Carr et al. Reference Carr, Chill and Maida2002) is indispensable.
In addition to the usage in food production, the exploration of the potential of different lactic acid bacteria (LAB) strains to modulate the immune system has become the centre of attention.
So far many different attempts at amelioration of pathological conditions with LAB have been tested. Among these conditions are diarrhoea, gastroenteritis, irritable bowel syndrome, inflammatory bowel disease, cancer, infant allergies, failure-to-thrive, hyperlipidemia, hepatic disease, Helicobacter pylori infections, genitourinary tract infections etc. (Brown & Valiere, Reference Brown and Valiere2004). In order to increase the chances of predicting the success of a certain LAB strain in a certain pathological condition it is firstly of interest to analyse the immunological effects in non pathological conditions.
The genus lactobacillus is comprised of many different species and even more individual strains which have different properties, both metabolic and structural (Lebeer et al. Reference Lebeer, Vanderleyden and De Keersmaecker2008). These differences between individual species and strains are also apparent in differences they exert upon interaction with the mamallian immune system (Dogi & Perdigón, Reference Dogi and Perdigón2006; Díaz-Ropero et al. Reference Díaz-Ropero, Martín, Sierra, Lara-Villoslada, Rodríguez, Xaus and Olivares2007; D'Arienzo et al. Reference D'Arienzo, Bozzella, Rossi, De Bellis, Lavermicocca and Sisto2011; de Roock et al. Reference de Roock, van Elk, Hoekstra, Prakken, Rijkers and de Kleer2011; Dong et al. Reference Dong, Rowland and Yaqoob2012; Takeda et al. Reference Takeda, Kawahara, Hidaka, Yoshida, Watanabe, Takeshita, Kikuchi, Bumbein, Muguruma and Kurokawa2013).
This concept is somewhat logical since LAB are composed of many different immunostimulatory molecules, such as DNA, RNA, lipoteichoic acid (LTA), peptidoglycan (PGN), bacterial proteins with conserved motifs, lipoproteins, polysaccharides, exo-polysaccharides, products of bacterial metabolism, bacteriocins (Lebeer et al. Reference Lebeer, Vanderleyden and De Keersmaecker2008) etc. The individual components can have different, and even opposite effects on the immune system. These polymeric molecules are recognised by different molecules which are part of the innate immune system, called pattern recognition receptors (PRR). Although associated with pathogen recognition these molecules recognise polymeric molecules that exist in commensal bacteria as well. PRRs as part of the innate immune system are able to trigger defence response in case of danger, or initiate and guide the adaptive immune response in the appropriate direction.
The influence of individual bacterial components are clearly illustrated in gene deletion studies, where different mutants express different immunomodulatory activity (Grangette et al. Reference Grangette, Nutten, Palumbo, Morath, Hermann, Dewulf, Pot, Hartung, Hols and Mercenier2005; Bove et al. Reference Bove, Gallone, Russo, Capozzi, Albenzio, Spano and Fiocco2012), which stresses the differences between individual LAB strains.
The goal of this study was to test the effect Lactobacillus rhamnosus LA68 exerts on the immune system of healthy C57BL/6 mice in the absence of an underlying pathological condition. We sought to determine whether oral application is sufficient to induce any changes in splenocyte population composition, the quality of the changes and whether this results in differences in the magnitude of splenocyte proliferation and/or cytokine secretion (IFN-γ, IL-6, IL-10 and IL-17) upon stimulation with lipopolysaccharide (LPS) and PGN. In order to determine additional systemic changes cytokine levels in the serum were also analysed.
Methods
Bacterial strains and culture conditions
Lb. rhamnosus, strain LA68 (Institute of Virology, Vaccines and Sera, ‘Torlak’, Serbia) was propagated in MRS medium (‘Torlak’, Serbia) at 37 °C without agitation. For CFU counting bacteria were grown on MRS plates, solidified with 15 g/l agar. Bacterial preparation for feeding was done daily, before administration, by centrifugation (3000 g, 20 min, 4 °C) of the overnight culture. The bacterial pellet was dissolved in a 50× smaller volume of PBS, and washed once. The number of live bacteria was 2×10⁹ per dose, and in order to maintain constant bacterial numbers the bacterial preparation was always diluted in such a way to get optical density of 0·25 (610 nm; of a 100 times diluted preparation in a total of 200 μl PBS).
Experimental protocol for animal tests
Eight week old female C57BL/6 mice were purchased from Military Medicine Academy (VMA, Belgrade, Serbia), divided into two groups of six animals, kept in individual ventilated cages, and fed with standard food and water ad libitum in a pathogen-free animal house. Humidity, temperature and light/dark cycles were maintained at 55±5 %, 21±2 °C and 12/12 h, respectively. All experiments were approved by the Ethics Committee for the welfare of experimental animals, at the Institute of Virology, Vaccines and Sera in Torlak, Serbia, and conformed to Serbian laws and European regulations on animal welfare (Approval No. 011-00-00510/2011-05/4). Mice were given either 2×10⁹Lb. rhamnosus strain LA 68 in 200 μl PBS (group LA 68), or only PBS (Age control) via oral gavage four times per week for the duration of one month. At day 30 samples of peripheral blood were collected. Serum samples were collected and stored at −80 °C. The mice were euthanised by cervical dislocation, spleens were removed and splenocytes were immediately isolated.
Splenocyte isolation, stimulation experiments and cytokine determination
At the end of the experimental procedure mouse spleens were aseptically isolated, trimmed of all excess tissue and placed in 5 ml sterile complete RPMI 1640 (Sigma-Aldrich) supplemented with 10 % foetal calf serum (FCS)/RPMI 1640. Cell suspension was passed through sterile steel mesh to remove large particles and subsequently centrifuged at 400 g (SIGMA 3K18, Sigma Laboratory Centrifuges GmbH) to yield a pellet. Suspensions were erythrocyte-depleted by incubation (15 s) in sterile redistilled water (4 ml) before the addition of 0·3 M NaCl/5 % FCS/RPMI 1640 (4 ml). After centrifugation at 400 g (10 min), splenocytes were resuspended in 10 % FCS/RPMI 1640. The viability of such cell preparations was determined by trypan blue exclusion and exceeded 95 %. Cells were counted and finally diluted in 10 % FCS/50 μm β-mercaptoethanol/ complete RPMI 1640 to a concentration of 1×10⁶ cells/ml. Splenocytes (1×10⁶ cells/ml) were stimulated in vitro during incubation (37 °C, 5 % CO2: 48 h) with either 10 μg/ml lipopolysaccharide (LPS) (Lipopolysaccharides from Salmonella minnesota, Sigma- Aldrich) or 10 μg/ml PGN (Peptidoglycan from Staphylococcus aureus, BioChemika, Fluka). The cells were removed, and supernatants were collected and stored at −80 °C.
For cytokine determination MaxiSorp plates (Nunc A/S, Denmark) were used. Standards and antibody pairs were all obtained from Biolegend (San Diego, CA) and used according to the manufacturer's recommendations. Capture antibody was applied in 50 μl 0·1 M sodium carbonate buffer (pH 9·6) overnight at 4 °C. Blocking was done with PBS/2 % BSA (1 h, 37 °C). dilutions were made in PBS containing 1 % BSA. The supernatants were tested undiluted, and mice sera was diluted 5 times and incubated 1 h at 37 °C. Biotinylated detection antibodies were used with streptavidin peroxidase (Biolegend, San Diego, CA) and ortho-phenylendiamin as the substrate, and the signal was measured using a spectrophotometer (Ascent 6-384 [Suomi], MTX Lab Systems Inc., Vienna, VA 22182, USA).
MTT assay
Splenocytes (1×10⁶ cells/ml) were stimulated in vitro during incubation (37 °C, 5 % CO2: 48 h) with either 10 μg LPS/ml or 10 μg PGN/ml.
After the incubation period cell proliferation was measured with 3-(4,5-dimethylthiazol-2-yl)-2,5-diphenyltetrazolium bromide (MTT) (Mosmann, Reference Mosmann1983). The plates with cell cultures were centrifuged (400 g, 10 min) and the supernatants decanted. RPMI without phenol red containing 500 μg MTT/ml (Sigma-Aldrich) was added to the experimental wells (100 μl/well) and the cells were incubated (37 °C, 5 % CO2: 4 h). Insoluble crystals were dissolved by the addition of 10 % SDS/10 mM HCl (100 μl/well). After overnight incubation at 37 °C, absorbances were measured at 580 nm (A580) using a spectrophotometer.
Flow cytometry
Leucocyte populations from the spleen were analysed with FACScan (Becton Dickinson, Mountain View, CA, USA). Twelve-week-old female C57BL/6 mice were killed humanely, their spleen cells were isolated and a spleen cell suspension was diluted in 2 % BSA in PBS with 0·1 % sodium azide to 1×10⁶ cells/ml. In order to reduce unspecific binding cell pellet was incubated for 10 min with 10 μl normal mouse serum. Antibodies used were directed against CD3ε (145-2C11 Hamster IgG FITC), NK-cells (PK136 Mouse IgG2a PE), CD19 (PeCa1 Rat IgG2a PE), CD25 (PC61·5·3 Rat IgG1 FITC), CD11b (M1/70·15 Rat IgG2b FITC) and CD32/16 (DaBe4 Rat IgG2b PE). All antibodies were purchased from Immunotools (Immunotools, Friesoythe, Germany), and were used at an amount of 4 μl per million cells. After incubation (20 min, 4 °C, dark) 1 ml 2 % BSA in PBS with 0·1 % sodium azide was added, vortexed and centrifuged at 400 g for 10 min, this step was repeated twice and the signal was analysed.
Statistical analysis
Statistical analysis of flow cytometry data and cytokine measurement data was performed on data obtained from three biological replicates from each group (each replicate pooled from two mice spleens) using two sample T-test. P<0·05 was considered significant. Statistical analysis of serum cytokine levels was done on 6 mice sera per group with use of two sample T-test. Statistical analysis of splenocyte stimulation data was done by calculating proliferation indexes (obtained by dividing the absorbance of stimulated samples with the absorbance of the same cell sample left unstimulated) for two biological replicates from both experimental groups (each replicate composed of pooled splenocytes from two different mice), with use of two sample T-test. P<0·05 was considered significant.
Results
Leucocyte population differences
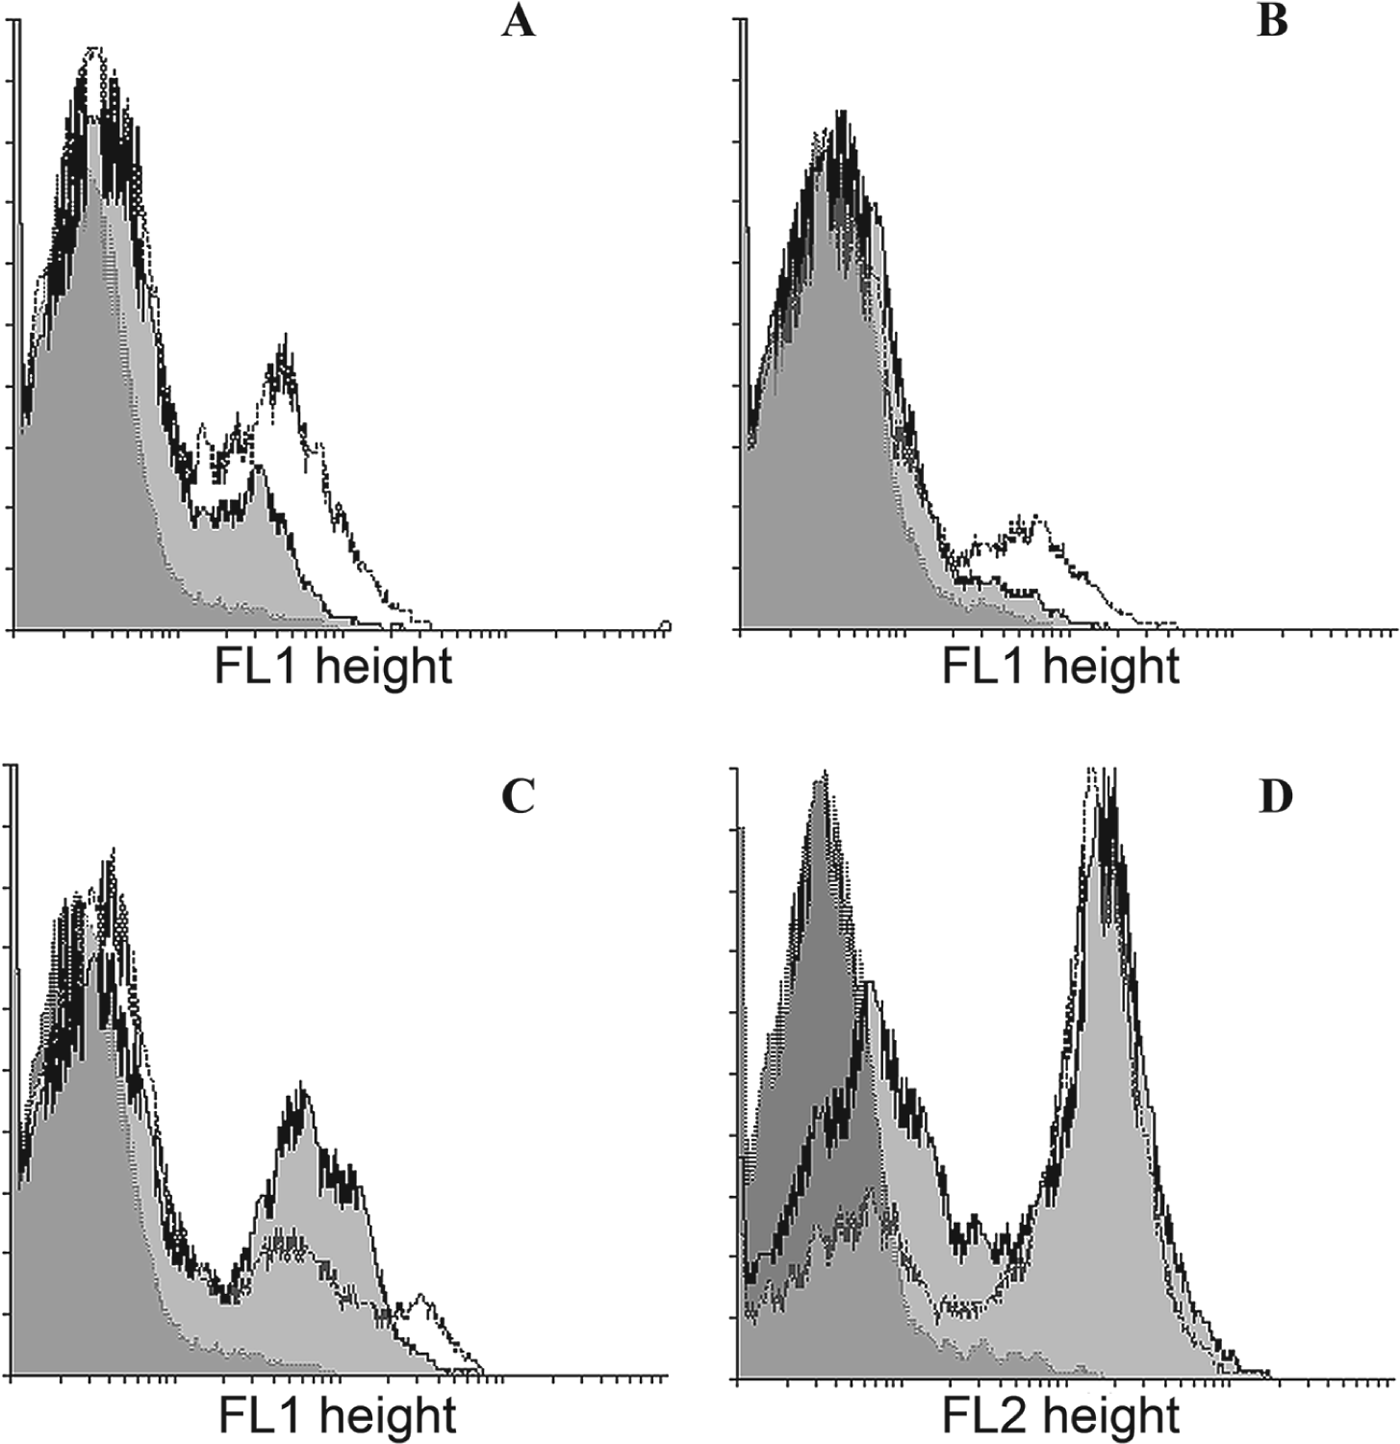
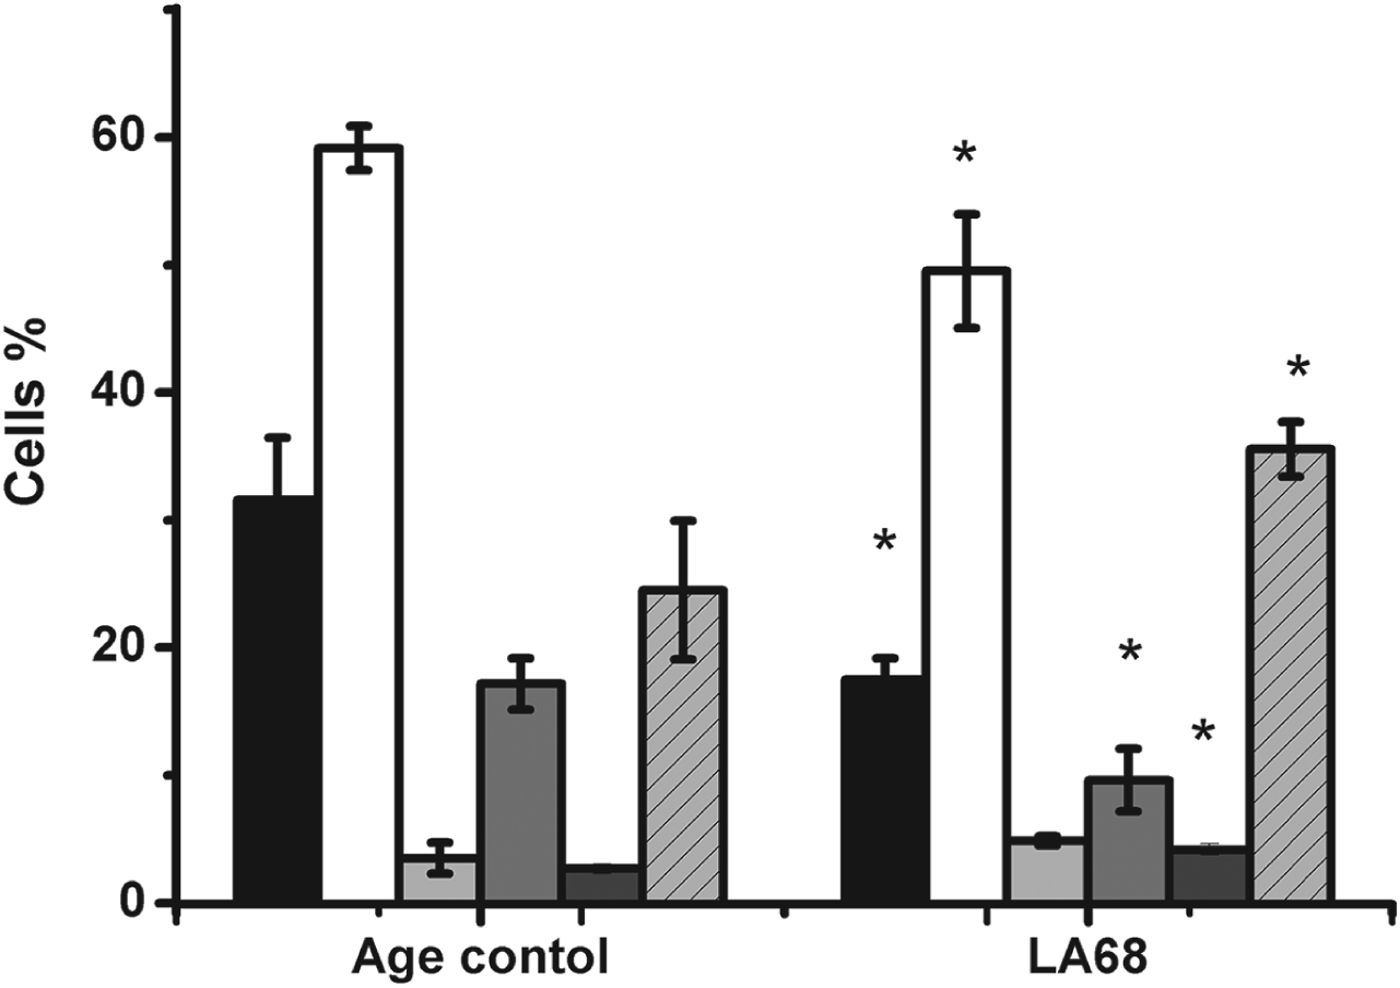
Splenocyte isolation procedure yielded similar amount of cells in both mouse groups, and the spleens were not enlarged. Different cell populations analysed included CD3+ cells or total T cells, CD19+ cells or B cells (except plasma cells), NK cells specific for C57BL/6 natural killer cells (Immunotools), CD25+ cells, or activated T and B cells, CD16/32 or FcγRIII/FcγRII positive cells and CD11b or CR3 positive cells. Oral administration of Lb. rhamnosus LA68 leads to a decrease of CD3+, CD25+ and CD19+ cells, and an increase in CD11b+, Fig. 1. and CD16/32 positive cells (overlay histogram not shown). CD11b+ cells also show differences in staining density, as in the age control group there is a small population of densely stained cells, which is absent from the treated LA68 group (Fig. 1). No statistically significant difference was found for NK-cells (Fig. 2).
Superimposed histograms showing flow cytometry detection of different leucocyte population abundance in the spleens of 12 week old female C57BL/6 mice upon feeding with Lb. rhamnosus LA68. Grey – unstained age control; Light grey – splenocytes from mice fed with LA68 for one month; white – age control. (A) CD3, T cell marker; (B) CD25, marker of activated T cells; (C) CD11b marker of granulocyte/monocyte lineage; (D) CD19, marker of B cells. Overlay histograms are created using Flowing Software version 2.5.0 (Turku Centre for Biotechnology, University of Turku, Finland).

Differences in spleen leucocyte population abundance upon feeding with Lb. rhamnosus LA68 strain. The data represent mean values ±SD from three biological replicates, each made by pooling samples from two mice. Statistical significance was determined with use of two sample T-test. * corresponds to P<0·05. Black bars – CD3+ cells; white bars – CD19+ cells; light grey – NK cells; grey bars – CD25+ cells; dark grey – CD16/32+ cells; light grey bars with lines – CD11b+ cells.
MTT assay
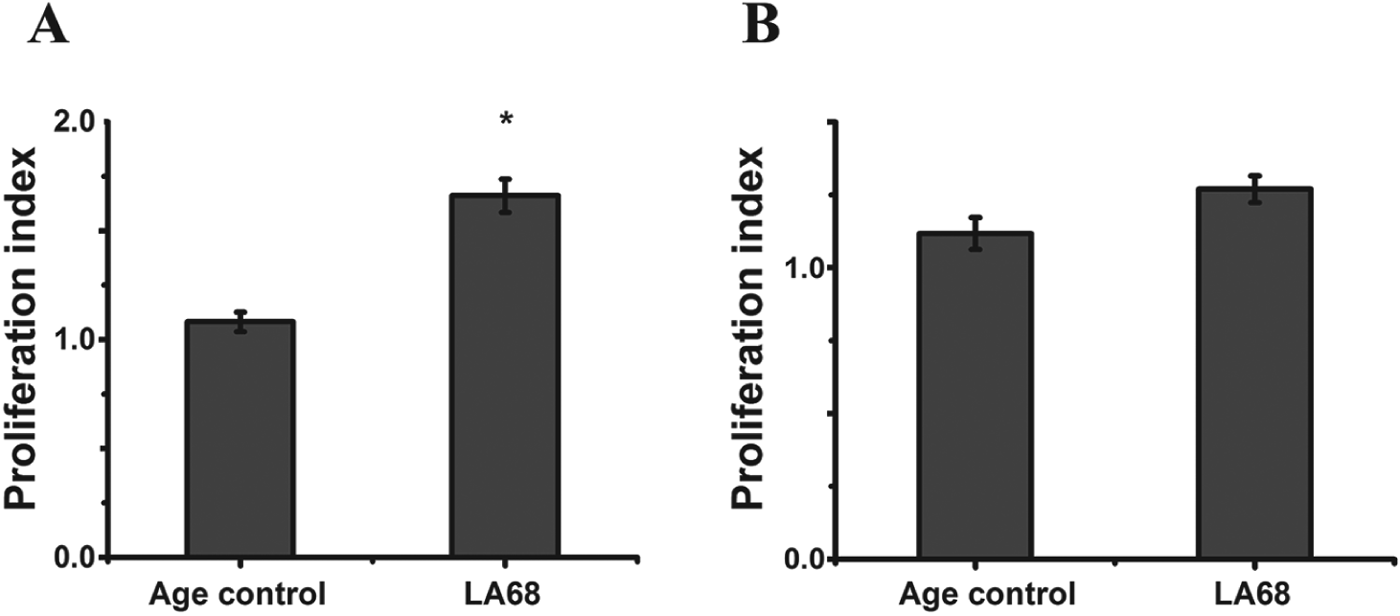
The metabolic activity of splenocytes isolated from experimental mice analysed with MTT test (upon 48 h incubation with LPS and PGN as stimulators) revealed that LPS was more potent as stimulator of cell proliferation than PNG. Stimulated splenocytes from mice given the LA68 strain showed significantly higher proliferation index upon stimulation with LPS than with stimulation with PGN, which failed to produce statistically significant difference (Fig. 3).
MTT assay showing the metabolic activity measurements of splenocytes. upon stimulation with (A) PNG; (B) LPS. Mean values are shown of the proliferation index (obtained by dividing the signal for stimulated cells with the signal obtained for cells only) ±SD. Statistical significance was assessed by two sample T-test, and P<0·05 corresponds to *.
Cytokine measurements
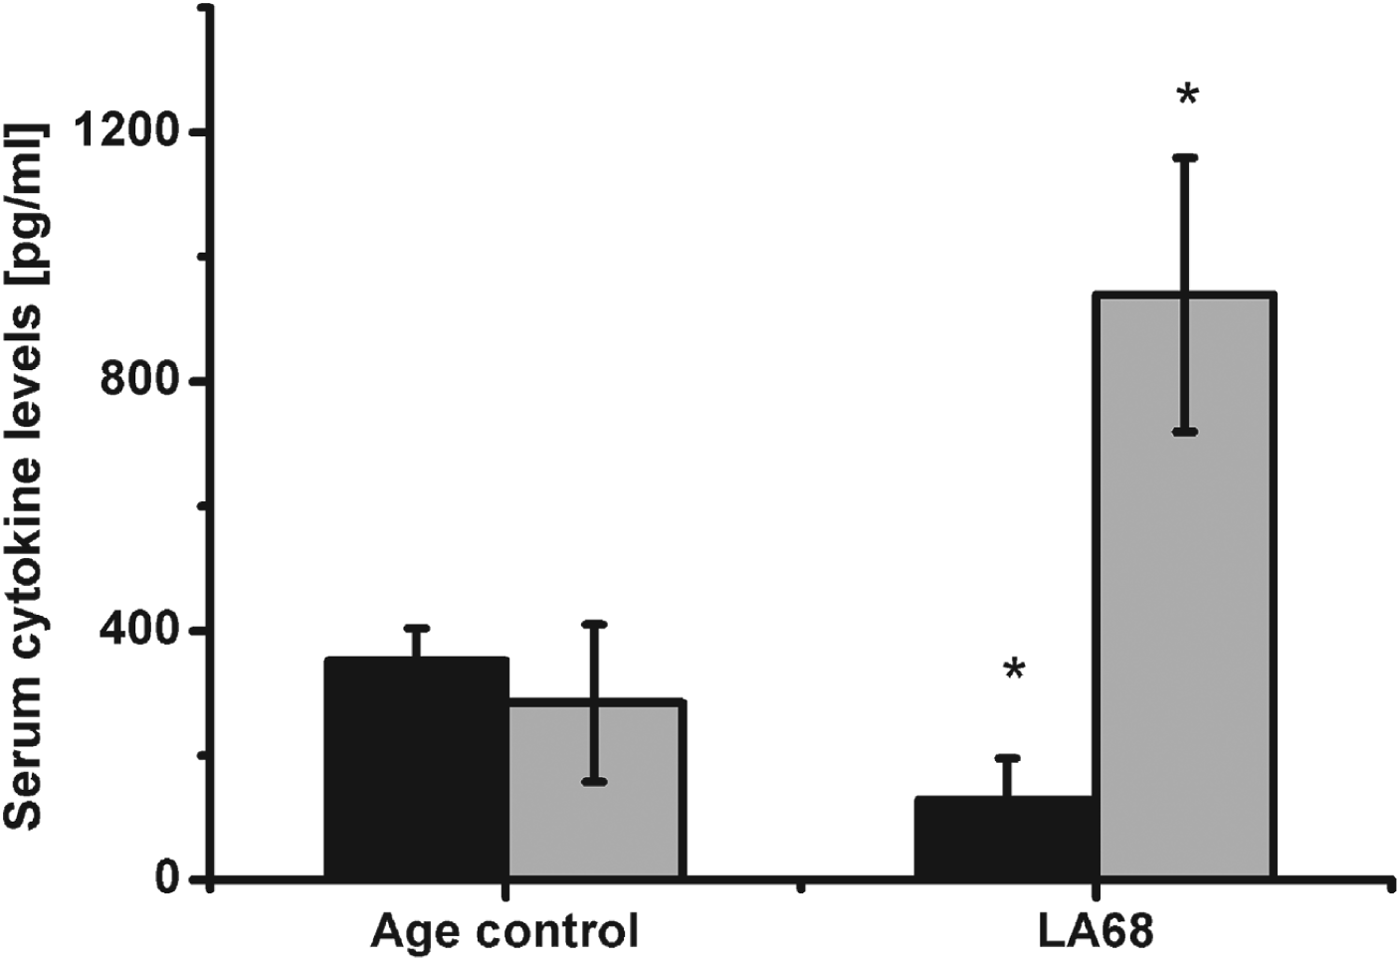
Cytokine production was determined in the serum collected from the laboratory mice, and in stimulated splenocyte culture supernatants. Interestingly a significant difference in the levels of IL-10 and IFN-γ between the two groups was found in the serum (Fig. 4). The level of IL-10 was decreased in the serum of mice fed with LA68, and IFN-γ was increased in this group, Fig. 4.
Cytokine levels in the serum of C57BL6 mice. LA68 - Experimental mouse group gavaged with Lb. rhamnosus LA68. Black columns represent IL-10 levels, light grey columns IFN-γ. Mean values in pg/ml ±SD are shown. Statistical significance was assessed by two sample t-test, P<0·05 corresponds to *.
We found no statistically significant difference for IL-6 and IL-17 (due to high variation among individual samples, data not shown).
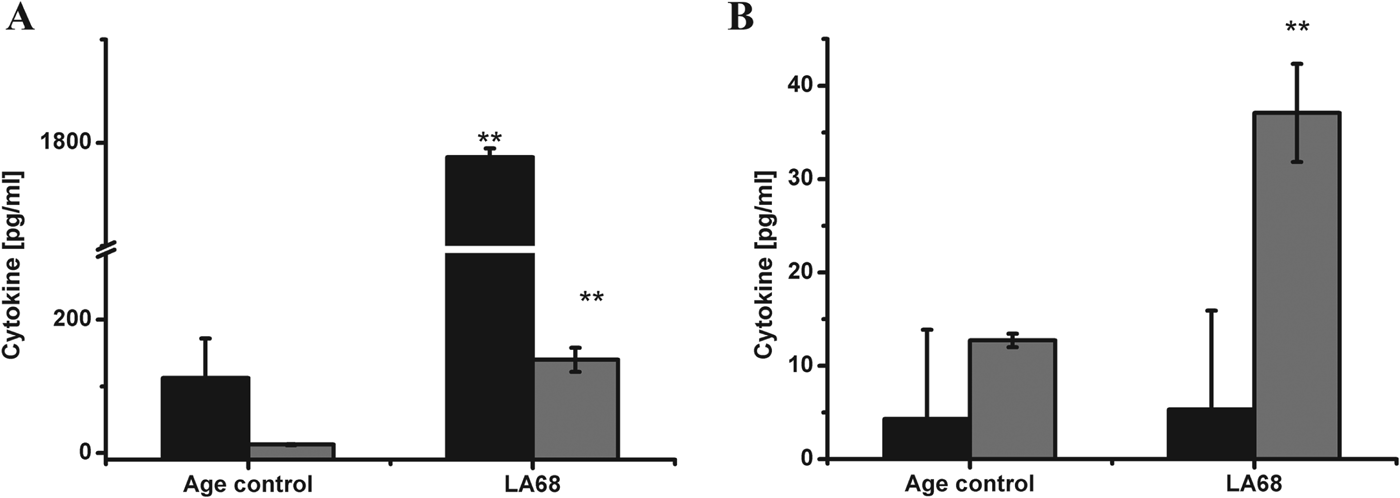
Cytokine detection in the supernatants of splenocyte cultures, stimulated with either PGN or LPS showed significantly higher production of IL-6 in the LA68 group mice, compared with the age control group, (Fig. 5a, b). The production of IL-10 was markedly increased in the LA68 group, but only when the splenocytes were stimulated with PGN (Fig. 5a). No differences between the groups were detected for IL-17 and IFN-γ, upon splenocyte stimulation, which might be due to lower sensitivity of the assay.
Cytokine levels measures from stimulated splenocyte cultures supernatants, upon stimulation with (A) PNG; (B) LPS. LA68 - Experimental mouse group gavaged with Lb. rhamnosus strain LA68. Black columns represent IL-10 levels, grey columns IL-6. Mean values in pg/ml ±SD are shown. Statistical significance was assessed by two sample t-test. P<0·05 corresponds to * and P<0·005 corresponds to **.
Discussion
Lb. rhamnosus LA68 bacteria (2×10⁹ CFU per dose) were applied orally to mice for the duration of one month. We looked at changes in cell population abundance in the spleen.
Since the bacteria were applied orally the contact of bacteria with the mouse immune system occurred though mucosal tissues. Our results show that immune activation at the gastrointestinal tract leads to systemic changes, as evidenced by changes in splenocyte population changes, and serum cytokine level differences.
Interestingly, we found that mice which received LA68 had an increase in CD11b+ cells in the spleen. This molecule, also referred to as CR3, or Mac-1 is involved in cellular adhesion, phagocytosis and leucocyte migration (Ehlers, Reference Ehlers2000). Neutrophilic granulocytes are the first line of defence against bacteria, so the increase in CD11b+ is probably related to the expansion of this cell population, though this remains to be corroborated, as monocytes are precursors of both macrophages and dendritic cells, both of which are part of the innate immune response, and are involved in defence against bacteria as well. Interesting to note is that mouse as well as human primary neutrophils express TLR9 on the cell surface, making these cells even more sensitive to bacterial-derived TLR9 ligands which cannot reach the endosome, offering an alternative mechanism for neutrophil activation (Lindau et al. Reference Lindau, Mussard, Wagner, Ribon, Rönnefarth, Quettier, Jelcic, Boissier, Rammensee and Decker2013). Apart from these two cell types CD11b can also be found on minor subsets of lymphocytes (Ross & Vĕtvicka, 1993), but this population is less likely to be expanded as lower abundance of both B and T lymphocytes were detected. Functional importance of CD11b+ cells and the significance of their increase was previously elucidated in a similar context by Chiba et al. (Reference Chiba, Shida, Nagata, Wada, Bian, Wang, Shimizu, Yamashiro, Kiyoshima-Shibata, Nanno and Nomoto2010) who identified CD11b+ cells from the spleens of mice fed with Lb. casei as major producers of IL-12 and TNF-α. Though these cytokines were not measured in this study both are directly related to IFN-γ production. Parallel to the increase in CD11b+ cells there was also an increase in CD16/32+ cells in the LA68 group. This marker is directed against FcγRII and FcγRIII (which share a highly similar protein chain, 95 %), both of which are low affinity IgG receptors, and it would be interesting to test whether there are differences in FcγRI, the high affinity receptor. The low affinity receptors are found on both myeloid and lymphoid cells and have many different roles, such as influencing leucocyte development, namely these markers are expressed on B and T-lymphocyte developmental stages before the expression of clonal antigen receptors (Lynch, Reference Lynch2000). The obtained results suggest higher vigilance against a potential pathogen.
A reduction in B and T cell populations abundance, and especially in CD25+ T cells, could be an important factor for this bacteria to induce specific tolerance, even in case of a previously existing specific adaptive response. Although the reduction of CD25+ cells might also mean the reduction of Treg numbers, this remains to be analysed. The reduction of both CD8+CD25+ and CD4+CD25+ cell percentages was detected upon the consumption of Lb. rhamnosus 271 by human subjects (Rask et al. Reference Rask, Adlerberth, Berggren, Ahrén and Wold2013), but no further dissection of this cell population was performed in the aforementioned study either. The reduction of B and T cell population abundance in the spleen might also be related to the increased recruitment of lymphocytes to the intestinal compartment, as B1 B cells from the peritoneum sensing the gut bacteria migrate out of the peritoneal cavity (Ha et al. Reference Ha, Tsuji, Suzuki, Meek, Yasuda, Kaisho and Fagarasan2006).
The noted changes in analysed spleen leucocyte populations have not been previously detected for Lb. rhamnosus LA68 strain, and though there exist differences between different Lactobacillus species, which might be smaller between different strains, each strain might act in a unique manner. The administration of Lb. rhamnosus HN001 to Balb/c mice lead to no differences in lymphocyte population abundance, but resulted in increased phagocytic capacity of peripheral blood leucocytes and macrophages (Gill et al. Reference Gill, Rutherfurd, Prasad and Gopal2000). This discrepancy in our study might be because previous studies mainly used Balb/c mice, while in the present study C57BL/6 mice were used. Inbred mice strains have different genetic backgrounds which are important for the Th1/Th2 balance (Hsieh et al. Reference Hsieh, Macatonia, O'Garra and Murphy1995; Stewart et al. Reference Stewart, Fulton, Wilson, Monitto, Paidas, Reeves and De Maio2002). There are many other differences between these two strains, and the generally accepted view is that the C57BL/6 mice are more similar to the human system because it is considered to be a Th1 mouse, unlike the Balb/c mice which are typical Th2 mice (Watanabe et al. Reference Watanabe, Numata, Ito, Takagi and Matsukawa2004).
The whole splenocyte population was stimulated with both PGN and LPS, and the highest cell proliferation/metabolic activity was found with LPS stimulation. Gill and his group also found increased proliferative response upon stimulation with LPS and ConA (Gill et al. Reference Gill, Rutherfurd, Prasad and Gopal2000), which is in accordance with our results.
LAB, as G+ bacteria do not contain LPS, so this result could not be explained by increased sensitivity due to increased exposure, in fact many LAB strains decrease intestinal permeability (Salminen et al. Reference Salminen, Isolauri and Salminen1996), and hence should lower serum LPS levels. The increased reactivity is related to differences in the presence/abundance or activity of specific receptors for these molecules.
Differences in serum cytokines between the age control and LA68 group are especially interesting as this reflects the induced in vivo situation. The level of IL-10 is reduced in the serum of experimental mice, and IFN-γ is increased, which clearly indicates activation of the Th1 response. Many previous studies have detected in vitro changes in cytokine production (Miettinen et al. Reference Miettinen, Matikainen, Vuopio-Varkila, Pirhonen, Varkila, Kurimoto and Julkunen1998; Gill et al. Reference Gill, Rutherfurd, Prasad and Gopal2000; Christensen et al. Reference Christensen, Frøkiaer and Pestka2002), but in this study we analysed serum cytokines directly.
The situation upon splenocyte stimulation changed as there was a large increase in IL-10 production in the LA68 group upon stimulation with PNG, whereas IL-6 increase was detected upon stimulation with both LPS, and PGN. One could speculate that an increase in IL-10 production upon PNG stimulation is due to the fact that Lb. rhamnosus, as well as other LAB possesses PGN, and that the contact with the same type of bacteria induces tolerance to this type of bacteria, but this remains a hypothesis.
Both pathogens and commensals have mutual PRRs ligands, and this mechanism alone is insufficient to distinguish between different microorganisms (Chinen & Rudensky, Reference Chinen and Rudensky2012), and the detected immune activation is a consequence of activation due to increased intestinal bacterial burden.
This study characterises the effect of oral application of live Lb. rhamnosus LA68 bacteria in C57 BL/6 mice, and it supports previous findings of innate immunity enhancement. There are many different studies of therapeutic applications of LAB, conditions where application is beneficial and conditions in which there was very little or an opposite effect. Since there are many individual differences between different species and strains, the findings cannot be generalised to all lactobacilli, because where one strain might show no benefit another may be beneficial. Detailed studies of the immunological consequences of probiotic consumption might also be of value when designing probiotic formulation containing multiple strains/species. We hope our findings contribute to the diverse mechanisms of action of consumption of viable bacteria of the Lb. rhamnosus species.
The authors thank Nada Trsic-Milanovic for providing us with Lb. rhamnosus LA68, and Boban Zivkovic for technical assistance. This work was supported by The Ministry of Education, Science and Technological Development of the Republic of Serbia, project number 172049 and iii46001. The authors declare no conflicts of interest.