Introduction
Of all the Earth's continents, Antarctica is the least impacted by human activity. Antarctica has no permanent population, but in recent decades has experienced increased visitation by tourists and an expansion in the footprint of infrastructure to support scientific activities (http://iaato.org/tourism-statistics, accessed January 2012, COMNAP 2012). Impacts resulting from local human activity may include disruption of soils, plants and microbial communities by human trampling or vehicle use, disturbance of marine mammals and birds, potential introduction of non-native species (including microorganisms) into terrestrial and lacustrine environments, low level pollution, disturbance of lake sediments and disruption of habitat due to construction of temporary or permanent huts or camps (Tin et al. Reference Tin, Fleming, Hughes, Ainley, Convey, Moreno, Pfeiffer, Scott and Snape2009, Hughes & Convey Reference Hughes and Convey2010, Hughes et al. Reference Hughes, Fretwell, Rae, Holmes and Fleming2011, Cowan et al. Reference Cowan, Chown, Convey, Tuffin, Hughes, Pointing and Vincent2011).
The Antarctic Treaty Consultative Meeting (ATCM) gives effect to the principles of the Antarctic Treaty through the agreement, by consensus, of regulations and guidelines for the management of the Antarctic Treaty area. Recognising the susceptibility to human impacts of vulnerable sites and the usefulness of some locations for scientific research, the ATCM has had a mechanism for area protection within Antarctica, in some form or other, for over five decades (Bonner & Lewis Smith Reference Bonner and Lewis Smith1985, Lewis Smith Reference Lewis Smith1994, Australia 2010, ATCM 2011). Nevertheless, the manner in which these mechanisms have operated and a general lack of strategic planning in their use has resulted in a protected area network that, in large part, does not provide adequate spatial protection of Antarctica's biodiversity or geodiversity (New Zealand 2009, SCAR 2010, Terauds et al. Reference Terauds, Chown, Morgan, Peat, Watts, Keys, Convey and Bergstrom2012).
Following the entry into force in 1998 of the Protocol on Environmental Protection to the Antarctic Treaty (also known as the Madrid or Environmental Protocol), Treaty Parties committed themselves to the comprehensive protection of the Antarctic environment, designating Antarctica as a ‘natural reserve, devoted to peace and science’ (ATCP 1991). Under this Protocol, the highest level of environmental protection for a site within the Antarctic Treaty area is achieved through designation as an Antarctic Specially Protected Area (ASPA). According to Annex V to the Environmental Protocol, ASPAs were to be designated to protect ‘outstanding environmental, scientific, historic, aesthetic or wilderness values, any combination of those values, or on-going or planned scientific research’. For a proposed ASPA to become formally designated the proposal must be accompanied by a management plan. Normally, the Party that originally puts forward an area for consideration by the ATCM as an ASPA becomes the proponent or managing Party and is responsible for drafting and updating the associated management plan. Once designation of an ASPA is complete, entry to the Area is allowed only in accordance with a permit issued by an appropriate national authority. Annex V (Article 10) lays out legislation on exchange of information for protected areas and specifically that ‘Parties shall make arrangement for: (a) collecting and exchanging records, including records of permits and reports of visits, including inspection visits, to Antarctic Specially Protected Areas……; (b) obtaining and exchanging information on any significant change or damage to any……Antarctic Specially Protected Area……; and (c) establishing common forms in which records and information shall be submitted by Parties…’. To fulfil part (c), the ‘Guide to the preparation of Management Plans for Antarctic Specially Protected Areas’, adopted under Resolution 2 (1998) and updated under Resolution 2 (2011), contains as Appendix 2 the ‘Antarctic Specially Protected Areas (ASPA) visit report form’, which should be used to record activities undertaken in the ASPA.
Parties have different calls on their ASPA permitting systems, with some Parties permitting large numbers of tourist visits to historic ASPAs for education and outreach purposes, in line with the number and size of tourist operators subject to each Party's legislation. Furthermore, due to differences in national legislation, some Parties have the ability to allocate permits to citizens of other nations/Parties, while others allocate permits only to their own nationals.
Information exchange is a fundamental principle upon which the Antarctic Treaty was founded. Article III of the Treaty establishes that Parties must exchange information on plans for scientific programmes in Antarctica in order to promote international cooperation in scientific investigations. The information exchange system has evolved substantially since the required information was first specified in 1961 (Canberra, Recommendation ATCM I-6), notably with a standard form for annual exchange of information that was first agreed by Parties in 1975 (Oslo, Recommendation ATCM VIII-6).
Currently, information exchange concerning visits to Protected Areas is to be submitted as Pre-season Information, which describes planned activities in the forthcoming year (including name and number of Protected Area to be visited, number of people permitted to visit, date/period and purpose) and Annual Report information which gives an accurate update on information concerning visits to Protected Areas that was supplied in the Pre-season Information of the preceding year. Preferably, Pre-season Information is to be submitted by 1 October, and in any event no later than the start of the activities being reported, while Annual Reports must be submitted as early as possible after the end of the austral summer season, but in all cases before 1 October, with a reporting period of 1 April–31 March.
Collection of Annual Report information is considered essential if the Committee for Environmental Protection (CEP) is to carry out its functions as described in Article 12 of the Environmental Protocol, which includes the need for the CEP to provide advice and recommendations on the operation of the Antarctic Protected Area system, environmental impact assessment procedures and the means of minimising or mitigating environmental impacts of activities in the Antarctic Treaty area (CEP 2010, paragraphs 14–20). Pre-season information is to be submitted to allow ‘other Parties to make use of this information when planning their own activities’ (Australia 2001). However, during the negotiations of the current information exchange requirements in 1998, some Parties were of the opinion that Pre-season Information was ‘generally received too late to be useful and that consequently little, if any, information should be sought at this time’ (Australia 2001). Nevertheless, the new format was accepted (Appendix 4 of the Final Report of the ATCM XXIV). At ATCM XXII (Tromsø 1998) it was noted that the existing information exchange system could benefit from revision and the use of web-based technology, which lead to an intersessional contact group (ICG) being formed to discuss the issue (United States 1998). The ICG report recommended that a central website be created to facilitate information exchange, and suggested revisions to the timing of information submission (Australia 2001). At the request of the ATCM (Stockholm, Decision ATCM XXVIII-10) the Antarctic Treaty Secretariat developed the web-based Electronic Information Exchange System (EIES), which began operation on 15 September 2008 with the collection of the Pre-season Information for the 2008/09 season. To further simplify electronic information exchange for Parties, the Antarctic Treaty Secretariat (ATS) has provided a facility for Parties to submit information in a spreadsheet form, which is subsequently entered into the EIES database by the Secretariat (ATS 2012).
Given the long and complex history of the Protected Area and Information Exchange systems in Antarctica, this paper aims to analyze the effectiveness of the information exchange practices for protecting from human impact the values for which ASPAs were designated. We examined Parties’ implementation and interpretation of Annex V to the Environmental Protocol associated with permit allocation for entry to ASPAs and how effectively Parties were providing information on ASPA visitation to the EIES. We also present some examples of analyses that could be made if all Parties submitted information on ASPA visitation to the EIES to the standard required by the Environmental Protocol.
Materials and methods
All data were obtained from the ATS website between December 2011 and January 2012 (www.ats.aq). ASPA management plans were obtained from the ATS Protected Areas webpage (http://www.ats.aq/e/ep_protected.htm), while the Information Exchange web pages (http://www.ats.aq/e/ie.html), and in particular the EIES, were used to gather information on allocation of permits for entry to ASPAs. Relevant Antarctic ATCM and CEP Working and Information Papers were also accessed through the ATS website (http://www.ats.aq/devAS/ats_meetings.aspx?lang=e). An EIES function that summarises information on ASPA permitting, visitation and activities, available at: http://www.ats.aq/devAS/ie_reports.aspx?lang=e, was also used. Data available on the EIES as of December 2011 was used in this study. Any information added subsequently was not incorporated into the analysis.
ASPA designation and spatial distribution
Information relating to the designation date of each ASPA, and the proponent country was obtained from the Antarctic Treaty Systems document entitled ‘Status of Antarctic Specially Protected Area and Antarctic Specially Managed Area Management Plans’ (http://www.ats.aq/documents/ATCM34/WW/atcm34_ww003_e.pdf). Details of ASPA locations were taken from the ASPA management plans and the Antarctic Protected Areas Database (http://www.ats.aq/devPH/apa/ep_protected.aspx?lang=e).
Exchange of Pre-season Information and Annual Reports by Parties via the EIES
The Information Exchange data were examined to determine to what extent Parties had exchanged information via the EIES on activities they have conducted or authorised within the Antarctic Treaty area. The submission of Parties’ Pre-season Information and Annual Reports to the EIES for the years 2008/09, 2009/10 and 2010/11 was examined. Electronic Information Exchange System submissions were included in the analysis, but internet links to external sources of information were not as often they were not functional, and were not managed by the ATS. Two Consultative Parties did not exchange any Pre-season Information or Annual Report documents for the period of study and therefore could not be included in this study.
Permit applications and ASPA visitation
To assess the effectiveness of implementation of the information exchange practices with regard to the ASPA system, we examined the allocation of permits for entry to ASPAs using the EIES database administered by the ATS. As the EIES was only formally recognized as the repository for this information in 2008/09, we focused on data submitted by Consultative Parties pertaining to the three years 2008–09, 2009–10 and 2010–11.
For each Party, the number of persons/visitors covered by permits was obtained from the Pre-season Information and the ASPA visitation details were taken from Annual Reports. In some cases the EIES included information on the period for which the permit was granted, however, this was not considered an accurate guide to how many days or hours were spent within the ASPA, as permits routinely cover considerably longer periods than is required by the applicant, to allow for often unavoidable changes in Antarctic logistics schedules that may delay access to the ASPA.
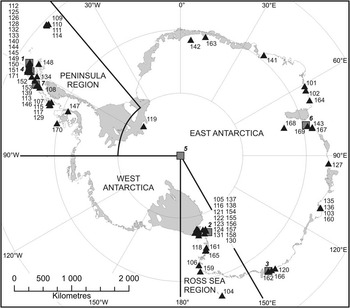
Permit applications and ASPA visitation were also examined from a regional perspective. For this analysis, the continent was divided into four regions: 1) the Antarctica Peninsula region, 2) the Ross Sea region, 3) the remainder of East Antarctica, and 4) West Antarctica, excluding the Antarctic Peninsula (Fig. 1). As before, for each ASPA, the number of permit applications was obtained from Pre-season Information and levels of visitation by Parties were recorded from Annual Report information. Acknowledging the lack of full ASPA visitation data we used the available information to: i) show the sort of analyses that could be possible if full data were available, and ii) look for trends in ASPA visitation, within the constraints imposed by the existing data (for years 2008–09, 2009–10 and 2010–11). The most reliable information on ASPA visitation was assumed to be contained within Annual Reports but, where Annual Report information was missing, we estimated the likely levels of visitation to each ASPA by examining the data available in the equivalent year's Pre-season Information or by extrapolating data from other Annual Report years. The following rules were used to make these estimations, in order of priority:
Map of Antarctica showing the locations of the 71 Antarctic Specially Protected Areas (ASPAs) and seven Antarctic Specially Managed Areas (ASMAs) (correct as of December 2011). The four regions described in this research are shown.

1) For Parties with one or two missing Annual Reports, but available Pre-season Information for: i) the missing year(s), and ii) the other years where Annual Reports are available, a ratio (or a mean of two ratios) of Annual Report/Pre-seasonal Information was applied to the available Pre-season Information figures to give an estimation of likely levels of ASPA visitation (applied to data from New Zealand, Spain, Germany and China).
2) For Parties where no Pre-season Information or Annual Report data is available for a given year or years, the mean of the available Annual Report information was used (applied to data from Australia, Brazil, Chile, Japan and the USA).
Where Parties exchanged information on topics other than protected area visitation via the EIES, but did not submit information on ASPA visitation, we assumed that no ASPAs were visited during the reporting period. Once estimated visit numbers for the three-year period were made, the mean estimated visitation levels per year were calculated. This value was used as a proxy for visitation levels in further analyses.
Concentration of visitors within ASPA ice-free areas
The research literature on local human impacts within Antarctica shows that values within ice-free areas of ASPAs may be at high risk from human visitation, although the sensitivity of ice-free ground and related values may vary between sites. It should be noted, however, that c. 10% of ASPAs containing ice-free ground may not be designated primarily to protect values directly linked with the ice-free area (e.g. historic values and some physical science values), while marine ASPAs may also be vulnerable to human impact, but tend to be larger in areas with research impacts potentially more dispersed. Nevertheless, c. 80% of ASPAs contain values linked with the ice-free ground.
For those ASPAs that contain ice-free ground, it was assumed that the majority of scientific research and field activities were undertaken on the ice-free ground and not on areas of permanent ice. To estimate the concentration of human activity on ice-free ground within ASPAs, the mean estimated visitation level per year was divided by the area of ice-free ground within the ASPA. The EIES does not include details of levels of activity or visitation to specific sites within ASPAs. Therefore, this methodology does not account for high concentrations of human activity that may be focussed within a small number of locations within ASPAs. However, it should give an indication of concentration of activity within the ASPA overall. Details of the ice-free area of the ASPAs were taken from the ASPA management plans. In this work, we excluded marine ASPAs and those with no ice-free ground (ASPA Nos 137, 144, 145, 146, 152, 153, 162, and 163) and all non-visited ASPAs for the study period (ASPA Nos 103, 104, 111, 119, 127, 160, 164, 166, 167, 170, and 171).
Number of Parties visiting specific ASPAs and the proportion of ASPA visitation by proponent Parties
Data on the number of Parties conducting or authorising visits to specific ASPAs within Annual Reports were obtained for the period 2008–09, 2009–10 and 2010–11. In this analysis, we excluded all non-visited ASPAs for the study period and Parties that did not visit any ASPAs.
In a subsequent analysis, the mean estimated visitation level of each ASPA over the period 2008/09–2010/11 was recorded for: i) the proponent Party (or Parties), and ii) the total visitation. The proportion of visitation to each ASPA by the proponent Party (or Parties) was calculated as a percentage of visitation by all Parties during the study period. Non-visited ASPAs were excluded from the study, as were ASPAs whose proponent did not provide any permit information (ASPA Nos 128, 132, 134, 163, and 171). Where an ASPA had two proponents (i.e. ASPA No. 133, Harmony Point), one of whom did not provide any permit information, only data from the proponent that provided information was included in the study.
Results
ASPA designation and spatial distribution
Figure 1 shows the location of the 19 ASPAs in East Antarctica (26.7%), 21 in the Ross Sea region (29.5%) and the 31 in the Antarctic Peninsula region (43.6%). No ASPAs have been designated in West Antarctica other than in the Antarctic Peninsula. The Antarctic Peninsula has the smallest area but largest number of ASPAs.
Provision of Pre-season Information and Annual Reports by Parties to the ATS
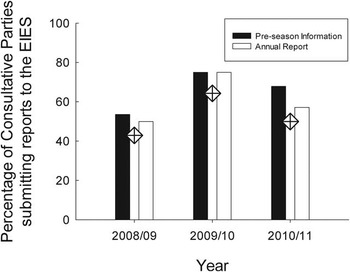
Figure 2 shows the level of information exchange by Consultative Parties between 2008/09 and 2010/11. In 2009/10, 75% of nations provided either Annual Reports or Pre-season Information, with 64% providing both. However, in the other two years examined, levels were lower with only 43% of Parties providing both documents in 2008/09.
Submission of information by Parties to the Electronic Information Exchange System between 2008/09 and 2010/11. Diamond symbols represent the percentage of Parties that submitted both Pre-season Information and Annual Reports for a given year.

Examination of the EIES data revealed several inconsistencies regarding provision of ASPA visitation data by Parties.
1) Some Parties submitted information on other aspects of their logistical activities to the EIES but did not report their ASPA visits. For example, one Party submitted no information concerning ASPA visits from 2008/09–2010/11, but the management plan of an ASPA, for which it was the proponent, stated that penguin survey work was performed within the ASPA during the 2010/11 season (ASPA No. 127 Haswell Island), showing that at least one ASPA had been entered by that Party.
2) One Party submitted permit applications for a large number of ASPAs within the Pre-season Information, which were not visited subsequently.
3) The type of information provided to the EIES regarding ASPA visitation was not always consistent between Parties. For example, some Parties failed to specify the number of people to whom permits were granted to enter a specific ASPA, but rather list project numbers, or in one case failed to specify which ASPAs were visited at all.
4) A minority of Parties allocated permits to personnel on vessels transiting marine ASPAs, although this may have been considered unnecessary by other Parties due to the provisions relating to the right of passage across the high seas, stipulated within the United Nations Convention on the Law of the Sea (UNCLOS) and the Antarctic Treaty (Article VI).
5) Parties have demonstrated different interpretations of what constituted: i) acceptable environmental standards, and ii) a legitimate reasons for entry to an ASPA.
6) Parties have shown different approaches when allocating permits for entry to the nine ASPAs that are divided into sub-sites. Some Parties provided a permit for entry to all the sub-sites within an ASPA, irrespective of which needed to be visited, while other nations only gave permission to enter specific sub-sites within the ASPA.
7) Most Parties allocated permits for ASPA entry for periods of a few weeks or months within the reporting year, although one Party allocated permits that were valid for up to five years, and sometimes several years into the future.
Permit applications and ASPA visitation - by Parties
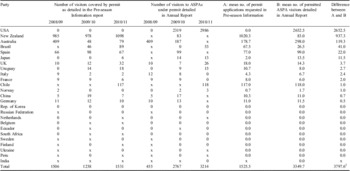
Table I shows the number of persons/visitors covered by permits (Pre-season Information) and ASPA visits (Annual Reports) submitted by Consultative Parties for the study years. These data indicate that more persons/visitors were covered by permits issued by the United States than all other Parties combined. Some Parties submitted no ASPA visitation data through the EIES during the period studied (Table I). Only 50% of Parties reported visiting ASPAs during the three year period examined.
Number of visitors covered by permits (Pre-season Information) and Antarctic Specially Protected Areas (ASPA) visitation details (Annual Reports) submitted by Antarctic Treaty Consultative Parties for the years 2008/09, 2009/10 and 2010/111. Estimated mean number of permit applications requested in Pre-season Information and mean number of permitted ASPA visitors detailed in Annual Reports were calculated using the rule described in Materials and methods.

x = No Pre-season Information or Annual Report present on the Information Exchange webpage as of December 2011.
0 = No permits applications or no details of permits and/or ASPA visitation included in Pre-season Information or Annual Reports.
1No Pre-season Information or Annual Reports were submitted by Argentina or Poland during the years 2008/09, 2009/10 and 2010/11 by December 2011.
2Total difference is the sum of the differences between A and B for each of the Parties.
Permit applications and ASPA visitation - by region
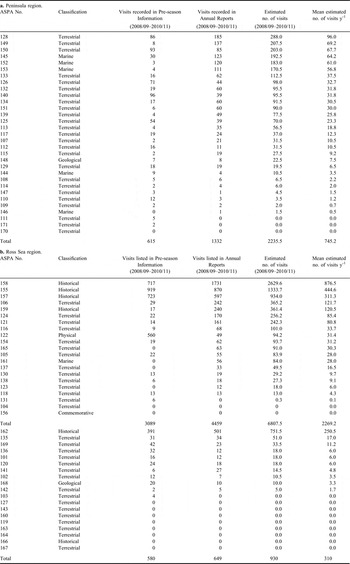
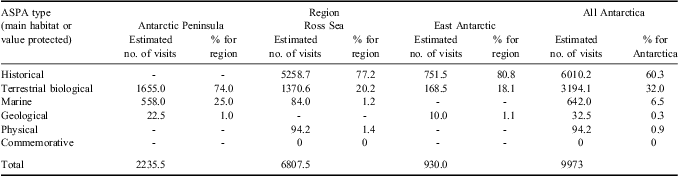
The number of protected areas, range of values under protection and levels of ASPA visitation differed greatly across the Antarctic Peninsula, Ross Sea and East Antarctic regions (Fig. 1, Tables II & III). Table II shows the estimated levels of visitation of ASPAs in the three regions containing ASPAs. For the 31 ASPAs in the Antarctic Peninsula region only three ASPAs were not visited (ASPA Nos 111, 170, and 171) while only two ASPAs out of 21 were not visited in the Ross Sea region (ASPA Nos 104 and 156) during the study period. However, in the remainder of East Antarctica, nine out of 19 ASPAs were not visited during the three year period (ASPA Nos 103, 119, 127, 143, 160, 163, 164, 166, and 167). The mean annual estimated number of individual visitors to ASPAs in Antarctica was 3324, with c. 23, 68 and 9% of visits to the Antarctic Peninsula, Ross Sea region and East Antarctica, respectively. The Ross Sea region had by far the greatest level of visitation, due to the concentration of highly visited historic sites within the region (i.e. four historic sites are included in the top five most visited ASPAs in the Ross Sea region) (Tables IIb & III). The estimated mean annual number of visitors to each ASPA within the Antarctic Peninsula region, Ross Sea region and the remainder of East Antarctica were 24, 108 and 17 individuals, respectively (estimated annual mean of 47 visits per ASPA across all of Antarctica, falling to 20 when visits to historic ASPAs are excluded).
Recorded and estimated visitation of Antarctic Specially Protected Areas (ASPAs) in the a. Antarctic Peninsula region, b. Ross Sea region and c. remainder of East Antarctica based on data in Pre-season Information and Annual Report submissions to the Antarctic Treaty System Electronic Information Exchange System. ASPAs were classified as follows: predominantly terrestrial ASPA with biological values (Terrestrial), geological values (Geological), terrestrial ASPA with physical values (Physical), historic ASPAs (Historical), commemorative ASPAs (Commemorative) and marine ASPAs (Marine).

Permit applications and ASPA visitation - by ASPA type
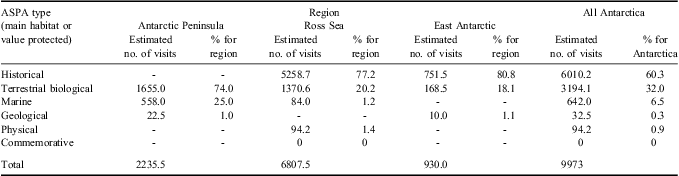
Over 60% of ASPA visitors went to historic ASPAs, predominantly in the Ross Sea region (Table IIb & c). Numbers of visitors to ASPAs protecting primarily terrestrial biological values was roughly similar in the Antarctic Peninsula (c. 1655 persons permitted) and Ross Sea regions (c. 1370 persons permitted), however, in the remainder of East Antarctica, numbers of visitors to terrestrial biological ASPAs was an order of magnitude smaller (c. 168 persons permitted; Table III). Overall visitors to East Antarctic ASPAs went predominantly to historic sites with, on average, less than 60 permits granted per year to enter all non-historical ASPAs. Only six ASPAs were designated to protect benthic habitats exclusively, with five of these in the Antarctic Peninsula region and one in the Ross Sea region. Around 6.5% of estimated visits during the study period were to the ASPAs protecting benthic marine environments (Table III). Across Antarctica, almost 20% of ASPAs were unvisited during the study period.
Number of visits per Antarctic Specially Protected Area (ASPA) type in different regions of Antarctica during the period 2008/09–2010/11 (three years).
Concentration of visitors within ASPA ice-free areas
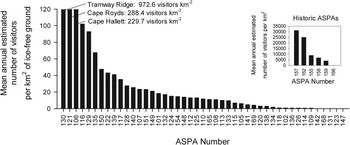
The total area protected within ASPAs was c. 3361 km2 and consisted of c. 1923 km2 marine environment (57.2%), 722 km2 ice-free ground (21.5%), 633 km2 permanent ice (18.8%) and 83 km2 freshwater bodies (2.5%). Figure 3 shows the concentration of human visitation to ASPAs in terms of number of visitors per km2 of ice-free ground. Some ASPAs were either small or contained little ice-free ground, and even low levels of visitation could produce extremely high annual estimated numbers of visitors per km2 of ice-free ground. For example, while ASPA No. 130 Tramway Ridge, Mount Erebus, Ross Island has only a small area of ice-free ground, approximately ten visitors per year have resulted in the highest visitor concentration values, excluding those within the historic site ASPAs. In contrast, ASPA No. 126 Byers Peninsula (Livingston Island) and ASPA No. 123 Barwick and Balham valleys (south Victoria Land) contain substantial areas of ice-free ground, and consequently, visitor concentration values were low compared with other ASPAs. These examples reveal the different approaches to area protection within Antarctica: i.e. i) protection of generally small distinct features and values, or ii) large areas with many different features or multiple values. Nevertheless, at specific locations of interest within larger ASPAs the concentration of visitation may be as high as for smaller ASPAs. For example, despite ASPA No. 147 Ablation Valley and Ganymede Heights having an area of c. 180 km2, human activity is focussed predominantly around three locations within the ASPA.
Estimated mean annual number of visits per km2 of ice-free ground within Antarctic Specially Protected Areas (ASPAs). ASPAs without ice-free ground and ASPAs that received no recorded visits during the study period were not included in the study.

Number of Parties visiting specific ASPAs and the proportion of ASPA visitation by proponent Parties
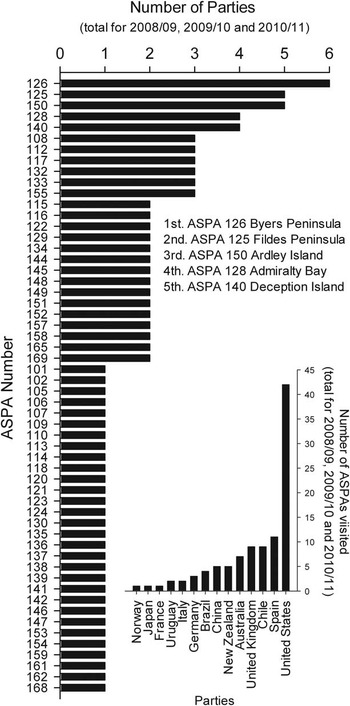
Figure 4 shows that up to six Parties granted permits to enter the same ASPA over the three year study period (i.e. ASPA No. 126 Byers Peninsula). The five ASPAs visited by the highest number of Parties were all found in the South Shetland Islands, including three in the King George Island area. Some Parties that operate in the area did not submit ASPA visitation data, so the true numbers are almost certainly higher. Several Parties worked within the same ASPA for more than one season. The inset in Fig. 4 shows the number of different ASPAs visited by each Party during the study period, with the United States permitting visits to by far the most ASPAs (42 areas, or 59% of the total number).
Total number of Parties visiting each Antarctic Specially Protected Area (ASPA) during the study period. Inset: total number of ASPAs visited by each Party during the study period (Parties that did not visit ASPAs during the three seasons or did not provide any information during the study period are not shown).

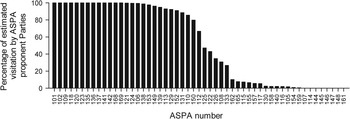
Figure 5 shows the estimated level of visitation of ASPAs by proponent Parties. Personnel from proponent Parties made more that 90% of recorded visits in 43% of these ASPAs. For c. 80% of ASPAs, personnel from proponent Parties made at least one visit during the study period.
Percentage of total estimated visitors to each Antarctic Specially Protected Area (ASPA) made by the proponent Party. Non-visited ASPAs were excluded from the study, as were ASPA whose proponent Party did not provide any permit information.

Discussion
Effectiveness of current information exchange and permitting practices
Following a SCAR/IUCN workshop on Antarctic protected areas in Cambridge, UK, in 1992, Penhale & Hofman (Reference Penhale and Hofman1994) made several recommendations to improve the implementation of the provisions of Annex V to the Environmental Protocol. In particular, they noted that: i) post fieldwork reporting is required detailing the activities carried out, changes or damage to special features in the Area and any observations of activities in the Area in contravention of the management plan, and ii) the exchange of information process needs to be improved. Twenty years on, these recommendations still need consideration and improved implementation (United States 1998; Fig. 2).
Some improvements in the level of information submission have been made since the introduction of the EIES and further improvements in the EIES were the topic of an ICG within the CEP during 2011/12 (ATS 2012). Nevertheless, technical difficulties alone do not explain the partial or complete lack of information exchange by some Parties. Two Parties submitted no information at all during our study period while others failed to provide ASPA permit/visitation data in both Pre-season Information and Annual Reports, despite their different intended purposes (see Table I). By failing to provide all of this information Parties did not fulfil their obligations under Annex V to the Environmental Protocol. Provision of this information is required, even if only to confirm that no ASPAs were visited by the Party in question. Furthermore, we found no reports from Parties detailing activities in contravention of the ASPA management plans, although such breaches have taken place (Braun et al. Reference Braun, Mustafa, Nordt, Pfeiffer and Peter2012).
Trends in ASPA visitation
The provision of ASPA visitation data was not sufficient for us to show actual levels of visitation and identify accurately areas at risk of cumulative impacts. Furthermore, the three-year period examined may not have captured adequately activities within the ASPAs required for the five-year review of the managements plans. We cannot predict when full, accurate and consistent disclosure of the ASPA visitation information by Parties will occur (ATS 2010, 2012). Until such times we will have to try to decipher any trends from the data available. The data presented in Tables II & III and Figs 3, 4 & 5 are, to differing degrees, based upon extrapolation of information provided by Parties within the EIES. Although careful consideration should be made before drawing conclusions for specific ASPAs, the data do reveal some general trends. For example, visitation of historic sites seem to make up the majority of ASPA visits (c. 60% of individual visits) with visits to ASPAs protecting terrestrial ecosystems making up around 32% of visits. Once visits to ASPAs protecting historic sites are excluded, levels of ASPA visitation within the East Antarctic were low (c. 60 per year) compared to the Antarctic Peninsula (c. 750 per year) and Ross Sea regions (c. 500 per year) (Table III). Clearly there is a wide variation in the number of visits each ASPA receives, with some of the remote or less accessible ASPAs receiving few, if any, visits over several years. Some Parties grant permits for visitors to enter a wider range of ASPAs than others, while, in most cases, the proponent Party for an ASPA permits a disproportionately large proportion of visits to the area.
At present there are no maximum limits on the number of people who can enter individual ASPAs (with the exception of some ASPAs protecting historic huts), or specific limits on the quantity of biological or geological samples that can be removed. Therefore, it may be useful to know which ASPAs stand out as potentially vulnerable to human impact and require: i) greater management effort to assess cumulative impacts, and ii) higher levels of co-ordinated field activity planning by interested Parties. When we compared ASPAs visited by three or more nations during 2008/09–2010/11 with ASPAs that received the highest concentration of visitors to ice-free ground we found that ASPA No. 150 Ardley Island, Maxwell Bay, ASPA No. 128 Western Shore of Admiralty Bay and ASPA No. 140 Parts of Deception Island received high levels of concentrated visitation from several different Parties. All three ASPAs are in the South Shetland Islands and may be at particular risk of impacts from visitation by multiple Parties, due to their close proximity to a high concentration of research stations.
The provision of Pre-season Information should, in theory at least, allow Parties to co-ordinate their activities to prevent over-visitation and potentially high levels of cumulative impact. However, it is not known to what extent the EIES is used by logistic co-ordinators when planning Antarctic fieldwork to ASPAs. Given that field party planning may occur several years in advance of the fieldwork, it is unclear if Pre-season Information exchange occurs early enough to permit changes in logistic planning within the ASPAs, as was raised when the concept was first discussed by the Treaty Parties. Personal contacts between different Parties and National Antarctic Programmes may be a more common route for information dissemination of this sort.
Conclusions
Our results show that some Parties are not fulfilling their obligations under the Environmental Protocol by failing to provide full information on protected area visitation. Furthermore, where information exchange does occur, it is still not undertaken consistently by all Parties. Clearly the collection of information on ASPA visitation is meaningless unless it is interpreted in a systematic way. Currently, Parties may see little point in spending time on submitting information that is little used, but at the same time our study has shown that it is difficult for ASPA visitation data to be interpreted meaningfully if the information is incomplete. To break this cycle, full and accurate information on ASPA visitation should be provided in an accessible format so that it can be interpreted and used to inform environmental management decisions. A function within the EIES, which allows users to generate automatically summarised information on ASPA permitting, visitation and activities undertaken within the ASPA, should make accessing the available information simpler.
In addition to EIES submissions, Parties are encouraged to forward information on activities conducted in the area (i.e. a copy of the ASPA visit report) to the ASPA proponent Party and it is recommended as a standard clause in most ASPA management plans (see Guide to the preparation of management plans for Antarctic Specially Protected Areas, www.ats.aq/documents/ATCM34/att/ATCM34_att004_e.doc). However, visit report exchange is undertaken routinely by few Parties, for example the United Kingdom is the proponent Party for almost 20% of the ASPA network, but in a typically year will not receive any visit reports from other Parties. Furthermore, to assist ASPA proponents in revising the ASPA management plans and ensuring they are fit for their intended purpose, it would be advantageous if Parties working within each ASPA could provide full details on, for example: i) the types of scientific research undertaken, ii) any use of radio or stable isotopes, iii) the number of person days spent within the ASPA, and iv) for larger ASPAs, which parts were visited (including, if possible, coordinates and GPS tracks).
Finally, it may be helpful to review the usefulness of Pre-season Information concerning ASPA visits, given the short interval between the submission deadline (October) and the start of the Antarctic summer season (mid-October or earlier for some Parties’ National Antarctic Programmes). If submission of Pre-season Information concerning ASPA visits was deemed no longer necessary Parties’ information exchange obligations would become less onerous.
Acknowledgements
This paper is a contribution to the SCAR EBA (Evolution and Biodiversity in Antarctica) research programme and the British Antarctic Survey's Polar Science for Planet Earth core programme EO-LTMS (Environment Office - Long Term Monitoring and Survey). Peter Fretwell is thanked for map preparation. Pete Convey and Susie Grant are thanked for comments on a late draft of the manuscript. In particular, we thank Ewan McIvor and an anonymous reviewer for useful comments on the manuscript.