


One-dimensional spatial models have come to inform much theorizing and research on the U.S. Supreme Court, and on adjudication more generally. Indeed, contemporary political science often argues that most politics is dominantly one dimensional (Clinton, Jackman, and Rivers Reference Clinton, Jackman and Rivers2004; Martin and Quinn Reference Martin and Quinn2002; Poole and Rosenthal Reference Poole and Rosenthal1997). This claim has particular import in the context of judicial politics, where scholars have wrestled with the question of whether, when, and how law and ideology interact. The traditional approach to judicial politics asserts that judges’ preferences are dominantly unidimensional and independent of any legal considerations (e.g., Segal and Spaeth Reference Segal and Spaeth2002). However, contemporary developments in the literature argue that law and ideology must been seen as inextricably linked features of judicial decision making, rather than competing forces on judges (Lax Reference Lax2011), and historical accounts of the courts have documented instances of judges’ preferences varying across areas of the law and over the course of their tenure on the bench. Even so, empirical scholarship has been heavily channeled through the unidimensional spatial model of justices’ preferences, at least in part because technical obstacles make richer descriptions of preferences difficult to obtain systematically. As a result, we do not know whether variation in preferences across areas of the law and over time is limited to a few idiosyncratic examples, or whether it is instead a general feature of judicial preferences that should shape the way we understand the court's internal decision making and relationship to the broader political system.
Qualitative research often reveals the multidimensional nature of justices’ preferences by contrasting decisions over time and across substantive issues. We bring this insight to the quantitative analysis of Supreme Court justices’ preferences, enabling systematic measurement of how preferences vary across areas of the law and over time. Our approach is based on a generalization of the optimal classification techniques introduced by Poole (Reference Poole2000) and extended by Bonica (Reference Bonica2010), and is also applicable to other small voting bodies such as city councils or the UN Security Council. The estimates that we present provide a richer view into the justices’ preferences than do previous models that only allow preferences to vary across time (e.g., Martin and Quinn Reference Martin and Quinn2002). We recover both well-documented and previously undocumented instances of variation in judicial preferences across areas of the law. Overall, we find a great deal of systematic variation in justices’ preferences beyond simple left-right political ideology: The revealed judicial doctrines expressed through dispositional votes vary substantially in their relative “liberalism/conservatism” across areas of the law.
Perhaps most strikingly, we show that the identity of the median justice—a figure whose importance in institutional theories of judicial decision-making and separation-of-powers models cannot be overstated—varies much more across substantive area of the law than previously recognized. This finding has implications for many substantive problems. Consider three examples. First, theories of bargaining on the Supreme Court largely implicate the median justice (for an overview, see Clark and Lauderdale Reference Clark and Lauderdale2010). Thus, while it is common to describe today's Supreme Court as the “Kennedy Court” because Justice Kennedy is considered the median justice (Alfano Reference Alfano2009; Cole Reference Cole2006), our analysis reveals that during any given term the identity of the influential median justice varies systematically from case to case, depending on the substantive issues at stake. Indeed, during the October 2009 term, Kennedy found himself in the minority in nearly a third of the 18 cases decided by a 5-4 margin, prompting leading court observer Linda Greenhouse to speculate that the Kennedy Court may be over and that the court had shifted away from Kennedy (Greenhouse Reference Greenhouse2010). Most notably, Justice Kennedy recently found himself in the four-justice minority in National Federation of Independent Business v. Sebelius (2012) upholding the Affordable Care Act, with many commenters expressing surprise that Chief Justice Roberts rather than Kennedy was the pivotal vote. Second, studies of Supreme Court nomination battles suggest that a new nominee's affect on the identity of the median is an important factor in Senate approval (Krehbiel Reference Krehbiel2007; Moraski and Shipan Reference Moraski and Shipan1999). Thus, when assessing whether a new justice will affect the balance of the court, one must consider variation in the justices’ preferences across areas of the law to know when, where, and to what extent the new justice's vote may be pivotal. Finally, litigants who are seeking to advance their policy agendas need to tailor their arguments to the critical members of the court, which requires knowledge of who is the median, or pivotal, justice. Thus, if the cleavages that divide the court are in fact multidimensional, social scientific analyses of whether advocates can effectively target the pivotal members of the court will be led astray by an assumption that judicial politics are unidimensional.
In the rest of this article, we introduce an approach to evaluating substantive and temporal variation in judicial preferences and then describe the model's insights about how preferences vary systematically. In the second section, we describe how our approach to measuring Supreme Court preferences is different from existing approaches. In the third section, we describe our estimator in detail, as well as the data that the estimator employs. Most importantly, we use two sources of information about the substantive similarity of cases: expert coded categorical indicators of cases’ substantive “issues” and “issue areas” from the Supreme Court Database (Spaeth et al. Reference Spaeth, Epstein, Ruger, Whittington, Segal and Martin2010) and distance in the citation network of majority opinions.Footnote 1 Combined with the timing of decisions, these data provide the information that our estimator requires to form preference estimates situated at each case's location within the law and in time. In the fourth section, we evaluate these preference estimates by connecting our findings to existing qualitative assessments of issue and time variation in justice preferences. Following that, we explore the implications that our findings have for a variety of substantive problems at the core of research on judicial institutions. Our analysis, we argue, opens the door to exploring several unexplored theoretical and empirical problems. The final section offers concluding remarks.
AN ALTERNATIVE APPROACH TO CHARACTERIZING PREFERENCES
Estimation of political actors’ spatial preferences has a rich tradition in political science. In recent years, the dominant approach has been to use voting patterns to estimate ideal points in a continuous latent space, which is assumed to represent political ideology. This approach rests on random-utility models that yield estimators similar or identical to item-response theory (IRT) models from psychometrics. In the context of the Supreme Court, variants of these models have been developed to estimate unidimensional preferences that vary over time (Martin and Quinn Reference Martin and Quinn2002) as well as multidimensional preferences (Grofman and Brazill Reference Grofman and Brazill2002; Peress Reference Peress2009). However, while multidimensional scaling models have proved useful in understanding other roll-call voting data, they face particular problems when applied to the Supreme Court.
Identifying Preference Dimensions on the Supreme Court
Three general problems in ideal point estimation—recovering ideal point estimates on continuous, cardinal scales; estimating multidimensional preferences; and making intertemporal comparisons—are exacerbated in the context of small voting bodies like the Supreme Court. Because smaller voting bodies have far fewer possible voting patterns than large bodies, they provide far less information about the relative—cardinal—spacing of political actors (Londregan Reference Londregan2000). Multidimensional scaling models use variation in voting patterns across different cases to infer the extent to which each vote is “about” each dimension; but this information is also lacking because of the limited number of possible voting patterns. Because there are so few voters, the two-dimensional spatial preference maps calculated using differing methods by Grofman and Brazill (Reference Grofman and Brazill2002), Poole (Reference Poole2005), and Peress (Reference Peress2009) are strikingly different in how they arrange the Supreme Court justices.
The assumptions needed to ensure comparability across time are more demanding because of the small size of the court. In the case of a large voting body like the U.S. Congress, intertemporal comparability can be based on the assumption that individual legislators’ preferences tend to change gradually over time (Poole and Rosenthal Reference Poole and Rosenthal1997). However, because preference changes by single justices and turnover on the Court have a relatively large effect on the overall distribution of preferences, additional assumptions are needed. Martin and Quinn (Reference Martin and Quinn2002) adopt a model that assumes long-term stability in the left-right distribution of cases, in addition to short-term stability in ideal points.Footnote 2 The former assumption is crucial to generating comparable estimates, but it is suspect because the nature of the cases the Court hears is surely changing over time. In fact, the estimates that result from this assumption have face validity problems that indicate that this assumption is probably not met. For example, Martin-Quinn estimates of ideal points identify the October 1972 term as the most conservative term between 1937 and 2009. That is, the median justice's ideal point is further to the right at that moment than at any other in the period. As others have observed (Bailey Reference Bailey2007, 436), the October Term 1972 is when the Supreme Court decided Roe v. Wade by a vote of 7-2. Roe is just one case, but it is hard to reconcile the claim that the Roe Court was the most conservative during that 73-year span, especially since Roe was only partially upheld in Planned Parenthood v. Casey by a 5-4 vote in 1992. On the other hand, the first term of the Roberts Court (the first part of the 2005 term) is identified in the Martin-Quinn scores as having the left-most median justice since 1968. Few Court watchers would agree that the 2005 Court was comparable in liberalism to the Court of 1968; most would argue that the Court had moved to the right during the 40 intervening years.
These and other instances stand as stark examples of the potentially misleading inferences that may be drawn from estimates of judicial ideal points that purport to be cardinal, multidimensional, or comparable across time. Indeed, Ho, and Quinn (Reference Ho and Quinn2010) caution against relying on either the cardinality or the intertemporal comparability of Martin-Quinn scores. Thus, there is a strong argument for generating descriptions of Court preferences that are limited to unidimensional rank orderings of sets of justices who are on the Court simultaneously, the information that is most strongly identified by dispositional voting data.Footnote 3 Such a stricture appears to rule out any characterization of how justices’ preferences vary across legal issues, at least with current multidimensional scaling methods. However, those models are not the only way to summarize the votes of Supreme Court justices. In the next part of this section, we describe an alternative approach to characterizing how the preferences of justices vary across legal issues, one which has advantages for the interpretation of issue-varying preferences as well as for the identification of such variation.
Unidimensional Preferences in Case Subsets
The intuition for our approach follows most naturally if we begin with an example. Consider the Supreme Court from October 1967 to May 1969. The Court handed down nonunanimous rulings on 175 cases during these 19 months. We might reasonably ask whether justices express different preferences through their dispositional votes in certain subsets of these cases. Roughly half (91) of these 175 nonunanimous votes are in the “Criminal Procedure” and “Civil Rights” categories of the Supreme Court Database. Using Poole's Reference Poole2000 optimal classification (OC) method in those 91 cases, we find that the justices are ordered from left to right as follows: Douglas, Fortas, Brennan, Marshall, Warren, Stewart, White, Harlan, Black. Applying the OC method to the remaining 84 cases, we find a justice ordering of Douglas, Fortas, Black, Warren, Brennan, Marshall, White, Stewart, Harlan. These orders are very similar, with one major exception: Justice Black is the right-most justice in the set of Criminal Procedure and Civil Rights cases but is third from the left in all the other cases.Footnote 4 This is a substantively large difference in location.Footnote 5 Put directly in terms of voting, the most common coalitions of justices in these two issue areas during this period of time are different from the most common coalitions of justices in other issues areas.
In the preceding example, we have taken a set of cases, and instead of finding a single unidimensional preference ordering of justices or a multidimensional preference map of justices, we have estimated two unidimensional orderings that each apply to disjoint subsets of the cases, with the subsets defined by an auxiliary source of data about which cases share certain similarities (an expert coding of the subject of individual cases). Our approach, which we describe fully in the third section, simply takes this logic much further. We allow for different orderings in every case.Footnote 6 For each case, the estimated ordering depends primarily on voting behavior in the set of other cases that are most substantively and chronologically proximate, given our auxiliary sources of data. Estimation details aside, this is a conceptually different way to describe preferences from that of standard multidimensional ideal point estimation. But why does it makes sense to take this alternative approach to describing the preferences of justices?
While there are technical reasons why our approach is attractive, perhaps more important is the relative ease of interpretation. On the basis of the example above, we were able to make the statement that Justice Black was more conservative relative to other justices in Criminal Procedure and Civil Rights cases than he was in other cases during the natural court running from October 1967 to May 1969. From the perspective of standard multidimensional ideal point estimators, statements of this kind—justice X is relatively liberal/conservative in some area of the law—can only be made indirectly from an analysis of the justices’ relative positions in the different dimensions combined with a considering of how a given vote divided justices in those dimensions. However, questions about variation in justices’ relative liberalism/conservatism and the identity of the Court median are both natural and common in studies of the Court.
Our quantities of interest, then, are each justice's relative propensity to vote for each of the two sides of a case in a given area of law decided at a given time. For a single case, this is a unidimensional quantity, but one for which the justices's relative ordering may not be the same for all cases. The estimation problem is one of in-sample prediction: Given all of the Supreme Court decisions other than case t, what is our best guess about the relative propensity of the justices to vote for either side in case t? To answer this question, it might turn out that justices’ decisions in all other cases are equally informative about justices’ decisions in case t. Intuitively, though, it seems more likely that some cases are more informative than others, and so they ought to have higher predictive weight for case t. In particular, we expect that cases involving similar issues or decided at about the same time would be the best indicators of the likely preferences of the justices in case t. If we have data about which cases are most likely to be relevant to predicting preferences in case t, we can can put higher weight on those cases, and assess whether in-sample prediction is improved. This is a data-driven form of “multidimensionality.” If our auxiliary data about case similarity do not predict variation in justices’ preferences, then we will recover the same unidimensional preference ordering for all cases because the same set of cases with the same set of weights are used to predict voting in all cases. We also preserve interpretability: Our estimates of the preference ordering for case t are our best guess at the relative propensity of each justice to vote in a given direction in that case, based on the most substantively and chronologically similar cases.
Estimating case-specific preferences for justices might appear to violate the spirit of ideal point estimation as a data reduction exercise. Indeed, compared to a single unidimensional ordering, our approach yields a less parsimonious description of decision making. However, our estimates are built on much more extensive information than conventional ideal point estimates: We combine the roll-call (vote) matrix with multiple sources of auxiliary data about which votes are substantively and temporally similar. Because we use richer data, the summaries of justices’ decisions that result from our approach can convey a more nuanced and accurate account of judicial decision making.
DATA AND METHODS
Data
We begin with the same matrix of justices’ dispositional votes on cases that form the basis for previous studies of Supreme Court preferences (Bailey Reference Bailey2007; Grofman and Brazill Reference Grofman and Brazill2002; Martin and Quinn Reference Martin and Quinn2002; Peress Reference Peress2009). These data are drawn from the Supreme Court Database (Spaeth et al. Reference Spaeth, Epstein, Ruger, Whittington, Segal and Martin2010). There are 4186 nonunanimous majority decisions between 1953 and 2006 for which we have all necessary data sources, which cover at least part of the careers of 29 justices. The dispositional vote for justice i in case t is coded Y i,t∈{0, 1}, where 1 corresponds to a majority vote. We exclude unanimous cases because they convey no information about the preference orderings of justices.Footnote 7 Overall, in these data, there are 25,428 majority votes and 10,728 dissenting votes.
For our approach, we also need an additional kind of data: measures of the similarity among cases. We have three kinds of similarity measures between any pair of Supreme Court decisions: one temporal and two substantive. The first measure is the number of years between two decisions T t,t′, which is drawn from the Supreme Court Database (Spaeth et al. Reference Spaeth, Epstein, Ruger, Whittington, Segal and Martin2010). We use years, rather than a smaller unit of time or the ordinal ordering of decisions, because we do not expect justices to change their doctrinal perspectives on time scales shorter than a year.Footnote 8 Various factors, including the nature of the decisions themselves, can influence precisely when cases are officially decided within a term, which could induce biases if we tried to use a more finely grained measure of temporal similarity.
The second (dis)similarity measure is a three-level distance measure derived from expert codings of the substantive issue at hand in each case. The Supreme Court Database assigns to each case an “issue” and “issue area” code, which identify the primary substantive legal questions at stake in each case. The broader “issue area” is a 13-category classification; within each of these areas there are varying numbers of narrower “issues.” We convert these issue areas and issue codes into a trichotomous measure of distance, I t,t′. If two cases are in the same issue, I t,t′ = 0; if they are in the same issue area but not the same issue, I t,t′ = 1; and if they are in different issue areas, I t,t′ = 2. We explored separating this into two binary distance measures, but found that there was negligible gain from the more flexible model.Footnote 9
The third (dis)similarity measure makes use of data on citations between majority opinions, which is based on Shephard's citations (a database maintained by LEXIS which identifies all citations among Supreme Court opinions).Footnote 10 Where each case is a network node, each citation forms a direct link between two of those nodes. By calculating the minimum number of these links required to travel between case t and case t′, we generate a citation network distance measure C t,t′.Footnote 11 For example, to reach the search and seizure case Mapp v. Ohio (1961) from the abortion rights case Roe v. Wade (1972), the shortest distance is two citations. One such path is via the search and seizure case Katz v. United States (1967). Katz cites Mapp as an important precedent in search and seizure jurisprudence. Roe then cites Katz as one of several cases in which the Court recognized a constitutional right to personal privacy not explicitly indicated in the text of the Constitution. We consider chains of citation going both forward and backward in time: Katz was decided after Mapp and before Roe, but is considered to be one unit of distance from both cases. These three cases are all, to varying degrees, related to the issue of privacy, and so it is not surprising that they are relatively close together in the citation network. Most Supreme Court cases are connected within six degrees of citation, none is further than eight, and nearly the entire network is connected.Footnote 12
Kernel-weighted Optimal Classification
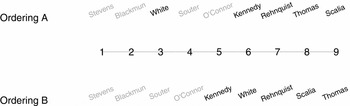
To combine these sources of information about preferences (justices’ votes) and about case similarity (year, Spaeth issue, and citation network distance), we use a variant on optimal classification techniques. In one dimension, optimal classification is based on a spatial voting model in which the justices are arranged in rank order from left to right. Each vote is characterized by a cutting line that separates voters who are predicted to vote one way from voters who are predicted to vote the other way (Poole Reference Poole2000). Figure 1 shows an example of two possible rank orderings for a single case—in this instance, Zobrest v. Catalina Foothills School District. The justices in the majority are given in black, and the justices in the minority are given in grey. The top example, “Ordering A,” shows a rank ordering with one misclassification. If we try to divide the justices in the majority from those in the minority, the best we can do is to have one misclassification—Justice White is placed within the minority in the ordering, but voted with the majority. The bottom example, “Ordering B,” shows a rank ordering with no misclassifications. We can perfectly divide the justices into the majority and minority. As this example makes clear, there are many possible rank orderings that yield the same number of misclassifications for a single case.
Example Rank Orderings Using Optimal Classification, Zobrest v. Catalina Foothills School District (1993)
Note: Figure shows two possible rank orderings for the nine justices deciding Zobrest v. Catalina Foothills School District. Ordering A shows an ordering with one misclassification; ordering B shows an ordering with no misclassifications. Names in grey are justices in the case minority; names in black are justices in the case majority.

The goal of optimal classification is to find a single rank ordering for the justices that minimizes these types of misclassifications across a set of votes. Typically, this kind of procedure treats all votes equally, minimizing the total integer number of misclassifications, regardless of which votes they occur on. However, it is also possible to estimate an optimal preference ordering based on a procedure that minimizes weighted misclassifications: treating misclassifications on certain votes as more important than those on other votes. Bonica (Reference Bonica2010) introduced this idea to the study of roll-call voting as a way of generating time-varying preference estimates. Bonica uses a kernel that puts more weight on avoiding misclassifications in more chronologically proximate votes, yielding an estimator that recovers different unidimensional orderings for different moments in time as the set of cases receiving the most weight changes. We extend this approach to the problem of estimating preferences that vary across both time and issues. Our approach is to use a kernel that weights votes in other cases not just by their chronological proximity but also by their substantive similarity. In addition to assessing temporal variation in judicial preferences by using a kernel weighting function that discounts misclassifications in chronologically distant cases, we assess variation in judicial preferences across legal issues by using a kernel that also discounts voting behavior in cases that are distant in our two issue measures. This enables us to generate estimates of the preference ordering that are particular, or localized, to each case in our data set. Thus, in describing the estimation procedure, we will frequently refer to estimates for “the case under consideration” to reference the particular case for which we are estimating a rank ordering.
Kernel Weighting
To weight misclassifications, we use the following exponential product kernel function:Footnote 13
 \begin{equation}
w_{tt^{\prime }} = \left\lbrace \begin{array}{@{}l@{\quad }l@{}}0 & \mbox{if } t = t^{\prime }, \\
\alpha ^{I_{t,t^{\prime }}} \cdot \beta ^{C_{t,t^{\prime }}} \cdot \tau ^{T_{t,t^{\prime }}} & \mbox{if } t \ne t^{\prime }. \end{array}\right.
\end{equation}
When estimating the ordering in case t, the votes in every other case, t′, receive a weight, w tt′, corresponding to their substantive and temporal similarity. The relative degree to which the kernel discounts votes in the three dimensions of similarity is determined by three bandwidth parameters. These parameters, α ∈ (0, 1], β ∈ (0, 1], and τ ∈ (0, 1], determine the weight given to each of the three measures of similarity: issue area, citation distance, and time, respectively. For all three of these parameters, smaller values correspond to more local estimates in which justice orderings vary over small distances in the similarity measures, while higher values correspond to more global estimates in which justice orderings vary only across larger distances in the similarity measures.
To generate an intuition for this kernel function, it is useful to consider the special cases for each of the three parameters. If α = 1, the Spaeth issue does not affect the weight assigned to cases. As α gets closer to 0, cases from different Spaeth issues and issue areas are increasingly discounted when estimating the rank ordering in the case under consideration. If β = 1, the distance in the citation network does not affect a case's weight. As β gets closer to 0, more weight is put on the cases that cite or are cited by the case under consideration. If τ = 1, case weights are invariant to chronological distance. As τ gets closer to 0, more weight is put on cases that were decided in the same year as the case under consideration. Thus, when α = β = τ = 1, all cases are weighted equally. Within natural courts, this yields preference orderings that are the same in each case. In our discussion below, we often use this equal weight model as a baseline.
Estimation Strategy
In order to estimate our model, we need an algorithm that will find the justice ordering that minimizes the number of weighted misclassifications. One possibility is Poole's Eliza algorithm, which alternates between finding the best cut points and the best voter ordering. Unfortunately, this algorithm is an unreliable estimation strategy for voting bodies as small as the U.S. Supreme Court, because it can get “stuck” at suboptimal orderings when there are very few voters (see Poole Reference Poole2000; Tahk Reference Tahk2006). Bonica's (Reference Bonica2010) estimator for weighted optimal classification is based on this same optimization procedure, so it inherits the same problem if applied to small legislatures. Fortunately, the small size of the Court enables alternative approaches to optimization. Our estimation strategy is a nested optimization process, described in the following two paragraphs. The first of these describes how we find the best orderings for each case in our data, given particular values for the bandwidth parameters. The second of these describes how we find the optimal set of bandwidth parameters in order to minimize misclassifications.
For given values of each of the three bandwidth parameters, we find the optimal rank orderings for each case as follows. We start with the first case in the data and rank the justices participating in the case randomly. We then identify all other cases in which at least three justices from the target case participated.Footnote 15 We then calculate the total number of weighted misclassifications that result from each of the 18 possible cut-point locations and polarities of the ordering in each of the other cases with at least three justices in common,Footnote 16 with the weighting determined by the kernel function. Then we try every other possible ordering that can be reached by moving one justice to a new location in the ordering, and assess whether the weighted classification score improves.Footnote 17 We adopt the justice ordering that minimizes weighted misclassifications, and repeat this search for single justice moves that improve weighted classification until there are none remaining.Footnote 18 This yields our estimated ordering for the first case in the data set, and yields a count of misclassifications when applied to that case. We repeat this search procedure for every case in the data and sum the resulting integer misclassifications that result from applying the resulting case-specific estimated orderings to each of those cases. This procedure yields an integer number of total misclassifications across the entire data set, conditional on the bandwidth parameters: ϵ(α, β, τ).
Because this number of misclassifications is conditional on the bandwidth parameters, we must specify a procedure for identifying the optimal parameter values. Since we have omitted the votes in the target case from the estimation of preferences for that case, we can use ϵ(α, β, τ) as a leave-one-out cross-validation score for the in-sample predictive power of the model. In general, cross-validation methods are based on the idea of training (fitting) a model using a subset of the data and then testing the resulting estimates by predicting the remaining observations. Leave-one-out cross validation is the special case of cross validation where the withheld test data set is a single observation: The model is fit once for each observation, each time leaving that particular observation out of the data. The cross-validation score—the quantity to be minimized—is then the sum or average of the errors in predicting every observation in the data, when those observations were omitted from the estimation.
The optimal values of the bandwidth parameters involve balancing a tradeoff between our desire to use only relevant cases in estimating preferences and our need to use a sufficient number of cases in order to make reliable estimates. If the bandwidth parameters are too small, prediction will suffer because very few cases will have any weight in the estimation of the ordering for a given case, and our estimates will be noisy as a result. If the bandwidth parameters are too large, prediction will suffer because too much weight is put on cases that are chronologically or substantively distant and our estimates will not vary across issue and time as much as justices’ true preferences do. The best bandwidth parameters will be those that give the optimal level of partial pooling—the model will rely heavily on decisions in the most similar cases when there are many similar cases but rely instead on the larger pool of less similar cases when the given case has few similar cases (in terms of time and issue). However, even though cross validation imposes no additional cost over fitting the model once, because we omit case t anyway, we do have to re-estimate the entire model for every set of bandwidth parameters we wish to consider. As a consequence, computation time is a constraint on the procedures that we can use for optimization of the bandwidth parameters.Footnote 19 To keep computation time tractable, we used a hybrid procedure, beginning with a gradient descent procedure. This procedure begins with a set of start values for the three bandwidth parameters and iteratively changes each one in whichever direction reduces misclassifications. Since the number of misclassifications is an integer, this procedure eventually gets stuck, at which point we switched to a local three-dimensional grid search on a spacing of 0.01. We report statistics on how the fit of the model depends on the bandwidth parameters in the next full section.
Features and Limitations
There are three features of our model that bear brief discussion. The first concerns our assumption that orderings within cases are unidimensional. While Supreme Court cases present complex questions, the decision at hand in any given case ultimately boils down to whether to affirm or reverse the lower court. While we do occasionally observe different vote coalitions across different questions raised in a case, the fact that the court requires cases to be narrowly focused and concerned with a limited number of legal questions suggests that a unidimensional model within each case is a useful approach to modeling judicial votes. Of course, further refinements to our model are possible, in which distinct votes within a case are coded separately (Spaeth et al. Reference Spaeth, Epstein, Ruger, Whittington, Segal and Martin2010) and opinion texts are divided into distinct sections from which the relevant citation network distances are calculated.
A second, related, feature of our model is that our estimation procedure guards against overfitting by excluding the votes in a given case from the estimation of the justice ordering for that case. This is important because it provides a principled way to determine how much preference variation is present across time and issue. However, we have not found a way to generate satisfactory measures of uncertainty for our estimator. The interrelated nature of judicial decision making is a severe obstacle—both conceptually and practically—to using resampling methods to generate bootstrap uncertainty estimates. The observed cases are the exhaustive set of all Supreme Court decisions and they are fundamentally interdependent, not only through the ways that justices’ dispositional votes sometimes depend on previous court decisions, but also through the citation process. Citation distances would change under resampling, making it difficult to define an appropriate procedure that captures our substantive uncertainty about judicial preferences. Thus, while one might calculate bootstrap uncertainty estimates for our model, we have chosen not to in order to guard against misinterpretation of those quantities.
The third feature that bears discussion concerns the utility of our model for making out-of-sample predictions. Our model can easily be applied to do so, requiring only the generation of suitable proxies for the missing measures of substantive distance. With respect to the issue measure, the coding rules for this variable are publicly available and can easily be applied to any potential case coming before the court. With respect to the measure of citation distances, one could generate this measure by looking to the citation patterns in the appellate court majority opinion or briefs filed by the litigants, the sources on which much of the language and cited doctrine in Supreme Court opinions draw (Spriggs and Hansford Reference Spriggs and Hansford2002). Predicted rank orderings for such a hypothetical case could then be generated by using the resulting kernel weights given the estimated bandwidth parameters and the proxied data on substantive similarity. While we do not explore this out-of-sample prediction problem in this article, it has potential applications to studies of the court's decisions to grant certiorari (the choice whether to hear a case), as well as to predicting likely justice alignments in cases on the court's docket.
RESULTS AND MODEL EVALUATION
We now review the primary results from our estimation. Our discussion serves two purposes. First, we demonstrate systematic variation in justices’ preferences over time and across substantive areas of the law. In doing so, we are able to compare the relative predictive power of each of the sources of similarity that we have included in our estimator. We are also able to describe the extent to which different areas of the law are associated with more varied preferences and which areas of the law are associated with common preference orderings among justices. Second, through our analysis of these results, we document several well-known (and other less well-known) instances of variation in particular justices’ preferences. This evidence helps serve to establish the validity of our model.
Relative Predictive Power of Issue, Citation, and Chronological Distances
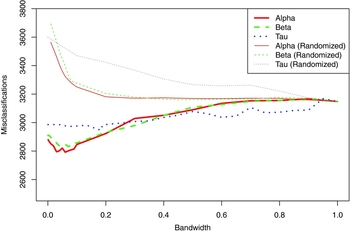
We begin our analysis by comparing the relative predictive power of the three sources of dissimilarity we included in our model. In Figure 2, we report the rate of misclassification as we vary only a single bandwidth parameter, holding the other two at 1, so that only one measure of similarity influences the estimates. The optimal bandwidths for these three models—which we refer to as Spaeth, Citation, and Time—are found at the values that minimize misclassification. The level of misclassification that we are trying to improve upon is that which occurs when α = β = τ = 1, the equal weight model in which justices’ preferences do not vary across time or area of the law (the rightmost point in Figure 2). That model results in a total of 3148 misclassifications across the set of cases we consider.
Cross Validation
Notes: The total number of misclassifications when optimizing each bandwidth parameter individually, while holding the other two at 1, using the true case data and randomly reassigned case data. When a bandwidth parameter is equal to 1, the source of similarity does not affect the rank orderings. The closer the bandwidth parameter is to zero, the less weight dissimilar cases have on the estimated rank orderings.

We find that using the Spaeth issue and issue area codes leads the the greatest reduction in misclassifications—the optimal Spaeth issue bandwidth value results in an 11.3% reduction, from 3148 to 2792. Using citation network distance leads to the second greatest reduction in misclassifications. The optimal citation network distance bandwidth value results in a 10% reduction, from 3148 to 2833. Finally, among the three, using the chronological similarity of cases leads to the smallest reduction in misclassifications. The optimal chronological bandwidth value results in a 6.5% reduction, from 3148 to 2944. In other words, preferences vary more across substantive legal issues than across time, which is a particularly striking finding given past research's prioritization of temporal variation over substantive variation.
To demonstrate that these improvements do not result from simply having a more flexible model, we randomly reassigned the case data to different cases, breaking the substantive link between the data on issue and time of decision and the data on dispositional votes. Figure 2 shows that when we repeat the cross-validation procedure for these randomized data, we see no improvements in classification for any values of any of the bandwidth parameters: more localized estimates with respect to meaningless measures of similarity only make misclassification worse. If there were no substantive information in the issue and case data, there would be no improvement in classification over the one-dimensional (1D) model, and cross validation would recover 1 for all three bandwidth parameters.
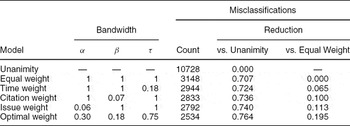
So far, we have only explored using a single measure of similarity at a time. While including information about the substantive similarity among cases seems more important for prediction than temporal similarity, using all three sources of similarity among cases provides the best estimates of justice preferences. By allowing all three bandwidth parameters to vary, our optimal weight model is able to find a set of bandwidth parameters that lead to only 2534 misclassifications. How large these improvements are depends on our point of comparison. Table 1 shows that, when compared to a very naive null model that all justices vote for the majority, the equal weight model reduces misclassifications by 70.7% (from 10728 to 3148), while the optimal weight model reduces misclassifications by 76.2% (from 10728 to 2534). Compared to the equal weight ordering, our optimal weight orderings represents a 19.5% reduction in misclassifications. This improvement in fit is driven by the fact that the distance measures we use are informative about which cases are most similar. In contrast, the model only allowing preferences to vary over time results in just a 6% reduction in misclassifications over the equal weight model.Footnote 20
Model Comparison

Note: The optimal values of the bandwidth parameters and the corresponding rates of misclassification for models that allow none, one, or all of the bandwidth parameters to vary from 1.
When optimizing all three bandwidths jointly, we find larger optimal values for each of the bandwidths than we do when we optimize a single bandwidth while setting the others to 1. This is so for two reasons. First, the issue and citation distance measures are capturing some of the same information about which cases are related. Consequently, when both are included, the model relies less on each of these measures to identify predictive cases. Second, the more localized our estimates become, the smaller the number of cases that are being used to predict case t. Eventually one reaches the point where almost all the information is being drawn from just a few cases, and the predictions begin to become less accurate. When we weight misclassifications on three distances instead of one, we cannot be as aggressively local in each dimension without running out of cases to predict case t.
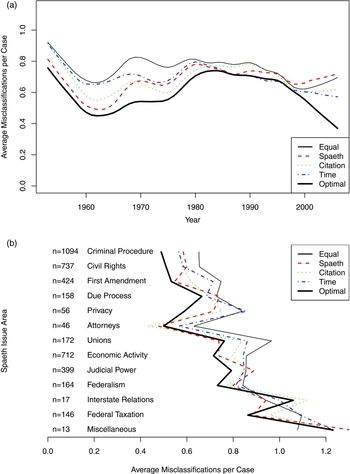
Where do our optimal weight estimates improve fit the most? Figure 3 breaks the misclassification improvements down by time and Spaeth issue area. In the top panel, we see the rate of misclassification over time. Until about 1990, incorporating substantive similarity among cases reduces misclassifications more than temporal variation, but in the most recent five years incorporating temporal variation is a greater source of misclassification reduction. However, at almost all times, the optimal weight estimates (allowing variation across both time and issue) outperform the estimates that use less information. The optimal weight model improves our predictions most during the 1960s and 1970s, less so during the 1980s and 1990s, and increasingly so again during the early 2000s.
Misclassification Rates by Time and Issue
Note: Misclassification rates for models that incorporate zero (Equal), one (Speath, Citation, Time), or all (Optimal) distance measures. The top panel shows the rate of misclassifications per decision over time. The bottom panel shows the rate of misclassifications per decision for each of the 13 Spaeth issue areas.

In the bottom panel of Figure 3, we find a similar pattern across Spaeth issue areas. Only in the very small categories of “Attorneys” cases (46 cases) and Interstate Relations cases (17 cases) is the optimal weight model inferior to other models.Footnote 21 Our estimate performs worse in these areas because the bandwidth values that are optimal across the entire data set are too localized within these areas where there are few cases. In general, we find evidence that the justices’ preferences vary across substance more than time, but also that the best estimates are those that allow for both substantive and temporal variation in preferences.
Finally, it bears noting that while the mix of cases the court hears varies over time, the representation of each issue area on the court's docket does not change enormously. Criminal Procedure cases almost always constitute the plurality of the court's docket, with Economic Activity, Civil Rights, and Judicial Power representing the next largest classes of cases. First Amendment cases are the major case of an issue area changing in relative frequency: Such cases constituted 10–20% of the court's docket during the 1960s and 1970s but were consistently less than 10% of the court's docket during the 1980s and 1990s. The First Amendment category is one where both Spaeth distance and citation distance reduce misclassifications by a relatively large amount, but the declining number of cases in this category is only partially responsible for the lesser gains in predictive performance after the end of the 1970s.
Issue- and Time-variation in Justice Preferences
We now turn to a consideration of how individual justices’ preference vary across time and substantive issues. Consider as an example Katz v. United States (1967), which was a turning point in modern search-and-seizure doctrine. Katz overruled the widely applied precedent Olmstead v. United States (1928) that electronic eavesdropping did not constitute a search under the Fourth Amendment. The Katz majority was nearly unanimous, with just a lone dissent from Justice Black, who argued for a limited view of the Fourth Amendment's protections. Thus it may seem surprising that Justice Black, an FDR appointee and relatively liberal justice, would have supplied the lone vote and lone voice for a kind of argument more typically made by conservatives. However, that Justice Black was was distinctly unsympathetic towards convicted criminals and more conservative on issues of criminal procedure and civil rights is well known (e.g., Newman Reference Newman1997). Our analysis confirms this qualitative account of Black's world views. While our equal weight model puts Black near the far left of the court, our optimal weight estimates put him near almost the far right end in this particular case.
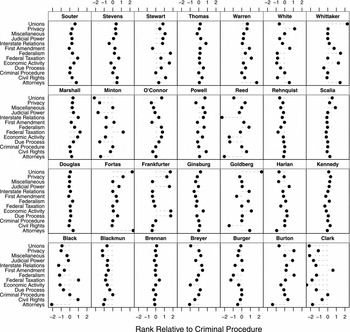
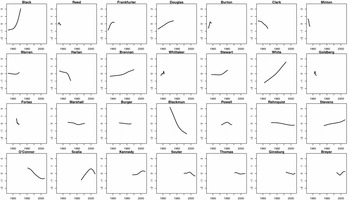
Understanding why Black's vote and argument in this case vary so starkly from his general spatial position on the court requires taking into account both time variation and issue variation. In order to summarize this kind of variation in individual justices’ ranks across cases, we estimate additive models that decompose case-specific justice ranks into marginal effects of issue, composition of the court, and time. For each justice, we estimate a separate regression model, in which the dependent variable is his or her rank in each case, and the independent variables are indicator variables for each other justice's presence on the court (accounting for the effects of membership changes on justices’ ranks), the Spaeth issue areas (accounting for differences in justices’ ranks by legal substance), and a spline term for the year of the case (accounting for the temporal shifts in justices’ ranks). Figure 4 plots the coefficients from these models associated with Spaeth issue areas, while Figure 5 plots the coefficients from these models associated with time.
Preference Ranks for Each Justice by Spaeth Issue Area, Relative to Criminal Procedure (the Largest Category)
Note: Points indicate average rank in each issue area, relative to the justice's rank in Criminal Procedure cases; negative values indicate more liberal rank; conservative values indicate more conservative rank. These estimates are adjusted for replacements on the court and justice-specific time trends using a generalized additive model. There are insufficient cases to estimate this model for Justice Jackson.

Time Trends in Justice Ranks
Note: Trends estimated by spline fit in an additive model for each justice's ranks. Other variables in the additive model are dummy variables for each Spaeth issue area and dummy variables denoting the presence of each of the other justices on the court.

Consider first Figure 4, which shows that a variety of patterns of issue variation are present in the data. While Justices Brennan, Douglas, and Scalia vary little in their preferences across issues, this is not true for all Justices. Justices Black, Clark, Goldberg, and Reed, as examples, have preferences that vary considerably over the range of issues before the court. Justice Clark was markedly more conservative on issues of civil rights and criminal procedure than on other issues, such as economic activity and unions. While traditionally considered a moderate, examination of his record demonstrates that he simply did not have positions that mapped cleanly onto traditional left-right politics. A similar pattern emerges when we consider Justice Reed, who was further to the left on issues of interstate relations, economic activity, and due process and further to the right on issues of privacy, criminal procedure, and civil rights. Perhaps because of lack of a consistent ideological position across issues, Reed was generally considered a moderate during his 19-year tenure on the court, holding views comparable to those of Robert Jackson. Finally, we see in Figure 4 that Black was at his most conservative in civil rights cases (like Katz).
Crucially, these findings reveal a pattern that substantive scholars of the courts will not find surprising, but one which has eluded quantitative characterizations of judicial preferences. Judicial preferences vary considerably across substantive areas of the law for most justices, not just for a select few.Footnote 22 While some judges fall in the same ideological location on the court across all areas of the law, most of the justices exhibit considerable cross-issue variation. Indeed, as we show below, even the most critical median justices seem to oscillate in and out of that pivotal seat across areas of the law.
Turning from variation across substantive questions to temporal variation in judicial preferences, while the cross-validation results reported earlier show that time variation explains a smaller fraction of deviations from an equal weight model than does issue variation, we do find evidence of some justices’ preferences shifting over time. Figure 5 plots the marginal effects for time, net of the additive effects for case issue area, and the additive effects for court composition. Our estimated time trends are much more limited than those found by Martin and Quinn (Reference Martin and Quinn2002) because our preference estimates are ordinal rather than cardinal. Martin and Quinn find large cardinal movements of individual justices, particularly for justices that are far from the center of the court. Such movements typically involve no justice pairs crossing, which are the only movements that are identified nonparametrically. Such cardinal movements may result from the fact that under an IRT model, the absolute location of the most extreme justices is poorly identified by the data, which makes the location of such justices very sensitive to the assumption that the distribution of case parameters is constant over time. Because our estimates are ranks, when we observe a time trend for a justice, it implies that justice has passed another justice from left to right or right to left.Footnote 23
The three largest shifts by individual justices are that of Justice Black at the end of his career on the court, that of Justice Blackmun at the beginning of his, and that of Justice White over his whole career. That Justices Black and Blackmun shifted during their careers is a finding that is corroborated by both qualitative accounts of the justices’ tenures (e.g., Greenhouse Reference Greenhouse2005; Newman Reference Newman1997) as well as quantitative ideal preference measures (Bailey Reference Bailey2007; Martin and Quinn Reference Martin and Quinn2002). The conservative shift we identify for Justice White, by contrast, is comparable to the trend identified in Bailey (Reference Bailey2007) but inconsistent with the lack of movement identified by Martin and Quinn (Reference Martin and Quinn2002). Of course, what constitutes remaining at a constant position in the context of a changing law and a changing docket is not well identified, whether one applies our estimation approach or any other that does not substantively anchor the spatial scale over time. Thus, in the case of Justice Blackmun, while we observe him shifting to the left, we also see rightward shifts in rank during the same period for several of the Justices that Blackmun passed from right to left: Stewart, White, and, to a lesser extent, Stevens and Powell (though for the latter, the effect is masked by Powell's shift to the left of White late in their careers). It is important to note that, based on the rank information, we could just as easily interpret these as rightward shifts by the justices Blackmun passed, in fact Justice White shifted rightwards past other justices as well as Blackmun.
Every Justice is the Median Justice Sometimes
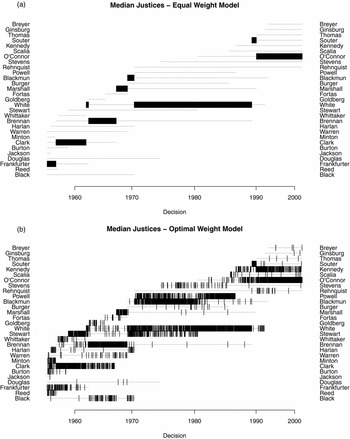
Variation in justices’ preferences across substantive issues results in case-to-case fluctuation in who serves as the median justice. Figure 6 shows the identity of the median justice over time, for the equal weight estimates (α = β = τ = 1) and the optimal weight ideal point estimates allowing variation across issue and time. Each vertical tick mark is a single case. A point's location along the x axis shows its place in time, and its location along the y axis shows the median justice for that case. Thus, starting at the left side of the top panel, we find that using the equal weight model, Felix Frankfurter was the median justice; subsequently, Tom Clark became the median justice and remained so until Byron White's first, brief period of time as median justice. By the time we reach the right-hand side of the figure, we see that Sandra Day O'Connor was the median justice throughout the 1990s and early 2000s. These results (assuming constant preferences across issue and time) are nearly the same as the within-natural court medians found by Grofman and Brazill (Reference Grofman and Brazill2002) using slightly different methods. However, a number of striking findings stand out. For example, neither Justice Powell nor Justice Kennedy is ever the median in the equal weight model, despite their widely documented roles as pivotal members of the court in some high-profile cases.
Identity of Median Justice, Case by Case
Note: Each vertical tick mark identifies the median justice in a single case. The x axis shows the date of the case's decision, and the y axis indexes individual justices. The top figure shows the identity of the median justice over time (spaced by decisions) when the bandwidth parameters are constrained to give all cases equal weight in estimation regardless of substantive and temporal distance. The bottom figure shows the same information for the optimal weight model that weights substantive and temporal distance optimally for prediction.

The bottom panel shows, by contrast, the case-specific estimates of the median when we allow for variation across issue and time. A striking feature that emerges here is that while some justices are much more often the median justice than others, every justice in the data set is the estimated median justice for at least one case. We know from the simple fact that all sorts of coalitions of justices occur at least occasionally that it is likely that every justice is the pivotal justice in terms of dispositional preferences at least sometimes, and we are actually able to recover this in our estimates. An obvious question to ask is whether the unusual medians make sense. Consider, for example, the set of cases where we estimate that Justice Scalia is the median justice. The first thing to observe about these cases is that they are not especially clustered in time: They are spread throughout Scalia's time on the court. As we will discuss below, Scalia is an occasional median due to issue, rather than temporal, variation. In contrast, Justice Marshall was frequently the median early in his career, but the court moved to the right due to changes in the court's membership and by the end of his career Marshall almost never was the median.
Perhaps more critically, we find evidence of frequent median status for those justices who are known to have been pivotal members of the court. For example, during the 1970s, we see that Justices Powell, Blackmun, White, and Stewart all served as pivotal justices with regularity, a finding that comports with conventional understandings of the power dynamics on the court during those years. Indeed, as Whittington (Reference Whittington and Tomlins2005, 306) notes, Potter Stewart often found himself in the minority during the latter years of the Warren Court (1960s) but exercised considerable influence at the center of the court during the Burger Court. This is precisely the pattern that emerges in Figure 6. Similarly, through the 1990s and 2000s, we find that Justices O'Connor and Kennedy are both frequently median. Popular observers of the court widely noted the way O'Connor and Kennedy shared power during those years (e.g., Lane Reference Lane2006; Lithwick Reference Lithwick2006).
Figure 7 shows the frequency of median status for each justice, as a function of issue area instead of time. Each justice is represented along the y axis, and each issue area is represented along the x axis. For each issue area, the height of the bar indicates the frequency with which he or she was the median justice in that issue area.
Frequency of Median Status, by Justice, by Issue Area
Note: Bars indicate frequency of median status in cases for each justice in each issue area.

The variation in the identity of the median justice across areas of the law is visible in comparisons of justices whose tenure on the court overlapped significantly. Consider again Justices O'Connor and Kennedy. As we saw in Figure 6, both were regular medians during those years. Which justice was median depended in part on the issue area of a given case. We see in Figure 7 that Justice O'Connor was especially likely to be the median in Privacy, Criminal Procedure, Civil Rights, First Amendment, and Judicial Power cases. Justice Kennedy, by contrast, was most often the median in Economic Activity and Federal Taxation cases. Importantly, and as noted above, there is considerable variation in the extent to which each of these issue areas occupies the court's docket. Federal Taxation and Privacy cases are a very small fraction of the court's docket, while Criminal Procedure, Civil Rights, and First Amendment cases represent a much greater proportion. Indeed, we see in Figure 7 that Justice O'Connor was more likely to be the median than Justice Kennedy in the areas with the most cases (those areas to the left end of the x axis), which is why O'Connor is identified as the median in analyses that ignore issue variation. At the same time, we also see that Justices Powell and Blackmun alternated as median justices across issue areas. Justice Powell was most likely to be the median in Criminal Procedure, First Amendment, and Privacy cases, while Justice Blackmun was the pivotal member of the court in Union, Economic Activity, and Judicial Power cases.
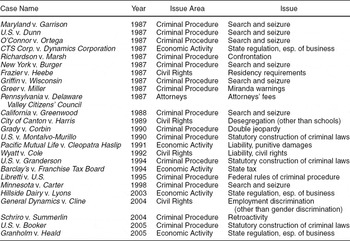
Finally, consider the relatively liberal Justice Breyer and relatively conservative Justice Scalia. Given their perception as relatively extreme justices, it may have been striking that we found above in Figure 6 that each of them had been the median justice in at least one case. Though, as we also see in Figure 6, they are medians in only a small handful of cases, we see in Figure 7 where these justices have had the opportunity to serve as the median. Table 2 lists the 25 cases in which Justice Scalia is estimated to be the median justice. Interestingly, these cases are concentrated in a few specific issues. In particular, if Justice Scalia is to be the median justice, it is disproportionately likely to be in the issue area of Criminal Procedure (15 cases), particularly on the issue of Search and Seizure (7). Five times, Scalia was the median in Economic Activity cases, four times in Civil Rights cases, and once in an Attorneys case. Many of these cases occur early in Scalia's tenure, before a rightward drift through the 1990s and the appointment of more liberal justices Souter, Ginsburg, and Breyer. However, throughout the 1990s and early 2000s, Scalia has been pivotal in Criminal Procedure and Economic Activity cases. In the even rarer instances where Justice Breyer has had the opportunity to serve as the median, it has been in cases involving the First Amendment. Indeed, Justice Breyer is known to be more conservative (and thus closer to the center of the court) in cases involving freedom of speech than other areas of the law. For example, we estimate Justice Breyer to be the median justice in Turner Broadcasting v. FCC (1997), a 5-4 case in which he joined Chief Justice Rehnquist and Justices Kennedy, Stevens, and Souter in the majority, but wrote his own concurring opinion that hinted he was sympathetic to the dissenters’ positions on some issues.
Cases in which our Optimal Weight Model Estimates Scalia to be the Median Justice

Note: Table shows names of cases, the years the cases were decided, the Spaeth Issue Area assigned to the case, and the Spaeth Issue assigned to the case.
In sum, the cross-issue variation in the identity of the median justice comports with conventional understandings of the justices’ varying influence across areas of the law. However, our analysis also yields results that were not anticipated, such as the finding that every justice has served as the pivotal voter at least once. The substantial and measurable variation in the identity of the median justice across contemporaneous cases implications for several theoretical and empirical puzzles in the judicial politics literature.
IMPLICATIONS
The preceding analysis demonstrates that the estimation approach we have advanced can recover well-documented patterns in judicial preferences that were previously not capable of being studied systematically. What is more, the analysis also documents new, systematic patterns in which preferences vary across areas of the law and over time. However, our analysis has still further a series of implications for previously unexplored elements of judicial decision making and power. Perhaps most critically, the analysis reveals that judicial preferences are simultaneously systematic and predictable but also variable across substantive areas of the law. In other words, to repeat from above, judicial preferences over law and legal doctrine cannot be succinctly represented as simple left-right ideology. While some contemporary research on rule making in the courts has been concerned with the theoretical problems associated with multidimensionality within a case (e.g., Lax Reference Lax2007), our analysis reveals that judicial politics is both dynamic and multidimensional across cases. This insight opens the door to a number of previously unexplored features of judicial power and provides an invitation for new kinds of theorizing.
Nominations and Confirmations
Among the substantive problems for which our analysis has implications, the most direct is the politics of Supreme Court nominations and confirmations. While the subject of Supreme Court nominations and confirmations has received a great deal of attention, one of the fundamental findings that permeates all such studies is that modern Supreme Court confirmation decisions are largely shaped by anticipations about what the nominees’ policy views are and, by implication, what affect they will have on the court's ideological orientation (e.g., Caldeira and Wright Reference Caldeira and Wright1998; Cameron, Cover, and Segal Reference Cameron, Cover and Segal1990; Kastellec, Lax, and Phillips Reference Kastellec, Lax and Phillips2010). Our analysis sheds new light on the dynamics of this process and raises a theoretical nuance that has not previously been treated in the literature. For example, because of the primacy of the median justice for the court's decision making, the stakes of a given Supreme Court nomination may be thought to hinge on the effect that the nomination will have on the location of the median (Krehbiel Reference Krehbiel2007).
However, our analysis reveals that any given nomination can do more (or less) than simply move a median—a nomination may move a median in a small or large number of cases; it may collapse power from a set of medians into a single median; it may spread power from a concentrated median to a diffuse set of medians. As a consequence, there are more complicated dynamics involved in the selection and confirmation of a Supreme Court nominee than simply whether he or she is to the left or right of the current median. For example, when Justice Stewart, who was one of the three or four different medians towards the end of his tenure, was replaced with Justice O'Connor, the role of median justice was consolidated in the hands of two dominant medians—Justices White and Powell. Only later after a series of appointments did O'Connor emerge as a powerful median justice. Thus her nomination had both immediate and long-term impacts. In the short run, her presence on the court reduced Blackmun's frequency as the median justice, consolidating power in the hands of moderates Powell and White. In the long term, she emerged as a pivotal voter on a newly conservative court through the 1990s.
Given the central role that interest groups play in Supreme Court confirmation politics (Caldeira and Wright Reference Caldeira and Wright1998) and the specialized interests that these groups have, these dynamics raise important questions about how presidents and senators can evaluate the consequences of a nominee. Any given source of information is likely to be limited to a certain sphere of cases; few if any sources of information may be able to put the different consequences together to convey a complete picture of the effect a given justice may have in future cases. Indeed, that individual justices are differentially pivotal across areas of the law implies that there may be strategic incentives for interest groups participating in the nomination and confirmation process to work together (or to work against each other) despite the interest groups’ divergent interests (or seemingly aligned interests). Moreover, as we have seen, a given justice's past record may be consistently liberal or conservative within the range of previously observed decisions, but that may not be an effective predictor of how the justice will decide cases once faced with the wider range of topics he or she will confront on the Supreme Court. Such dynamics may explain some of the “surprises” that past presidents have had when justices turn out to be more liberal or conservative on particular issues than was anticipated at the time of their nominations.
Logrolling and Judicial Decision making
That the justices have different preference orderings over distinct legal issues raises a host of theoretical issues related to preference aggregation and judicial decision making previously not considered in the judicial politics literature. While logrolling is a subject that has received considerable attention in the legislative politics literature, the institutions and incentives at the heart of that literature have not previously fit with scholarly understanding of judicial institutions and preferences. Our analysis reveals that while the institutions may be different in the context of courts, judicial preferences are heterogeneous across topics in predictable ways, allowing for the possibility of more complicated bargaining dynamics. While the court does not operate in such a way that might allow for explicit vote trading or logrolling (i.e., cases are not decided in packages together, which undermines the ability to credibly commit to a logroll), previously unappreciated bargaining dynamics may arise given the long-run nature of judicial relationships, the nearly complete control the court has over which cases to hear, and the institutionally unconstrained nature of judicial decision making.
As a consequence, perhaps one of the most significant implications of our analysis is that it opens the door to questions about the nature of judicial bargaining that have not been examined in the literature. When power is spread across many medians, for example, different incentives arise concerning the choice to hear a case, because the likely outcome of a case is surely a function of the preferences of whomever finds him- or herself at the center of the court on that particular case. By contrast, when power is concentrated in a single, dominant median justice, the politics of case selection likely becomes less contentious. We leave it to future scholarship to more directly develop these theoretical implications; we raise them only to highlight the types of questions that have been overlooked in light of the past focus on unidimensional understandings of judicial preferences.
Strategic Litigation
A third substantive problem for which our analysis has important implications is one that remains understudied in the judicial politics literature. While a great deal of the qualitative literature on social reform has contemplated how the courts can be used to achieve policy changes, political scientists have paid less attention to how policy-motivated litigants can strategically shape their litigation strategies to achieve their goals through the courts (for a notable exception, see Baird Reference Baird2007). Nevertheless, the topic of strategic litigation has been one of interest to economists and economically oriented lawyers studying litigation (deFigueiredo Reference deFigueiredo2005; Yates and Coggins Reference Yates and Coggins2009). The preceding analysis suggests a series of important lessons for studies of strategic litigation. First, how an issue is framed can affect who plays a critical role on the court for a given case. For example, during the 1970s, a case framed as a criminal procedure case would more likely depend on the view of Justice Powell than if it were framed as a civil rights case, in which Justice White would have been the more likely median justice. Similarly, during the 1990s, a strategic litigant bringing a privacy case would have to cater more to the views of Justice O'Connor than a litigant with a federal taxation case, where Justice Kennedy was the more likely median. Because special interests seeking social change may have the choice to bring their issue to the court in any one of a series of contexts, this information can be critical to those interests. We expect that future studies of strategic litigation should incorporate the multidimensional nature of judicial preferences into the framework in which litigants choose not just which cases to bring but how to bring those cases.
Beyond the Supreme Court
While the tool we have developed here leverages data sources that are particular to the U.S. Supreme Court, the key to generating judicial rank orderings that vary across legal issues is the use of some auxiliary information about which votes are most similar. Because citation is a feature of legal decision making more generally, our method could be used to study other courts as well. With comparable sources of information about citation networks, one could directly apply our model to other multimember courts including the U.S. Courts of Appeals; the European Court of Justice; the European Court of Human Rights; or high courts within other countries, such as the new Supreme Court in the UK. More generally, there is nothing peculiar to judicial decision making about our approach: It is the similarity data rather than the method that is application specific. Multidimensional kernel-weighted optimal classification is applicable to a number of other substantive institutions of interest. This is especially valuable for moving beyond unidimensional study of other small voting chambers, from city councils to the United National Security Council. Data on the timing of votes is always available, so the task for researchers is to identify appropriate measures of substantive similarity between votes. These could be the countries involved in a negotiation, the industry being regulated, or the constitutional power being exercised by a legislature, to give just a few examples. Methods for computing relative similarity of texts, such as cosine distance and latent semantic analysis, may be useful in generating appropriate measures without manual coding from the various documents that often accompany voting decisions.
CONCLUSION
While contemporary theoretical and empirical studies of the Supreme Court widely adopt a unidimensional model of judicial politics, scholars are consistently confronted with qualitative accounts of judicial preferences varying across substantive legal issues. As the field of judicial politics moves in the direction of studying the interaction between policy preferences and the law, it is increasingly important that our analytic tools evolve to enable scholars to study the complexities of judicial preferences. Perhaps nowhere is this need as clearly felt as in the estimation of ideal points. Many studies have led in recent years to powerful insights using latent variable models—particularly, IRT models—to estimate judicial preferences. However, especially in the context of judicial decision making, where there are only a few votes in each case, existing tools are not well suited to studying variation in judicial preferences beyond a single dimension.
By reformulating the problem of describing how preferences vary across issues, we have proposed an alternative approach that mitigates some of the theoretical and practical limitations of IRT models. Perhaps most important, the technique we have developed allows us to investigate how judicial preferences vary across both areas of the law and over time. Our approach allows us to demonstrate that there is much more to Supreme Court justices’ dispositional voting behavior than a single left-right political dimension that applies to all legal issues. Justices’ vary in their expressed doctrine across areas of the law in ways that we can understand and characterize. What is more, we believe recognizing that judicial preferences vary substantially across substantive topics gives rise to a series of understudied political dynamics involving the court.
While we have developed our method in the context of judicial decision making, our estimation approach is also applicable, with suitable modifications to address computational issues, to the study of legislative voting. For example, applications of our method to the legislative context might make use of many potential measures of which roll call votes are most closely related—committee of origin, procedural status, the texts of the proposals themselves—that each provide information about which votes are on substantively similar issues. Such an approach would be useful for characterizing how legislators’ behavior varies across different kinds of bills, just as in this article it provided a way of characterizing how judges’ behavior varied across different kinds of cases.
Finally, while the method developed in this article represents an advance over past techniques, there is more work to be done. Future research could develop probability models akin to existing IRT models that are able to capture the kinds of issue variation in preferences that we observe, while at the same time facilitating characterizations of estimation uncertainty that are not compatible with our approach. While the problems of estimating cardinal, intertemporally comparable preferences remain, methods that combine varying preferences across time and issue with anchoring data like that of Bailey (Reference Bailey2007) would help ameliorate such concerns. Such techniques could also be applied to courts at different levels of the judicial hierarchy, generating comparable estimates for the entire U.S. federal court system. In this article, we have demonstrated that there is meaningful, recoverable variation in Supreme Court justices’ preferences across issues, and we expect that this information and our approach will provide groundwork on which these broader projects can build.




Comments
No Comments have been published for this article.