Implications
Since Taurine breeds are poorly adapted to tropical environments, Brangus was developed as a composite breed to combine the adaptability, disease resistance, maternal instincts and overall hardiness of Brahman cattle with the fertility and meat quality traits of the Angus breed. Bearing this in mind, the results of this work demonstrate the enrichment of Zebuine haplotypes in the bovine leucocyte antigen (BoLA) region of Brangus cattle, probably as consequence of selection processes to promote adaptation to tropical and subtropical environments. This is consistent with the original objectives of the founder Brangus breeders and may be applied to select other Taurine–Zebuine composite breeds.
Introduction
The Brangus breed is a composite breed developed to combine the adaptability, disease resistance, maternal instincts and overall hardiness of Brahman cattle with the fertility and meat quality traits of the Angus breed. In most of the countries that currently breed Brangus cattle, the founder breed composition (FBC) has been fixed at 5/8 (62.5%) Angus and 3/8 Zebu (37.5%) (mainly Brahman). However, the Argentinian association took a different path producing animals with different fractions of Zebuine genes that go from 1/4 (25.0%) to 5/8 (62.5%). This larger fraction was the outcome of an intent to promote even better adaptation to warm and humid environments (Cantet, Reference Cantet2013). When considering a single locus, the fraction of animals with haplotypes from each breed is expected to be coincident to the average FBC. However, specific regions of the genome may present a different FBC as a result of direct (or indirect) selection or drift, and such could be the case of the major histocompatibility complex (MHC). The MHC region encodes several genes involved in the immune response in mammals. In cattle, this complex is known as BoLA and is located on chromosome 23 (BTA23: 7,013,913–28,998,760). Genetic variation in BoLA has been associated with resistance or susceptibility to several conditions such as mastitis, leucosis and parasitic infections (Takeshima and Aida, Reference Takeshima and Aida2006). These conditions cause substantial losses for ranchers, including decreased production levels, discarded products and treatment costs, thus having a substantial economic impact on the livestock sector (Martinez et al., Reference Martinez, Machado, Nascimento, Silva, Teodoro, Furlong, Prata, Campos, Guimarães, Azevedo, Pires and Verneque2006; Biegelmeyer et al., Reference Biegelmeyer, Nizoli, da Silva, dos Santos, Dionello, Gulias-Gomes and Cardoso2015).
Many statistical approaches are available to detect selection signatures using single nucleotide polymorphism (SNP) data (Gautier and Vitalis, Reference Gautier and Vitalis2012), and they are generally classified into three categories: frequency-based methods (Tajima’s D and Fay and Wu’s H), population differentiation-based methods (F st ), and linkage disequilibrium (LD)-based methods (Rsb and iHS), as reviewed by Vitti et al. (Reference Vitti, Grossman and Sabeti2013). Each of these approaches allows the user to identify footprints of selection in terms of different time scale contexts (Vitti et al., Reference Vitti, Grossman and Sabeti2013). Sabeti et al. (Reference Sabeti, Reich, Higgins, Levine, Richter and Schaffner2002) identified genetic footprints of recent positive selection in humans by analysing long-range haplotypes with a measure called extended haplotype homozygosity (EHH). This measure is defined as the probability that two randomly chosen chromosomes carrying the core allele of interest are identical by descent from the core allele to a specific distance. Under a neutral evolution scenario, a new variant will require many generations to reach a high frequency in the population, and the surrounding LD will decay due to recombination events. However, when an allele rises rapidly in frequency due to strong selection, it tends to have high levels of haplotype homozygosity extending much further than expected under a neutral model. Voight et al. (Reference Voight, Kudaravalli, Wen and Pritchard2006) proposed a within population test based on the integral of the EHH decay, called integrated EHH (iHH). They defined the integrated haplotype score (iHS) as the log-ratio of iHH estimated at the ancestral and the derived focal alleles. The iHS scores are then standardized to have a mean of zero and variance of one. The limitation of this intrapopulation test is that it has low power when the selected allele is near fixation, because it will present an integral close to zero or no integral at all. To overcome this limitation, Tang et al. (Reference Tang, Thornton and Stoneking2007) developed a similar procedure to compare EHH profiles between pairs of populations. This method, based on a measure called site-specific EHH (EHHS), consists in estimating a weighted average of the EHH at both alleles of each SNP in each population. Then, the distribution of the standardized log-ratio of the integrated EHHS (iES) between pairs of populations, which is called Rsb, is used to detect signals of selection. The advantage of this method is that it calculates IHH for the entire population instead of partitioning it into ancestral and derived alleles, which eliminates the allele frequency constraint and makes it capable of detecting selection sweeps near fixation. Besides, the comparison with another population in which the selective sweep may not have happened provides more power to the method. These EHH-based tests have been proved efficient in identifying the identification of footprints of recent selection in humans and other species (Voight et al., Reference Voight, Kudaravalli, Wen and Pritchard2006; Tang et al., Reference Tang, Thornton and Stoneking2007). For instance, signatures of artificial selection have been identified in Holstein and Jersey dairy cattle by examining the decay of EHH against other cattle breeds (Qanbari et al., Reference Qanbari, Pimentel, Tetens, Thaller, Lichtner, Sharifi and Simianer2010; Kim et al., Reference Kim, Sonstegard and Rothschild2015). Other recent studies have identified genome-wide footprints of selection in tropical-adapted cattle populations (Gautier et al., Reference Gautier, Flori, Riebler, Jaffrézic, Laloé, Gut, Moazami-Goudarzi and Foulley2009; Flori et al., Reference Flori, Gonzatti, Thevenon, Chantal, Pinto, Berthier, Aso and Gautier2012 and Reference Flori, Thevenon, Dayo, Senou, Sylla, Berthier, Moazami-Goudarzi and Gautier2014; Bahbahani et al., Reference Bahbahani, Clifford, Wragg, Mbole-Kariuki, Van Tassell, Sonstegard, Woolhouse and Hanotte2015; Xu et al., Reference Xu, Bickhart, Cole, Schroeder, Song, Tassell, Sonstegard and Liu2015). The regions identified in these works included genes involved in the regulation of the immune system, male reproductive characteristics, and skin and hair structure. To the best of our knowledge, no such studies have been conducted in the Brangus breed until now. Considering the role of BoLA genes in immune response, specific regions of this complex are expected to present evidence of selection in the Brangus breed as a consequence of positive selection towards Zebuine variants in tropical and subtropical environments. Thus, the objectives of the present study were: (1) to evaluate whether the local ancestry percentages of the BoLA region diverged from the genome-wide estimated proportion; and (2) to identify signatures of positive selection in the BoLA region and to verify whether they were recent or ancestral through a population differentiation method (F st ) and two LD-based methods: iHS and Rsb.
Material and methods
Animal samples
A total of 167 bovine samples representing the two ancestral breeds (Angus (n=45), Brahman (n=22)) and the composite breed (Brangus (n=100)) were analyses. The animals were selected by the corresponding argentine breeders’ associations (Asociación Argentina de Brangus, www.brangus.org.ar; Asociación Criadores Brahman Argentina, http://www.brahman.org.ar/) to represent the key animals of local populations according to breed pedigree data and expected progeny differences values. The Institutional Committee on Care and Use of Experimental Animals from the School of Veterinary Sciences of the National University of La Plata (Buenos Aires, Argentina) reviewed and approved all animal procedures.
DNA extraction, genotyping and quality control
Genomic DNA was extracted from venous blood, hair follicle and semen samples through organic extraction, standardized NaOH/HCl methods, and commercial kits (WizardTM Genomic DNA Purification Kit (Promega, Madison, WI, USA), DNeasy Blood and Tissue Kits (Qiagen, Hilden, Germany)). Then, DNA samples were genotyped in a GeneTitanTM platform (Affymetrix, Santa Clara, CA, USA) using the AxiomTM Bos 1 Genotyping Array r3 (Affymetrix), which contains 648 855 SNPs.
Raw data were processed using the AxiomTM Analysis Suite software (Affymetrix) and SNPs were filtered by sample (⩾97%) and SNP call rates (⩾97%). Finally, processed data were filtered by position to obtain the SNPs located in the BoLA region (BTA23: 7,013,913–28,998,760), which resulted in 5585 SNPs. SNP Annotation was performed using the Axiom_GW_Bos_SNP_1.na35.annot file (Affymetrix) and positions were assigned according to the bovine genome assembly UMD 3.1.
Genome-wide breed composition analysis
The global FBC of the Brangus samples was estimated from a subset of 4556 autosomal and evenly spaced SNPs from the Bos1 Array (available from the corresponding author upon request) through the clustering algorithm implemented in STRUCTURE 2.3.4 software (Pritchard et al., Reference Pritchard, Stephens and Donnelly2000). Since the software assumes independence in SNP data, SNPs were selected to have an approximate distance of 0.5 Mb between each other, because this is the average LD block length for many cattle breeds. The analysis was performed considering two clusters (K=2) according to the historical number of ancestral populations (Angus and Brahman). This test was executed considering an admixture model with independent allele frequencies, and a burn-in of 100 000 iterations followed by 1 000 000 Markov Monte Carlo iterations.
Local ancestry inference in the bovine leucocyte antigen region (ancestral haplotypes)
An interactive pipeline was developed using BioSmalltalk (Morales and Giovambattista, Reference Morales and Giovambattista2013) to automate the process of inference of local ancestry in the Brangus population (Supplementary Figure S1). Briefly, processed data were exported from the AxiomTM Analysis Suite software in three tabular-like files: a ‘forward strand base call’ report file and two complementary files (PED/MAP) for further analysis with bioinformatics tools. Then, reference alleles and family information columns were added to the PED/MAP, which was binarized using PLINK c1.07 (Purcell et al., Reference Purcell, Neale, Todd-Brown, Thomas, Ferreira, Bender, Maller, Sklar, de Bakker, Daly and Sham2007). Haplotype inference and missing genotype imputation were conducted using ShapeIt v2 (r644) software (Delaneau et al., Reference Delaneau and Marchini2014) with a window size of 2 Mbp and effective population sizes of 100, 106 and 150 for Angus, Brangus and Brahman, respectively.
Our pipeline software was then used to transpose the Angus and Brahman haplotypes, to format Brangus genotypes and to extract SNP positions from the MAP file. The resulting data were used as input to infer percentages of local ancestry through the LAMP-LD software (Baran et al., Reference Baran, Pasaniuc, Sankararaman, Torgerson, Gignoux, Eng, Rodriguez-Cintron, Chapela, Ford, Avila, Rodriguez-Santana, Burchard and Halperin2012). The convertLAMPLDout.pl script was used to expand the output from LAMP-LD, which is compressed using SNP intervals, into a full haplotype-like format. Results were plotted by position using the ROASSAL package (Araya et al., Reference Araya, Bergel, Cassou, Ducasse and Laval2013) in the BioSmalltalk environment. Finally, a χ 2 statistical test was applied to evaluate whether the average local ancestry proportion diverged from the global composition estimated in the previous analysis.
Signatures of positive selection
A combination of genetic differentiation and linkage disequilibrium-based methods was used to identify signatures of positive selection across the BoLA region. The genetic differentiation of Brangus was evaluated by estimation of Weir and Cockerham’s F st against Angus and Brahman. The analysis was conducted using vcftools (Danecek et al., Reference Danecek, Auton, Abecasis, Albers, Banks and DePristo2011) in windows of 3 kbp after filtering data by MAF⩾0.05. The upper 1% of the distribution was arbitrarily chosen as threshold to determine candidate regions, which were defined as two or more significant windows separated by ⩽1 Mb. Additionally, two EHH-derived statistics, iHS (intrapopulation) and Rsb (interpopulation), were implemented to identify footprints of selection in the BoLA region. These statistics were calculated using the output files from the BioSmalltalk pipeline and the rehh package for R software (Gautier and Vitalis, Reference Gautier and Vitalis2012). To compute iHS, the Brangus ancestral allele was defined as the allele with the highest frequency estimated as
 $$f\, {\equals}\, w_{{{\rm AA}}} f_{{{\rm AA}}} {\plus}w_{{{\rm Bh}}} f_{{{\rm Bh}}} $$
where w AA=0.625 and w Bh=0.375 represent the average expected proportions of Angus and Brahman ancestries in the Brangus genome and f AA and f Bh represent the allele frequencies in Angus and Brahman (Hacia et al., Reference Hacia, Fan, Ryder, Jin, Edgemon and Ghandour1999; Gautier and Naves, Reference Gautier and Naves2011). The iHS value was calculated for SNPs with MAF⩾0.05 within the Brangus population. Then, a two-tailed Z-test was applied to detect statistically significant SNPs under selection with unusually extended haplotypes of ancestral (positive iHS values) or derived alleles (negative iHS values) since the standardized iHS values were normally distributed (Supplementary Figure S2). P-values were derived as −log10(1−2|Ф(iHS)−0.5|), where Ф(iHS) represents the cumulative distribution function of the Gaussian density.
The Rsb statistic was calculated between Brangus and each of the two ancestral breeds. A Z-test was performed to detect statistically significant SNPs under selection (positive Rsb scores). One-sided P-values were derived as −log10(1−Ф(Rsb)), where Ф(Rsb) represents the Gaussian cumulative distribution function. The significance threshold was set at −log10 (P-value)=2 for both iHS and Rsb. Candidate regions were defined as two or more significant SNPs separated by ⩽1 Mb.
Identification of genes and pathways in candidate regions
Genes in the candidate regions resulting from the F st and LD-based methods were retrieved from Biomart ENSEMBL (http://www.ensembl.org/biomart) using the Ensembl Genes 87 – Cow (UMD 3.1) database and the Multiple Chromosomal Regions filter. The list of candidate genes obtained from Biomart was analysed on PANTHER Classification System (Huaiyu et al., 2016) to group and classify them according to biological process and pathway representation.
Results and discussion
Genome-wide breed composition analysis
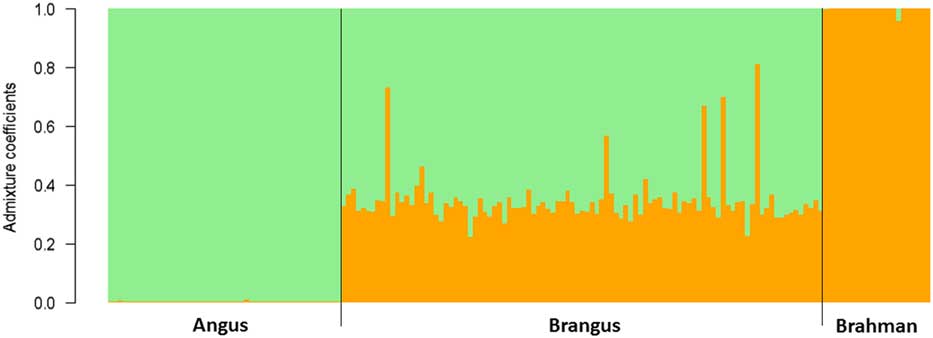
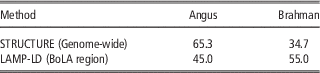
All the Brangus samples showed admixed composition in the genome-wide study conducted with STRUCTURE (Figure 1, Table 1). The average the Brahman fraction was 34.7% ±9.0% and the median value was 33.1%, ranging from 22.3% to 81.1% (Supplementary Figure S3). These results are consistent with those recently reported by Cantet (Reference Cantet2013), who detected composition values closer to 2/3 Angus (66.6%) – 1/3 Brahman (33.3%) using a microsatellite panel. The fractions are concordant with the theoretical expectation of heterosis retention for a two-breed crossbreeding system that stabilizes at 2/3 : 1/3 (Dickerson, Reference Dickerson1973; Table 1). Several conjectures about selection drift or other genetic mechanisms can be formulated based on these results, but they are beyond the scope of this article. This genome-wide value of breed composition will be considered from here on as neutral reference to specifically analyse the BoLA region on the following sections of this article.
Brangus genome-wide composition analysis. The Brahman (orange) and Angus (green) genetic fractions are shown for each individual. Values were estimated from a subset of SNP data (5K panel) using STRUCTURE software (K=2).

Average Brangus cattle composition values estimated by STRUCTURE and LAMP-LD software

Local ancestry inference in the bovine leucocyte antigen region of Brangus
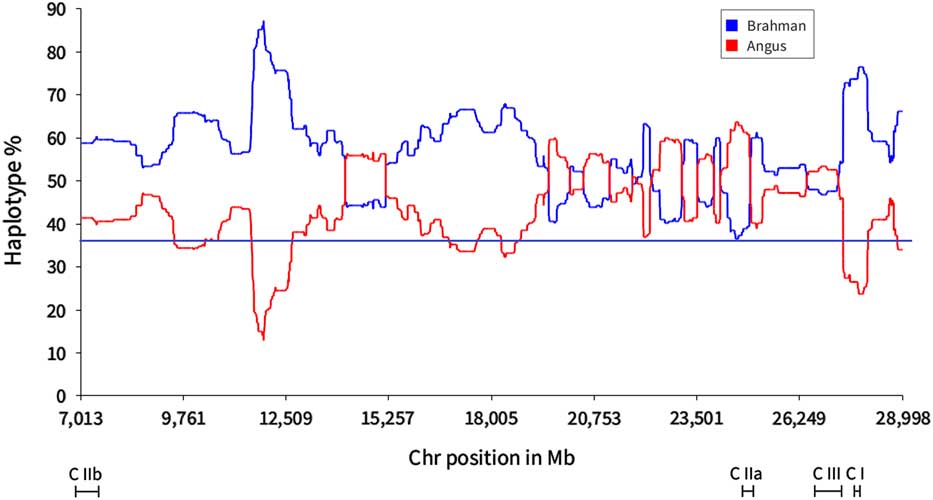
Local ancestry in the BoLA region was estimated through the LAMP-LD software. More than half of the BoLA haplotypes were inferred to be shared with Brahman (0.55±0.04), which suggests a Zebuine origin for these haplotypes. This local value was significantly different from the genome-wide proportion obtained from STRUCTURE, which was of 34.7% (P<0.01). Results are shown in Figure 2, where uneven breed origin is observed across the BoLA region. Two specific regions exhibited notable deviations (>2 SD) towards Brahman haplotypes at 10 to 20 Mbp and 25 to 29 Mbp, while the region at 20 to 25 Mbp showed a Brahman fraction more akin to the genome-wide proportion estimated with STRUCTURE. Considering the crucial role of the BoLA region in immune response, the increase in Brahman haplotypes may be reflecting adaptation to tropical and subtropical environments.
Local ancestry percentage (Angus=red, Brahman=blue) across the bovine leucocyte antigen region of the Brangus population derived from LAMP-LD software. The expected Brahman percentage (34.7%) is shown as a horizontal blue line.

Identification of selection signatures in the bovine leucocyte antigen region
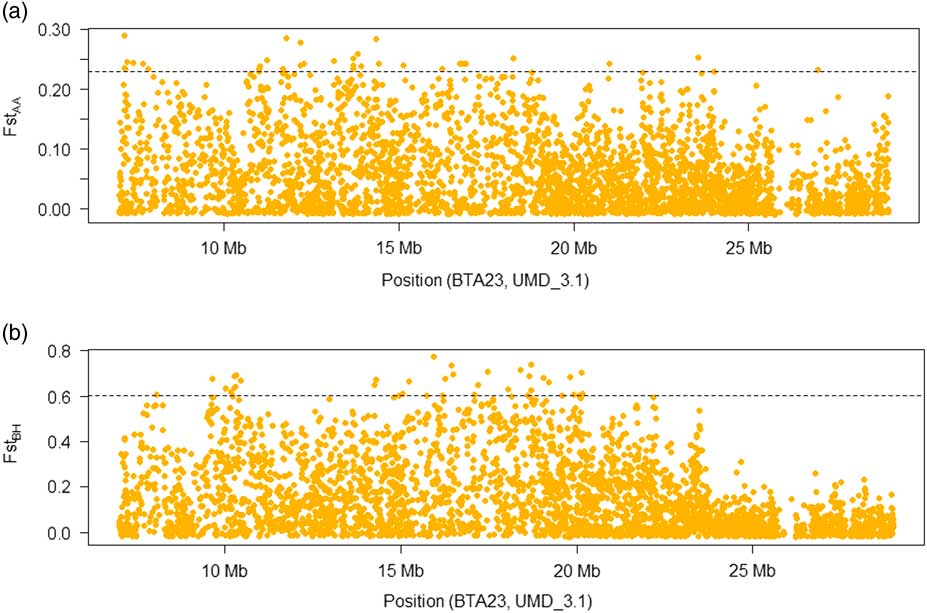
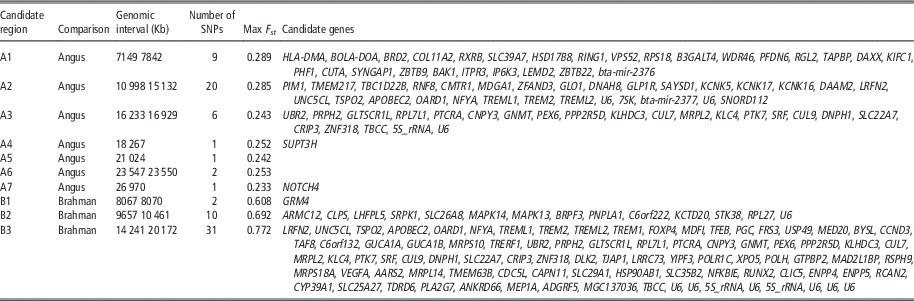
The first approach to detect evidence of selection in the BoLA region was performed via genetic differentiation (F st ) between pairs of populations. When the analysis was conducted between the two parental breeds (Angus–Brahman), the interpopulation genetic differentiation accounted for 33% of the total genetic variance (F st =0.33). These results are concordant with previous works reporting a large divergence in haplotype and allele composition between Taurine and Zebuine breeds in the BoLA region (Mikko and Anderson, Reference Mikko and Anderson1995); this difference enables the detection of selection events in the Taurine–Zebuine Brangus breed. The F st estimations for the Brangus–Angus and Brangus–Brahman comparisons resulted in weighted values of 0.06 and 0.17, respectively. Seven candidate regions were detected in the former case and three regions were detected in the latter (upper 1%; Figure 3a and b; Table 2).
Manhattan plots of the pairwise bovine leucocyte antigen region F st analyses. (a) Brangus v. Angus, (b) Brangus v. Brahman.

Candidate regions for positive selection by F st pairwise comparisons with the ancestral breeds (Brangus–Angus and Brangus–Brahman)

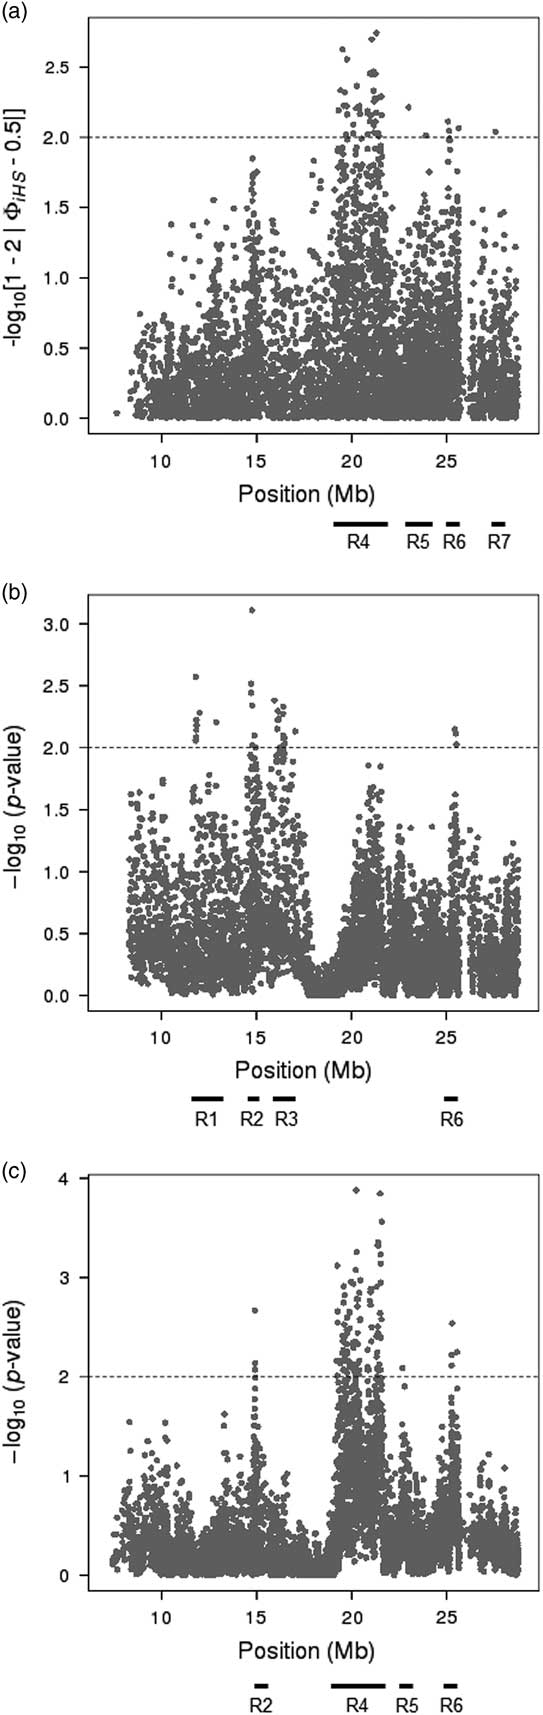
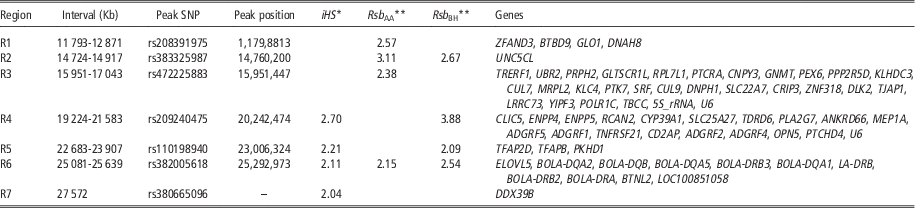
In addition, two LD-based methods, iHS and Rsb, were used to identify more recent selection signatures in the BoLA region. The results of these analyses are presented in Figure 4a, b and c and Table 3. The iHS analysis showed four candidate regions (R4, R5, R6, R7) with significantly different IHH values between the ancestral and derived alleles of the Brangus population (−log (P-value)>2) (Table 3). On the other hand, the Rsb analyses between Brangus and each of the two ancestral populations revealed six candidate regions. Of these six, four were detected against Angus (R1, R2, R3, R6) and four were detected against Brahman (R2, R4, R5, R6) (Table 3). Interestingly, region R6 showed significant values in the three tests (iHS, Rsb AA, Rsb BH), while three regions exhibited significant values for two tests: R2 (Rsb AA, Rsb BH), R4 (iHS, Rsb BH) and R5 (iHS, Rsb BH). In summary, seven candidate regions containing between 1 and 124 significant SNPs were identified in the BoLA region of the Brangus population through iHS and Rsb.
Selection signatures over the bovine leucocyte antigen region of the Brangus population detected through two LD-based methods: iHS (Brangus) and Rsb (Brangus–Angus and Brangus–Brahman). (a) Brangus iHS (−log10(1−2|Ф(iHS)−0.5|); (b) Brangus–Angus Rsb (−log10 (1−Ф(Rsb))); (c) Brangus–Brahman Rsb (−log10 (1−Ф(Rsb))).

Candidate regions for positive selection in Brangus cattle by the intrapopulation iHS and interpopulation Rsb tests (Brangus–Angus and Brangus–Brahman)

* −log10(1−2|Ф(iHS)−0.5|).
** −log10 (1−Ф(Rsb)).
The differences in the number and distribution of candidate regions obtained in the F st analysis and the EHH-based studies may be due to the nature of the analysis methods themselves, since population differentiation-based methods such as F st are best suited to detect selection events that occurred further in past, while LD-based methods are more appropriate for recent events (Ferrer-Admetlla et al., Reference Ferrer-Admetlla, Liang, Korneliussen and Nielsen2014).
Identification of genes and pathways in candidate regions
The candidate regions obtained in the F st analyses were large (five of them longer than 0.5 Mb), which led to a wide list of 143 candidate genes involved in several different biological processes. In order to obtain a global view of the types of genes or pathways that were represented within the list, PANTHER Classification System was used (Supplementary Table S1). Most of those genes participate in a wide range of different cellular (59 genes), metabolic (57 genes), and localization processes (19 genes), while others participate in the response to stimulus (22 genes) and the immune system (13 genes). In addition, 18 were assigned to specific biological pathways: as angiogenesis, T-cell activation, Ras pathway, FGF signalling pathway and Gonadotropin-releasing hormone receptor pathway, all related to the immune system. For instance, induction of angiogenesis is mediated by macrophages, which produce pro-inflammatory cytokines, endothelial growth factors (VEGF, bFGF), and proteases (MMP9) that either directly stimulate growth of new vessels, degrade tissue matrix or stimulate other cells to produce angiogenic factors. Regarding T-cell activation, the second pathway, is a crucial part of the cellular immune response; while Ras, Rac and Rho proteins play roles in regulating the functions of T and B lymphocytes and dendritic cells. Fibroblast growth factor receptors are expressed by some T-cells, and provide co-stimulation for them, and lastly, GnRH is also known to be involved in the modulation of immune system function.
Concerning the EHH-based analyses, region R6 was the most interesting region for being the only one to show evidence of recent selection in the three tests (iHS, Rsb AA and Rsb BH). It encompassed 0.55 Mb and included seven BoLA Class II genes and one BoLA Class II pseudogene. In addition, two other genes associated with immune response and fatty acid synthesis were also located in this region. This result may be a consequence of recent selection processes promoted by breeders, since several works have reported associations between BoLA Class II polymorphisms and resistance/susceptibility to infectious disease, including bovine leukaemia virus-induced lymphoma, mastitis and dermatophilosis. Moreover, BoLA has been suggested to influence other production traits such as milk yield, growth, reproduction and immune response (revised by Takeshima and Aida, Reference Takeshima and Aida2006).
Regions R2, R4 and R5 exhibited significant values for two scores (Table 3). No genes were identified within R2, but interestingly, UNC5CL (UniProtKB – E1BGH1) was located close to the downstream end. UNC5CL is involved in the TNF-alpha/NF-kB signalling pathway, which plays a role in the regulation of immune cells. Region R4 encompassed 2.3 Mb and included TNFRSF21, which is involved in the TNF and ERK signalling pathways, and two genes with G-protein coupled receptor and transmembrane signalling receptor activities (ADGRF1 and ADGRF5). R5 spanned 1.22 Mb and contained three genes: TFAP2D, TFAP2B and PKHD1. The first two genes are transcription factors that modulate different processes during development and have no clear link with immunity, but the third, PKHD1, has been suggested to have a role in immunity since its expression is upregulated in activated T-cells (Hogan et al., Reference Hogan, Griffin, Rossetti, Torres, Ward and Harris2004). The remaining regions (R1, R3 and R7) showed significant values for only one statistic index and included a number of additional genes related with the immune system (UBR2, CUL7) among others with several different functions.
The list of genes in candidate regions obtained with EHH-based analyses included 77 genes, which were then used to identify groups and biological pathways with PANTHER (Supplementary Table S2). There were 62 genes participating in the same processes: metabolic (25 genes) and cellular processes (23 genes), response to stimulus (21 genes) and immune system (17 genes). In the case of response to stimulus, cellular defense result in 12 genes (BoLA-DQA2, BoLA-DQA1, BTNL2, BoLA-DQB1, LOC101902890, BoLA-DRA, BoLA-DQB, LOC525599, LRRC73, CRIP3, BoLA-DRB3, BoLA-DQA5), while the immune system was represented by eight genes with antigen processing and presenting functions (BoLA-DQA, BoLA-DQA2, BoLA-DQB1, LOC101902890, BoLA-DRA, BoLA-DQB, BoLA-DRB3, BoLA-DQA5) and five to other immune response-related functions (ADGRF1, ADGRF5, ADGRF2, GPR115, TNFRSF21). In addition, T-cell activation pathway was the only with more than one gene detected (BoLA-DQA, BoLA-DQA5, BoLA-DQA2, BoLA-DRA). Other pathways were: EGF receptor (PPP2R5D), FGF (PPP2R5D), Gonadotropin-releasing hormone receptor (SRF), Interleukin (SRF), PDGF (SRF), Ras (SRF), Wnt (PPP2R5D) and p38 MAPK (SRF) pathways.
Class II genes, such as BoLA-DRB3, BoLA-DQA1 and BoLA-DQB, play an important role in immune response mechanisms (peptide binding and antigen presentation). It is worth mentioning that although immune response pathways were represented in both of our analyses (genetic differentiation and LD), the selected regions included genes involved in different immune mechanisms and other biologically important processes. As previously mentioned, these differences may be caused by the specific concepts exploited by each of these methods, with time scale likely having a large impact (Vitti et al., Reference Vitti, Grossman and Sabeti2013, Cadzow et al., Reference Cadzow, Boocock, Nguyen, Wilcox, Merriman and Black2014).
Several works have reported selection signatures based on adaptation to tropical and subtropical environments in the last years (Gautier and Naves, Reference Gautier and Naves2011; Flori et al., Reference Flori, Gonzatti, Thevenon, Chantal, Pinto, Berthier, Aso and Gautier2012; Kim and Rothschild, Reference Kim and Rothschild2014). The selected regions included candidate genes involved in reproductive development and reproductive functions, milk yield and composition, metabolism pathways, thermotolerance, and horn development. Furthermore, candidate genes associated with innate immune responses (Kim and Rothschild, Reference Kim and Rothschild2014) and cellular signalization of immune response (Gautier and Naves, Reference Gautier and Naves2011; Iso-Touru et al., Reference Iso-Touru, Tapio, Vilkki, Kiseleva, Ammosov, Ivanova, Popov, Ozerov and Kantanen2016) have been also reported. Our results provide additional evidence about the presence of selection signatures in genomic regions involved in the immune response in cattle. Besides, this study illustrates the relevance of using composite breeds with well-known parental populations to identify footprints of selection in livestock species (Khayatzadeh et al., Reference Khayatzadeh, Mészáros, Utsunomiya, Garcia, Schnyder, Gredler, Curik and Sölkner2016).
In conclusion, our results reveal an enrichment of Brahman haplotypes with respect to the average genome proportion in the BoLA region of the Brangus breed. Moreover, the segments under selection in the BoLA region included genes involved in immune response pathways. This may be a consequence of selection processes to promote adaptation to tropical and subtropical environments, which is consistent with the objectives of the foundation of the Brangus breed.
Acknowledgements
The authors want to thank the Argentinian Brangus and Brahman Breeding Associations and CREA Cabañas for providing us with the bovine samples. They also want to acknowledge the assistance of Dr. Egle E Villegas Castagnasso, Dr. Monica H. Carino and Dr. Diego M. Posik. This work was supported by ANPCYT, CONICET, UBA and UNLP.
Supplementary Material
To view supplementary material for this article, please visit https://doi.org/10.1017/S1751731117001380