I. INTRODUCTION
Residual stress is a stress state that exists in bulk material without application of an external load or other source of stress, such as a thermal gradient.Reference Noyan and Cohen1 The quantitative measurement of residual stress is considered significant for the reliability and integrity of industrial structures and facilities because residual stress affects subsequent fracture and fatigue behavior and stress-corrosion cracking.Reference Lu, James and Roy2
The instrumented indentation test is recognized as a measurement technique for residual stress because of its nondestructive characteristics and applicability from macro- to nanoscales.3, Reference Fischer-Cripps4 Numerous studies have been done to estimate residual stress using indentation methods. Tsui et al.Reference Tsui, Oliver and Pharr5 and Bolshakov et al.Reference Bolshakov, Oliver and Pharr6 used indentation tests and finite element (FE) analysis results to find that the indentation contact area is unaffected by applied stress at a given load. Using this result, Suresh and GiannakopoulosReference Suresh and Giannakopoulos7 developed a theoretical model to estimate residual stress in the equibiaxial stress and strain fields, which was confirmed by Carlsson and Larsson.Reference Carlsson and Larsson8, Reference Carlsson and Larsson9 Swadener et al.Reference Swadener, Taljat and Pharr10 developed another approach to determine residual stress using a spherical indenter.
To consider nonequibiaxial residual stress state, GiannakopoulosReference Giannakopoulos11 examined the influence of surface initial stresses on instrumented sharp indentation with analytic and experimental results, and Lee and KwonReference Lee and Kwon12, Reference Lee and Kwon13 have suggested a quantitative method for evaluating nonequibiaxial residual stress using a parameter of stress directionality p by modifying the influence of surface stress on the contact pressure by shear plasticity and expanding the existing equibiaxial stress model. They eliminated the pure shear stress term in the nonequibiaxial stress state and decomposed the remained stress components into hydrostatic and deviatoric stress. Since only the deviatoric stress influences the indentation load–depth curve, they proposed a quantitative equation that relates residual stress to indentation load difference:
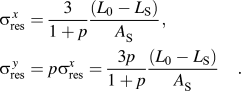
Here L 0 − L S is the load difference determined by analyzing the load–depth curves for the unstressed and stressed states at a given depth, A S is the contact area in the stressed state, and p is the stress directionality as defined by the ratio of minor to major stress components in a given biaxial stress state. If the stress directionality is not provided, the biaxial stress components cannot be resolved using Eq. (1). In this case, the Knoop indentation technique is used to measure the stress directionality.Reference Han, Lee, Lee, Choi, Lee, Kim and Kwon14
II. KNOOP INDENTATION TECHNIQUE
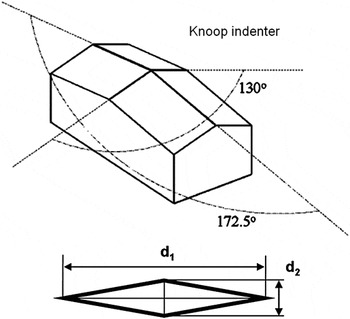
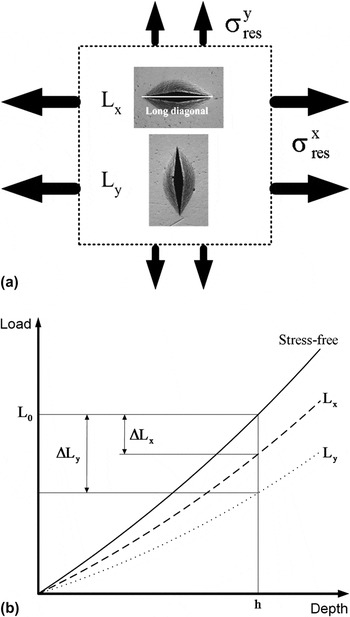
The Knoop indenter has an asymmetric shape (Fig. 1) in which the ratio of long and short diagonals of an indent is 7.11:1. When Knoop indentations are performed on a specimen in a nonequibiaxial stress state, change in the indentation load–depth curve depends on indenter orientation (Fig. 2). When the long diagonal coincides with the  direction, the load Lx attains its maximum at a given depth h. While the long diagonal coincides with the
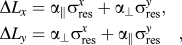
 direction, the load Ly attains its minimum due to interactive deformation behavior. When we compare these Lx and Ly to L 0 obtained in the unstressed state, the load differences ∆Lx and ∆Ly can be derived experimentally and analytically by considering the effect of each principal stress on the indentation load:
Knoop indenter shape.

Schematic representation of (a) Knoop indenting direction and (b) load–depth curve from Knoop indentation in the biaxial stressed state  .

where α ∥ and α ⊥ are the conversion factors relating the residual stress to the load difference. In previous experiments using Knoop indenter, the load difference between on the stress-free state and on the uniaxial stress state is proportional to the applied stress. The ratio of load differences can be expressed by dividing ∆Lx by ∆Ly in Eq. (2) to obtain the numerical function of stress directionality and conversion factor ratio:

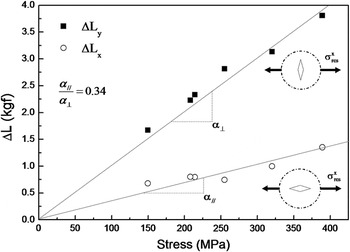
To verify the Knoop model, indentation tests were performed on cruciform specimens that are strained artificially using the stress-generating jig. The linear slopes between ∆Lx, ∆Ly, and applied uniaxial stresses were defined as the conversion factors, described differently when the direction of the long axis of Knoop indenter to the stress is parallel (α ∥) or normal (α ⊥) at a given indentation depth. The constant value of the conversion factor ratio α ∥/α ⊥ independent of indentation depth was also verified by analyzing the experimental data.
III. EXPERIMENTAL PROCEDURES
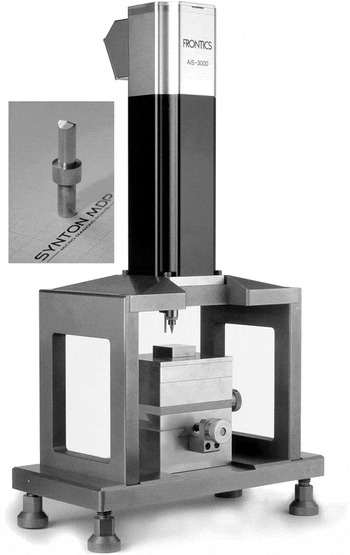
Instrumented indentation tests were carried out using an AIS 3000 system (Frontics, Inc., Seoul, Korea) (max. load: 300 kgf, load resolution: 5.6 gf, displacement resolution: 0.1 μm), the Knoop indenter with 150 μm maximum indentation depth, and a diamond tip was produced by Synton MDP (Nidau, Switzerland) (Fig. 3). Machine compliance is calculated with standard hardness blocks.
Advanced Indentation System (AIS3000) and Knoop indenter.

A stress-generating jig with two independent orthogonal loading axes was designed to strain the rectangular beam and cruciform specimens.Reference Lee and Kwon13 The applied biaxial surface strains were converted to biaxial stresses of the two orthogonal axes using the Young’s modulus and Poisson’s ratio of the specimens. To keep the applied stress below the elastic limit, the difference of the two orthogonal principal stress components was maintained below the specimen yield strength according to the Tresca yield criterion.
The materials chosen in this study were S20, S45C, and API X65 steels, which are used in such industrial facilities as plants, pipes, and tanks. The materials have elastic modulus 215 GPa, Poisson’s ratio 0.3, and yield strengths 258, 362, 490 MPa at room temperature. The 15-mm-thick rectangular beam and cruciform specimens were machined from a thick plate and heat treated to remove internal stress. No warping was detected in the specimen after the stress-relief annealing. The specimen surface was mechanically ground and polished for the subsequent indentation tests.
IV. EXPERIMENTAL VERIFICATION OF KNOOP INDENTATION MODEL
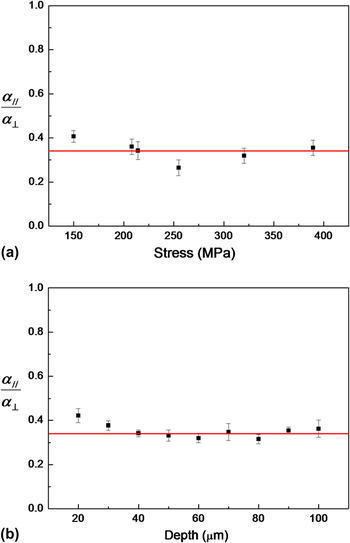
Indentation tests were performed at various uniaxial tensile stress states (150, 208, 214, 254, 359, 389 MPa, p = 0) to determine the linear relation between ∆Lx, ∆Ly, and applied uniaxial tensile stresses with proportionality factors α ∥ and α ⊥. The stresses and load differences had the linear relation shown in Fig. 4, and the slope of the graph was determined to conversion factors in each direction. As shown in Fig. 5, the conversion factor ratio, α ∥/α ⊥, had the constant value 0.34 regardless of indentation depth and applied stress.
Relation between load difference and applied uniaxial stresses.

Independence of constant conversion factor ratio and (a) biaxial stress state and (b) indentation depth.

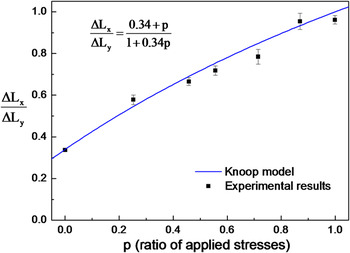
To verify the Knoop indentation model and Eq. (3), uniaxial, equibiaxial, and nonequibiaxial residual stress states were produced and indentation tests performed. All of applied residual stress states were under tensile stress states. Figure 6 shows that the experimental results agree well with the fitting curve of Eq. (3).
Verification of Knoop indentation model for various stress directionalities.

V. DISCUSSIONS
The ideal Knoop indenter should have a 7.11:1 long/short diagonal indent ratio. The long/short diagonal ratio of the residual imprint has about 6.7:1 under the assumption of elastoplastic behavior.Reference Giannakopoulos and Zisis15 However, because of manufacturing limitations, the residual imprint of Knoop tip does not have the ideal ratio. The long/short diagonal ratio of the observed residual imprints has about 5.5:1 to 6.5:1. The imperfect Knoop indenter ratio affects the conversion factor ratio 0.34, so we determined the conversion factor ratio by varying the Knoop diagonal ratio using FE simulations.
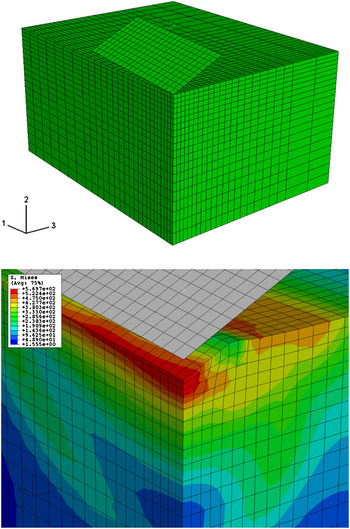
FE Knoop indentation was simulated for the two diagonal ratios (3.5:1, 14:1) using ABAQUS 6.6 (ABAQUS Inc., Providence, RI). The input file was created with MSC.Patran. The Knoop indenter has 2-fold symmetry, so one-fourth of the total specimen was modeled. The 4 mm × 4 mm × 4 mm three-dimensional specimen was made up using 32160 eight-node brick elements (Fig. 7). The indenter was set as a rigid body, and the specimen was set to behave elastic-plastically. Modeling size of the specimens was 50 times the distance of long axis of Knoop indenter. The friction coefficient was ignored because friction is considered a minor factor during indentation. Edge effects of this model that could be caused by small distance to the boundaries were not observed, so these effects were also ignored. The von Mises yield criterion was applied for analysis, and the plastic–elastic behavior of the specimen was modeled with Poisson’s ratio, elastic modulus, and uniaxial tensile curve obtained from uniaxial tensile testing. Uniform biaxial residual stresses were applied into the specimens by forming uniform stress field to the specimen end before indentation testing. The indentation was displacement-controlled by imposing a vertical displacement on the rigid indenter, maximum indentation depth was 120 μm, and the reaction force acting on the indenter was multiplied by 4 to obtain the indentation force.
Finite element model for simulation of Knoop indentation.

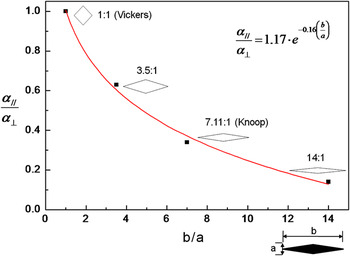
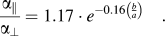
FE analysis for various biaxial residual stress (p = 0, 0.25, 0.5, 1) is performed for the two diagonal ratios 3.5:1 and 14:1. For the 3.5:1 ratio, the conversion factor ratio is 0.63, significantly larger than for the ideal Knoop indenter. On the other hand, for the 14:1 ratio, the conversion factor ratio is 0.14, significantly smaller than for the ideal case. That is, the larger the diagonal ratio, the smaller the conversion factor ratio becomes; the conversion factor ratio decreases as diagonal ratio increases. In other words, the conversion factor ratio is determined by the Knoop tip diagonal ratio; when the diagonal ratio increases, the Knoop indentation load is affected only on one axis. Figure 8 plots the conversion factor ratio and the diagonal ratio. The fitting equation [Eq. (4)] expresses the conversion factor ratio corresponding to the diagonal ratio:
Relation between conversion factor ratio and diagonal ratio.

VI. CONCLUSIONS
The Knoop indentation model for measuring and quantifying stress directionality p was described. In the uniaxial residual stress state, the load difference had a linear relation to stress at a given indentation depth, and we can determine the conversion factors from the slope of the linear graph of the load differences and the uniaxial stresses. These conversion factors were the depth variables; however, the conversion factor ratio, α ∥/α ⊥, had constant value 0.34 regardless of indentation depth and applied stresses. This value was verified by the experiments with various tensile stress states. We could determine and quantify the stress directionality from the equation with experimental values of ∆Lx/∆Ly. The presence of an imperfection in the Knoop tip changes the conversion factor ratio. Using FE simulations, the change in the conversion factor ratio produced by varying the indenter diagonal ratio was expressed by the fitting equation.