I. INTRODUCTION
TiAl-based alloys have been extensively studied as candidate materials for high-temperature structural applications due to their low density, high stiffness, high specific strength, and good creep resistance.Reference Kothari, Radhakrishnan and Wereley1–Reference Yamaguchi, Inui and Ito4 Among the various microstructures of TiAl alloys, the fully lamellar microstructure obtained by directional solidification is one of the most attractive topics due to its excellent tensile properties.Reference Inui, Oh, Nakamura and Yamaguchi5–Reference Du, Shen, Xiong, Shang and Fu7 When the lamellar microstructure is aligned parallel to the tensile direction, both the tensile strength and elongation reach an excellent balance simultaneously.
Up to now, two types of directional solidification techniques have been used to fabricate the desired lamellar microstructure of TiAl alloysReference Johnson, Inui, Muto, Omiya and Yamanaka8–Reference Johnson, Inui and Yamaguchi11: one is the Bridgman directional solidification technique; the other one is the optical float zone (FZ) furnace. Although great advances have been done over the past years, both of them face the insurmountable obstacle to fabricate a large-scale sample with excellent properties for industry application.Reference Du, Shen, Xiong, Shang, Wang and Fu12 For the Bridgman directional solidification, brittle crucible fragments are usually produced due to the chemical reactions between the TiAl melt and ceramic crucibles,Reference Ding, Zhang, Lin, He, Yin and Chen13,Reference Luo, Shen, Min and Fu14 which are detrimental to the mechanical properties of samples. By comparison, although a nonpolluting TiAl sample with the desired lamellar microstructure could be obtained by optical FZ furnace, the technique is only useful for laboratory research to produce samples of small section size.Reference Lee, Johnson, Inui, Oh, Wee and Yamaguchi15,Reference Takeyama, Yamamoto, Morishima, Koike, Chang and Matsuo16 Consequently, new directional solidification techniques are expected to obtain large-scale samples with the desired lamellar microstructure.
As a promising electromagnetic technique, electromagnetic confinement and directional solidification (EMCDS) was used to shape the sample with a diameter of 20 mm in our previous studies.Reference Du, Shen, Xiong, Shang, Wang and Fu12 By using an appropriate seed, the lamellar microstructure was aligned well during the seeding process at the growth rate of 10 μm/s and a fracture toughness of 34.5 MPam1/2 was measured. This suggests that EMCDS is a prospective technique to produce the large-scale sample of the Ti–47Al alloy with excellent tensile property. Note that, because intense electromagnetic force and fluid flow exist in the molten zone, the microstructural development and phase selection during EMCDS were different from those during Bridgman directional solidification and optical FZ directional solidification. However, few studies have been performed with respect to the effect of growth velocity on the seeding process by EMCDS and the relevant mechanism.
In this paper, the seeding method is used to align the lamellar microstructure of large-scale Ti–47Al samples by EMCDS at different growth velocities and the microstructural development during the seeding process is discussed. Besides, the tensile properties of the samples and the fracture behaviors during the tensile testing are checked correspondingly.
II. EXPERIMENT
Nominal chemical compositions of Ti–47Al and Ti–43Al–3Si alloys were used in the EMCDS process. The purity of raw materials used in this study is Ti 99.96 (wt%), Al 99.99% (wt%), and Si 99.95% (wt%). A master bar with 18 mm in diameter was cut from a Ti–47Al ingot by electro-discharge machining (EDM). And a seed bar with the same diameter, in which the α2/γ lamellae are aligned parallel to the longitudinal direction, was cut from a Ti–43Al–3Si as-cast ingot. The preparation of the seed ingot was described elsewhere.Reference Zheng, Shen, Ding, Chen and Xu17
The seeding process was performed by EMCDS at different growth velocities of 10, 20, and 50 μm/s. More detailed description of the EMCDS process has been recently reported in our previous paper.Reference Du, Shen, Xiong, Shang, Wang and Fu12 The only difference lies in the sample diameter: 18 mm in the present paper, whereas 20 mm in Ref. Reference Du, Shen, Xiong, Shang, Wang and Fu12. For optical microscopy, the directionally solidified (DS) samples were sectioned longitudinally by EDM. And the sections were mechanically polished using standard metallographic techniques and then etched with a solution of 10 mL HF, 5 mL HNO3, and 85 mL H2O. After metallographic preparation, the macrostructure was photographed by using a digital camera and the microstructure was revealed by using a Leica DM4000M optical microscope (Leica Microsystems, Wetzlar, Germany).
To identify the tensile properties of the samples, flat specimens with a gauge section of 12 × 4 × 2 mm were cut from the longitudinal section of the samples as well as the as-cast ingot. Prior to tensile testing, the angle between the tensile direction and lamellar microstructure (θ) are checked from the specimen surface, and then all the faces of specimens were ground and polished again. Tensile tests were performed at room temperature on an Instron 3382 universal testing machine (Instron Corporation, Canton, Massachusetts) and at a strain rate of 2 × 10⁻⁴ s−1. Scanning electron microscopy (SEM) and transmission electron microscopy (TEM) were performed to check the fracture behavior of the specimens.
III. RESULTS AND DISCUSSION
A. Microstructures
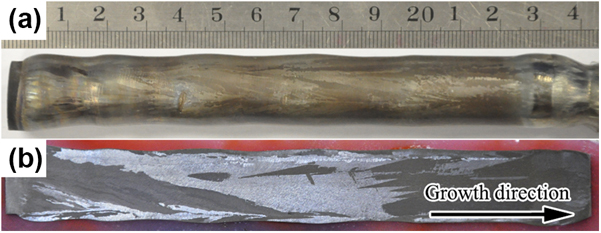
Figure 1 shows the typical sample and macrostructure of the Ti–47Al alloy obtained by EMCDS. Because no crucible is used in EMCDS, the sample surface is glossy and the columnar grains can be observed clearly without any metallographic preparation. Although the sample profile is undulate and stray grains usually form due to the swing of the molten zone, most of the columnar grains can grow stably along the growth direction.
Typical sample (a) and macrostructure (b) of the Ti–47Al alloy obtained by EMCDS.

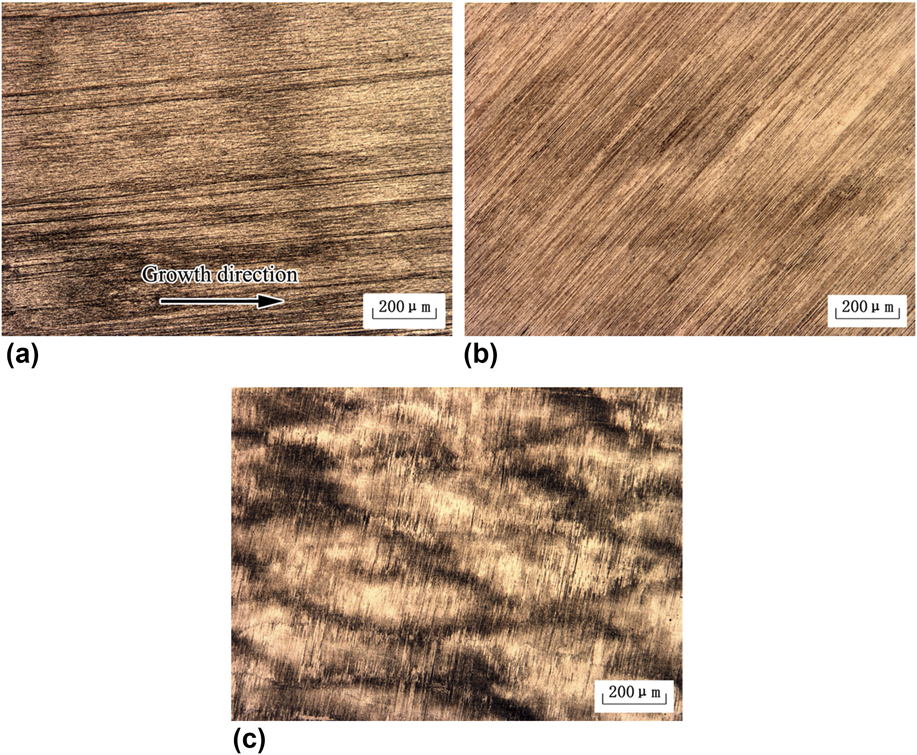
The images in Fig. 2 depict the longitudinal microstructures in the initial transition region of the seeding process at different growth velocities. Unlike the microstructural development during the directional solidification without seed, coarse dendrites are observed in this stage and numerous fine Ti5Si3 particles are distributed in the interdendritic region. Although it is difficult to distinguish between the primary and secondary dendrite, the 0° angle between the lamellar microstructure and the growth direction suggests that the high-temperature α grains are aligned well controlled by the seed.
Microstructures in the initial stage of the seeding process at different growth velocities of 10 µm/s (a), 20 µm/s (b), and 50 µm/s (c), respectively.
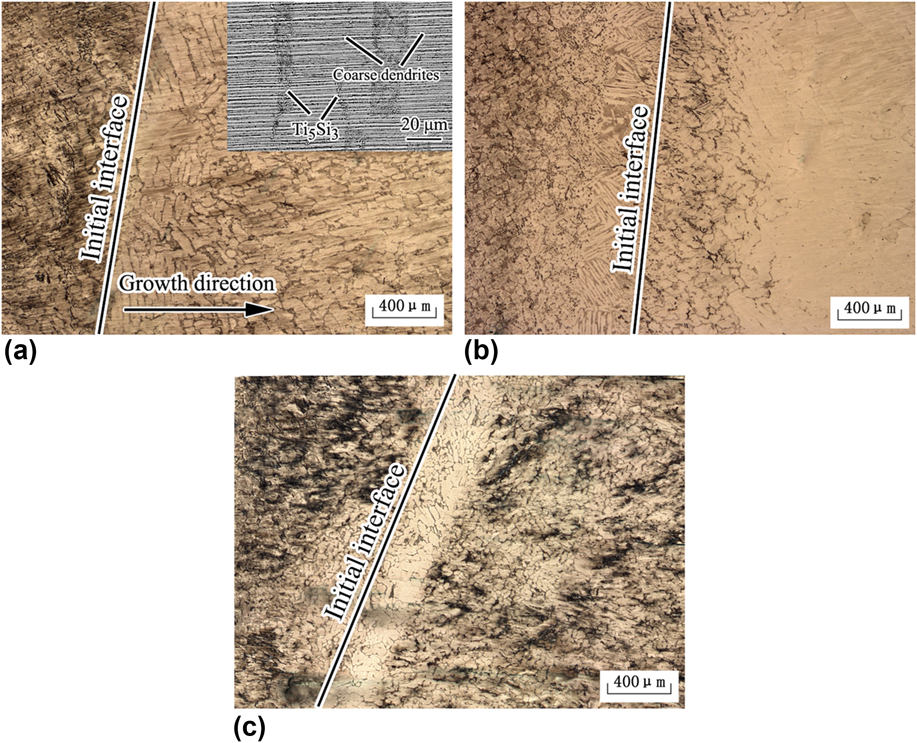
With the increase of growth velocity, the lamellar microstructure is still aligned well in this stage. Correspondingly, the primary interdendritic spacing decreases and the second arms of the dendrites regress. The Ti5Si3 particles in the interdendritic region reduce and more Ti5Si3 particles are observed in dendrites core, as shown in Figs. 2(b) and 2(c). Since the growth distance of those coarse dendrites decreases with the increase of growth velocity, it is suggested that the length of the transition region during the seeding process decreases. This is in accordance with the analytic model proposed by Tiller et al.Reference Tiller, Jackson, Rutter and Chalmers18
Figure 3 shows the microstructures in the DS region at different growth velocities. When the growth velocity is 10 μm/s, the S/L morphology transforms from dendritic to cellular with crystal growth and the desired lamellar microstructure is obtained in the DS region, as shown in Fig. 3(a). A similar phenomenon has also been reported in our previous study.Reference Du, Shen, Xiong, Shang, Wang and Fu12 When the growth velocity is 20 μm/s, new stray grains form in the local region with crystal growth. Because those aligned α grains grow along the unpreferred orientation, once new grains nucleate, they will grow directionally and then quickly eliminate those original α grains, leading to the failure of the seeding process. Nevertheless, the transformation from dendritic to cellular is still observed from the longitudinal section. According to the inclined orientation between the lamellar microstructure and the growth direction, it is suggested that the stray grains that nucleate at the present condition are β phase, as observed in Fig. 3(b).
Microstructures in the DS region of the seeding process at different growth velocities of 10 µm/s (a), 20 µm/s (b), and 50 µm/s (c), respectively.
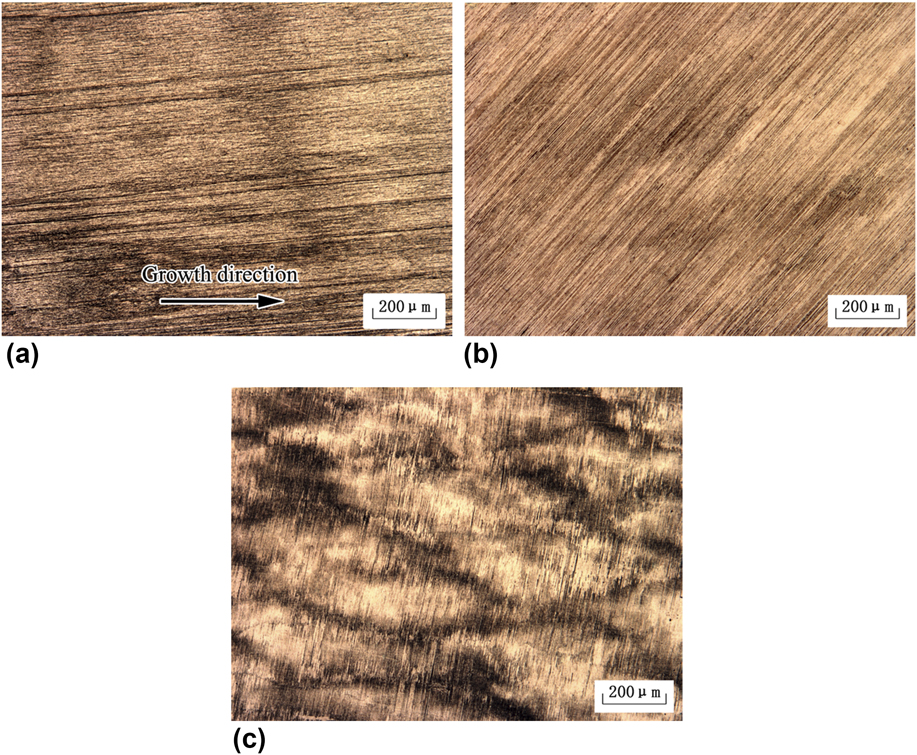
When the growth velocity increases further, the alignment of the lamellar microstructure fails soon after the initial transition region due to the nucleation and growth of new stray grains. And the 90° angle between the lamellar microstructure and growth direction shows that these grains are α phase. Moreover, from the microstructure shown in Fig. 3(c), it is observed that the growth morphology of the α phase is dendrite, which can also be identified from the quenched S/L interface. Notably, although β or α phase dominates the DS region with crystal growth, the simultaneous growth of the two phases is usually observed in the samples obtained by EMCDS.
B. Microstructural development
Extensive studies have been performed to understand the microstructural development and phase selection during the directional solidification of peritectic alloys.Reference Hunziker, Vandyoussefi and Kurz19–Reference Li, Sun, Yu, Su, Cao, Guo and Fu21 With the change of temperature gradient and growth velocity, the solidified phase and microstructure are usually different. Assuming that the solute diffusion boundary layer ahead of the solidifying interface has been established but the phase has not grown stably, the nucleation and constitutional undercooling criterion was proposed to predict the phase and microstructural selection during the directional solidification by Hunziker et al.Reference Hunziker, Vandyoussefi and Kurz19 And the calculation results are in good agreement with many experimental results of different peritectic alloys,Reference Hunziker, Vandyoussefi and Kurz19–Reference Li, Sun, Yu, Su, Cao, Guo and Fu21 including TiAl alloys.
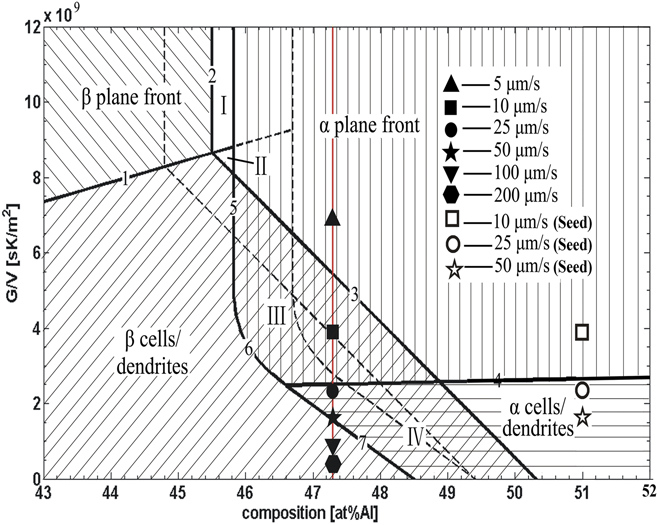
Figure 4 illustrates the phase selection map of the TiAl alloy. The dashed line ignores the nucleation undercooling, whereas the solid line considers the nucleation undercooling of ΔT nα = ΔT nβ = 4 K. In this figure, line 4 represents the limits of stable growth of the planar α phase. The planar growth of the α phase is stable at G/V ratios above this line, whereas the cellular growth is to be expected below this line. While in the right region of lines 5, 6, and 7, the α phase could grow stably without the nucleation of β phase. Correspondingly, while in the left region of line 3, the β phase could grow stably then. Therefore, in the regions III and IV, the α phase could also grow stably without the nucleation of β phase, and vice versa. In other words, the phase selection in both the regions is history dependent.
Phase/microstructure selection map of the TiAl alloy at ΔT nα = ΔT nβ = 0 K (dashed line) and ΔT nα = ΔT nβ = 4 K (solid line).
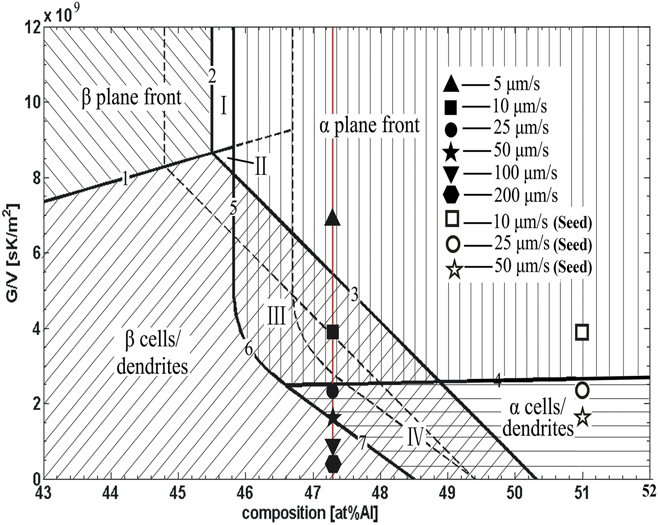
Assuming the temperature gradient (G) is constant of 30 K/mm,Reference Du, Shen, Xiong, Liu, Zhao and Fu22 G/V will decrease with the increase of growth velocity. Accordingly, the microstructure of the Ti–47Al alloy is expected to transform as follows: α plan → α plan + β cells/dendrites → α cells/dendrites + β cells/dendrites → β dendrites. The solid symbols marked in Fig. 4 denote the phases and microstructures observed in our previous study.Reference Du, Shen, Xiong, Liu, Zhao and Fu22 According to the “Al-equivalent” method, the alloy of Ti–43Al–3Si is simply equivalent to the binary Ti–51Al alloy, which is also marked by open symbols. With the seeding processes, the composition of the molted is transformed from the right of line 3 to the regions III or IV. Because the β phase cannot nucleate at the right of line 3, those aligned α grains can grow stably in this stage, which is regardless of the growth velocities here.
Since the phase selection in regions III and IV is history dependent, those aligned α grains can grow stably with crystal growth at 10 μm/s. When the growth velocity increases to 20 and 50 μm/s, it seems that seeding can still be successfully performed, but the seeding fails although the experiment was done repeatedly. In fact, the prediction model is discussed close to the limit of constitutional undercooling, and thus is suitable for the phase prediction when the S/L interface is planar or shallow cellular.Reference Wang, Shen, Xiong, Du and Fu20 For the dendritic interface morphology, there usually exist some deviations between the prediction model and the experiment results. Because those aligned α grains grow along unpreferred orientation, any nucleation of new stray grains may disturb their growth and then lead to the failure of seeding. A similar observation was also reported by Luo et al.Reference Luo, Shen, Min and Fu23 Thus, more studies are needed to be performed further.
C. Tensile property
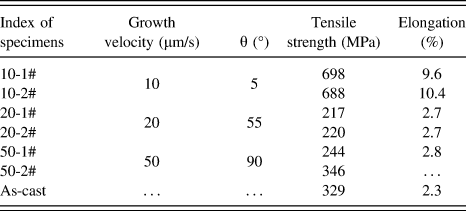
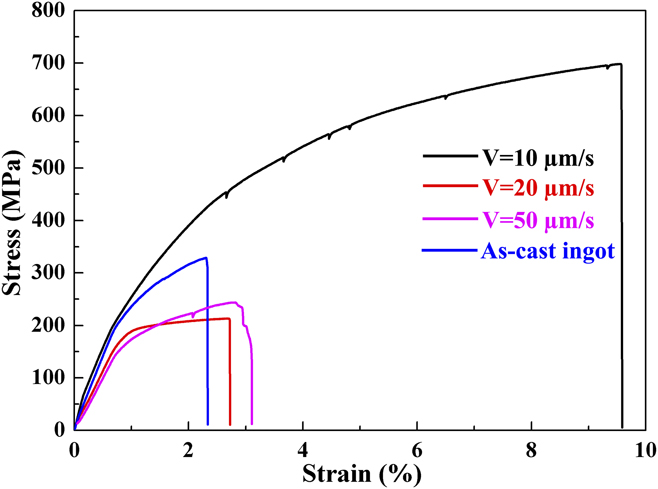
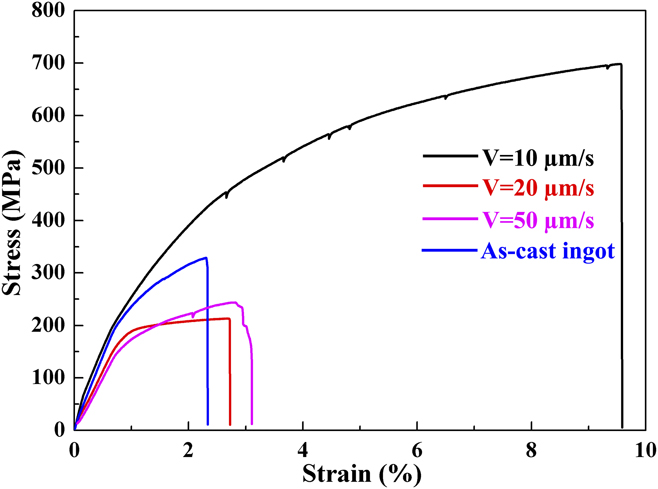
The tensile properties of the samples obtained by EMCDS as well as the as-cast ingot are listed in Table I. Somewhat surprisingly, unlike the results reported by Inui et al.,Reference Inui, Oh, Nakamura and Yamaguchi5 both the highest tensile strength and elongation are obtained simultaneously for the desired lamellar microstructure, showing that both of them are significantly improved. By contrast, the least tensile strength and elongation is yielded when θ = 55°. When the angle increases to 90°, the strength and elongation increase slightly and are close to that of the as-cast ingot, but are far smaller than that of the desired lamellar microstructure. Notably, since the length of the tensile specimens is relatively small and the actual elongation is difficult to measure accurately, the elongation here is the strain data recorded by the testing machine.
Tensile properties of the Ti–47Al specimens.

Figure 5 depicts the typical stress–strain curves of the Ti–47Al lamellar microstructures with different angles. It is obvious that both the tensile strength and elongation of the desired lamellar microstructure are far higher than those of other lamellar microstructures. What’s more, a nonlinear elastic deformation is obviously observed until the sudden drop of stress occurs, which suggests that the specimen becomes yielded. Subsequently, a serrated stress–strain curve is observed with the increase of stress. All these phenomena imply that dislocations within the specimen are prone to operate but some mechanisms operate to resist the further propagation of the dislocations. As a result, both the tensile strength and elongation are significantly improved. For the other microstructures, by contrast, both the tensile strength and elongation are very low and the linear elastic deformation stage can be easily distinguished.
Typical stress–strain curves of the Ti–47Al specimens.
D. Fracture behavior
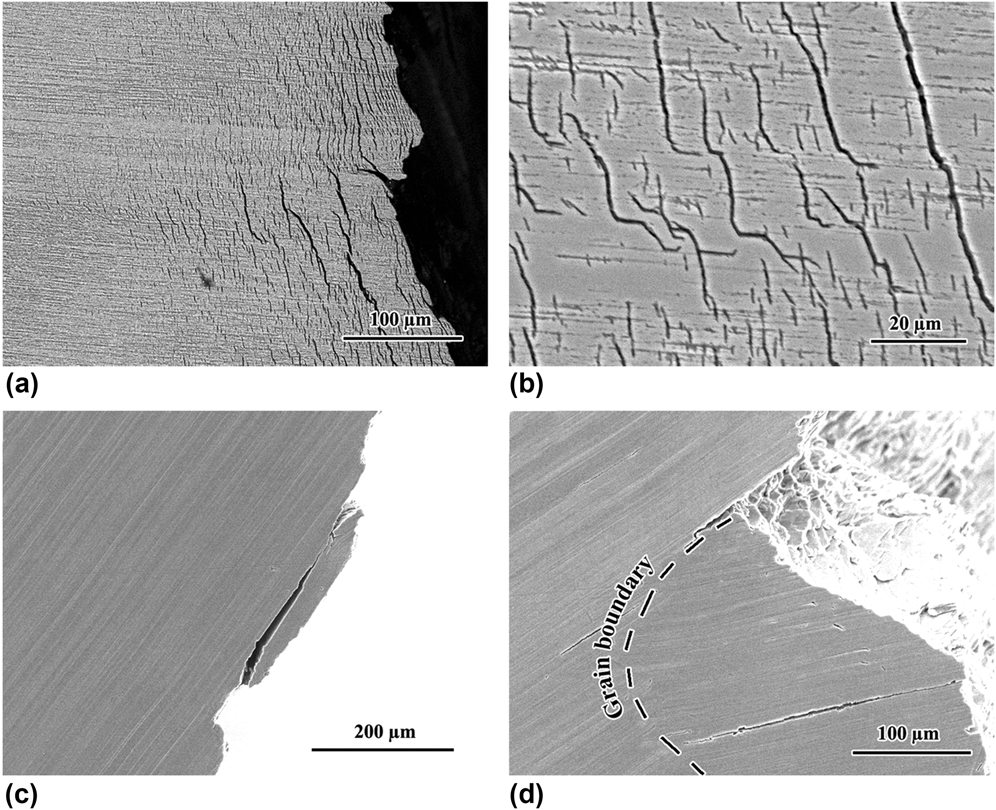
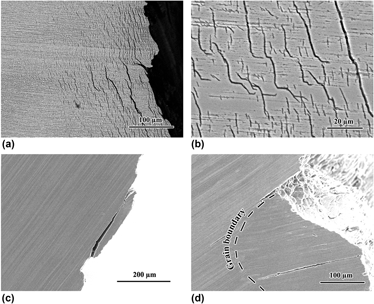
The images in Fig. 6 show the side views of specimens after tensile fracture. The tortuous fracture path and numerous translamellar cracks are observed when the lamellar microstructure is parallel to the tensile direction [Fig. 6(a)]. Two types of translamellar cracks, which are significantly resisted by the normal lamellae, can be distinguished from the magnified microstructure [Fig. 6(b)]: one is the short cracks only within single or several γ lamellae; the other one is the long cracks that extend a considerable distance. Most of these translamellar cracks have the identical orientation with regard to the lamellar microstructure, implying that the long cracks are induced by the propagation of those short cracks. But both of them are significantly resisted by the normal lamallae. Additionally, it is also observed that some interlamellar microcracks form together with the propagation of the translamellar cracks. This suggests that the normal α2 lamellae can significantly toughen the crack tip and more stress is needed across the α2 lamellae, which is the main reason leading to the excellent tensile strength and elongation for the desired lamellar microstructure.
Side views of specimens after tensile fracture at 10 µm/s (a and b), 20 µm/s (c), and as-cast ingot (d).

Figure 6(c) depicts the facture behavior of the lamellar microstructure when θ = 55°. Unlike the deformation behavior of the desired lamellar microstructure, the fracture path is flat and few translamellar microcracks are found in the specimen except several interlamellar microcracks near the main crack. A similar phenomenon is also identified in the specimen solidified at 50 µm/s, in which the lamellae are perpendicular to the tensile direction. The fracture behavior of the as-cast ingot is given in Fig. 6(d). Owing to the presence of numerous equiaxed grains, more interlamellar and translamellar microcracks occur at grain boundaries. At the same time, several interlamellar and translamellar microcracks are also observed within grain interior, as shown in Fig. 6(d).
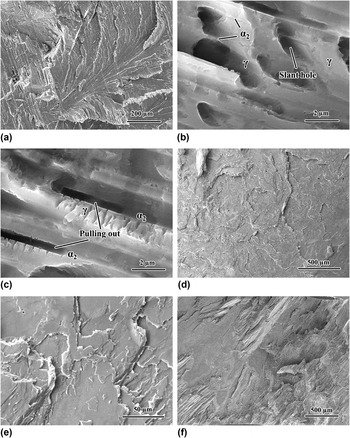
Figure 7 shows the fracture surfaces of the specimens after tensile fracture. A tortuous fracture surface is observed in Fig. 7(a) for the desired lamellar microstructure, which is consistent with the observation from the side view of the specimen. Moreover, two main strengthening mechanisms are found from the magnified micrographs. One is the slant holes present in single γ lamellae and the other is the pulling out of α2 lamellae, as shown in Figs. 7(b) and 7(c), respectively. Considering that numerous translamellar cracks form during the tensile testing, it is creditable that these slant holes are the manifestation of those translamellar cracks shown in Fig. 6(b). In general, the more fracture mechanism behaviors operate during the crack propagation, the higher crack resistance will be obtained. Consequently, the tensile strength and elongation of the sample are significantly improved when the lamellar boundary is aligned parallel to the tensile direction.
Fracture surfaces of the specimens after tensile fracture at 10 µm/s (a, b, and c), 20 µm/s (d and e), and as-cast ingot (f).

When θ = 55°, as depicted in Figs. 7(d) and 7(e), the fracture surface is flat and delamination is the main mechanism causing the break down of the specimen. This is because the interlamellar cracks will easily extend along the lamellar boundary once they are initiated due to the stress concentration in the local region. For this case, both the tensile strength and elongation are low in this case. Figure 7(f) gives the fracture surface of the as-cast ingot. Both the interlamellar and translamellar cracks form during the crack propagation. Besides, it is also found that the cracks incline to propagate along the grain boundaries, which is in good accordance with the observation shown in Fig. 6(d).
E. Fracture mechanism
Extensive studies have been performed with regard to the PST crystals with different orientations. In the study performed by Johnson et al.,Reference Inui, Oh, Nakamura and Yamaguchi5 it is found that the desired lamellar microstructure has the excellent combination of tensile strength and elongation, but its elongation is lower than that of the lamellar microstructure with inclined orientation. Recently, tensile properties of the lamellar microstructure of the Ti–47Al–2Cr–2Nb alloy at 800 °C are checked by Ding et al.Reference Ding, Nie, Chen, Guo and Fu24 And the results show that more profuse deformations are observed for the inclined lamellar microstructure, which is the main reason for the high ductility. Hwu and DerbyReference Hwu and Derby25 studied the fracture behavior of metal/ceramic laminates when the crack is normal to the lamellar boundary. Two distinct fracture models, including single fracture and multiple fracture, were discussed and it was suggested that more energy is needed for the multiple fracture, and thus higher toughness is yielded. In our previous study,Reference Du, Shen, Xiong, Shang, Wang and Fu12 the fracture toughness of the desired lamellar microstructure was measured and the results suggested that the normal α2 lamellae can offer considerable resistance during the propagation of the crack tip. As a result, numerous interlamellar and translamellar microcracks operate ahead of the crack tip before the crack of α2 lamellae.
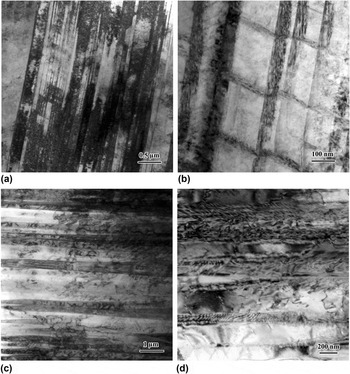
As discussed above, the image in Fig. 5 shows that the desired lamellar microstructure has the highest tensile strength and elongation simultaneously in our study. This is somewhat different from the results reported by Johnson et al.Reference Inui, Oh, Nakamura and Yamaguchi5 and Ding et al.Reference Ding, Nie, Chen, Guo and Fu24 To further identify the fracture mechanism of the different lamellar microstructures, the fracture behaviors are checked by TEM. By comparing the images shown in Figs. 8(a) and 8(c), more dislocations can be found in the desired lamellar microstructure. From the magnified micrograph shown in Fig. 8(b), numerous twin bands form in single γ lamellae and are also resisted by the α2 lamellae. And their orientation is in accordance with that of the translamellar cracks observed in Fig. 6(b). This observation implies that these twin bands are likely the reason for the formation of those translamellar microcracks. According to the study performed by Zambaldi and Raabe,Reference Zambaldi and Raabe26 these twin bands and translamellar cracks occur on {111} planes, which is a glide plane prone to operate for the γ phase. However, due to the resistance of α2 lamellae, more stress is needed for further propagation of those dislocations and cracks. By contrast, when θ = 55°, numerous dislocation networks occur along the grain boundary, whereas few twin bands are found, as shown in Fig. 8(d). For this case, it is believed that the crack can propagate largely along the lamellar boundary and the specimen fractures before the operation of twin bands in single γ lamellae. This is the reason why fewer translamellar microcracks are observed from the side view of the specimen.
TEM microstructures of the specimens after tensile fracture at the growth velocities of 10 µm/s (a and b) and 20 µm/s (c and d).

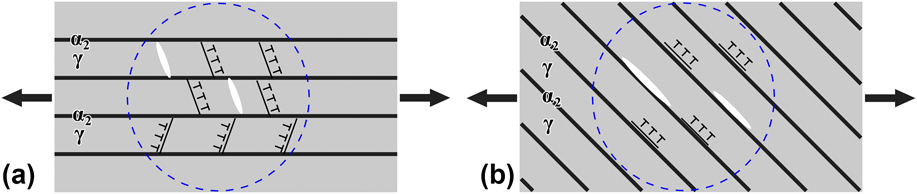
The images in Fig. 9 illustrate the crack propagations during the tensile testing. When the tensile direction is parallel to the lamellar boundary, numerous dislocations and twin bands are induced and piled up in single γ lamellae due to the stress concentration in the local region. According to the fracture theory proposed by Stroh,Reference Meyers27 once the critical value of the stress reaches, cracks will nucleate at the head of those dislocations or twin bands. However, both of them as well as the cracks are resisted by the normal α2 lamellae, and higher stress is needed to overcome the resistance of α2 lamellae, as shown in Fig. 9(a). For this case, the γ lamellae in other regions are likely yielded and then crack before the crack of those α2 lamellae, as shown in Fig. 6(a). With further increase of tensile strength, some microcracks will cross the α2 lamellae and propagate further, and then contact with other microcracks until the specimen fractures. Because numerous microcracks occur simultaneously and are significantly resisted by the normal α2 lamellae, the excellent tensile strength and elongation of the desired lamellar microstructure are obtained in our study.
Illustration of the crack propagations during tensile testing when the lamellar microstructures are parallel (a) or inclined (b) to the tensile direction.

By contrast, when the lamellae are inclined or perpendicular to the tensile direction, the interlamellar microcracks will be produced at the lamellar boundaries due to the stress concentration in the local region. Because these cracks can easily propagate along the lamellar boundaries without the resistances of the α2 lamellae, the specimen will fracture soon once the crack nucleates, as depicted in Fig. 9(b). For this case, it is not surprising that both the tensile strength and the elongation of the lamellar microstructures are lower than those of the desired lamellar microstructure.
IV. CONCLUSIONS
The seeding method is used to align the lamellar microstructure of the Ti–47Al alloy at different growth velocities by EMCDS. All the lamellae are aligned well in the initial transition stage, but the seeding fails due to the nucleation and growth of new grains with the increase of growth velocity. As a result, the desired lamellar microstructure can only be obtained at 10 μm/s, while the inclined and perpendicular lamellar microstructures form at 25 μm/s and 50 μm/s, respectively. The tensile properties of the samples are measured and the results suggest that the mean tensile strength of 693 MPa and elongation of 10.0% are obtained for the desired lamellar microstructure, which are the maximum values that have been reported in binary γ-TiAl alloys so far and are far higher than that of other lamellar microstructures. From the SEM and TEM micrographs, it is found that numerous dislocations and twin bands as well as translamellar microcracks are produced in the desired lamellar microstructure, whereas fewer dislocations and microcracks occur in other lamellar microstructures. Additionally, two distinct models are used to illustrate why the desired lamellar microstructure can possess more excellent tensile properties than other lamellar microstructures.
ACKNOWLEDGMENTS
This work is supported by the National Natural Science Foundation of China under Grant No. 51574195, and the Research Fund of State Key Laboratory of Solidification Processing (NWPU), China under Grant No. 119-TZ-2015. It is also supported by the Doctorate Foundation of Northwestern Polytechnical University under contract No. CX201308 and the China Postdoctoral Science Foundation under contract No. 2017M613234.