Introduction
Sugarcane (Saccharum spp.) is an important member of the Poaceae family. Modern sugarcane cultivars are complex hybrids of S. officinarum and its wild relatives (Daniels and Roach, Reference Daniels, Roach and Heinz1987). It is grown 35°N and S of the equator for sugar production. In Florida, sugarcane grows on different areas of the Everglades Agricultural Area (EAA) with varying degrees of nutritional status of organic (muck) and sand soil. Sugarcane stalks are more than 70% water, and the rest is sucrose and fiber. The raw sugar that is produced from these cane juice is later refined into white granular sugar. Cane yield and sucrose content of the cane are the primary components of sugar yield (Lingle et al., Reference Lingle, Johnson, Tew and Viator2010). This complex and dynamic trait is controlled by a physiological processes governed by gene networks (Papini-Terzi et al., Reference Papini-Terzi, Rocha, Vêncio, Felix, Branco, Waclawovsky, Del Bem, Lembke, Costa, Nishiyama, Vicentini, Vincentz, Ulian, Menossi and Souza2009; Zhang et al., Reference Zhang, Arro, Chen and Ming2013) and influenced by environmental factors (Lingle, Reference Lingle1997; Gilbert et al., Reference Gilbert, Shine, Miller, Rice and Rainbolt2006). As a sugarcane plant nears maturity, its vegetative growth is reduced and sucrose content is increased, induced by temperature, stress, and day length (Odero et al., Reference Odero, Rainbolt, Gilbert and Dusky2013). Sugarcane needs to be harvested at the most suitable time when the economic optimum of recoverable sugar per area is reached. Both cane and sucrose yield can vary at harvest depending on the genotype, crop cycles (plant or ratoon), management practices, growing zone, and their interaction (Ramburan et al., Reference Ramburan, Wettergreen, Berry and Shongwe2013).
The sugarcane variety development program at Canal Point (hereafter, CP program), Florida is a cooperative breeding program, conducted by the USDA-ARS, the University of Florida, and the Florida Sugar Cane League, Inc. The major selection criteria in variety development are profitability, sucrose yield, and resistance to major diseases along with other agronomic traits. Sucrose yield depends primarily on cane yield and sucrose content of the cane stalk. Sucrose yield is reported to be positively correlated with cane tonnage yield and its associated traits such as number of stalks/plant and stalk weight (Khan I.A. et al., Reference Khan, Seema, Raza, Yasmine and Bibi2013; Zhao et al., Reference Zhao, Zhu and Momotaz2020). Zhao and Yang-Rui (Reference Zhao and Yang-Rui2015) reported with their studies of the most recently released cultivars on the Florida sand soils that increased sucrose yield was mainly associated with increases in cane tonnage rather than increases in commercial recoverable sucrose.
Although rigorous efforts are made to select new varieties with truly superior genetics, the process is compounded by the effects of GEI. Yan and Kang (Reference Yan and Kang2003) suggest that due to GEI, characterizing new varieties by mean yield across environments of multiyear yield trails is not sufficient. The effects of GEI have been a hindrance to breeders for a long time because these effects significantly reduce the usefulness of genotypic mean data and influence the selection of superior genotypes. It has been reported that the results of GEI studies are not universal; therefore, to provide guidance for sugarcane breeding strategies it is necessary to select genotypes targeted to the environments (Jackson and McRae, Reference Jackson and McRae2001; Milligan et al., Reference Milligan, Gravois, Bischoff and Martin1990; Kimbeng et al., Reference Kimbeng, Zhou and da Silva2009). Therefore, better understanding of GEI of any quantitative trait would provide guidance in breeding strategies to develop a variety for target environments (Rea et al., Reference Rea, De Sousa-Vieira, Díaz, Ramón, Briceño, George, Niño and Demey2015).
The objectives of this study were to examine the nature of GEI for sucrose yield and commercial recoverable sucrose in multi-location trials data and to draw varietal recommendations. To characterize and visualize GEI, frequently used multivariate model for analysis of traits and their stability was employed. The model was GGE (genotype (G) main effects and genotype (G) × environment (E) interaction) biplot analysis (Yan and Tinker, Reference Yan and Tinker2006), which was used to graphically display two-way data to visualize the interrelationship among the test environments. It was reported that GGE biplots can better explain GEI better and facilitate defining similar environments and identification of stable genotypes (Jamshidmoghaddam and Pourdad, Reference Jamshidmoghaddam and Pourdad2013; Yan and Tinker, Reference Yan and Tinker2006).
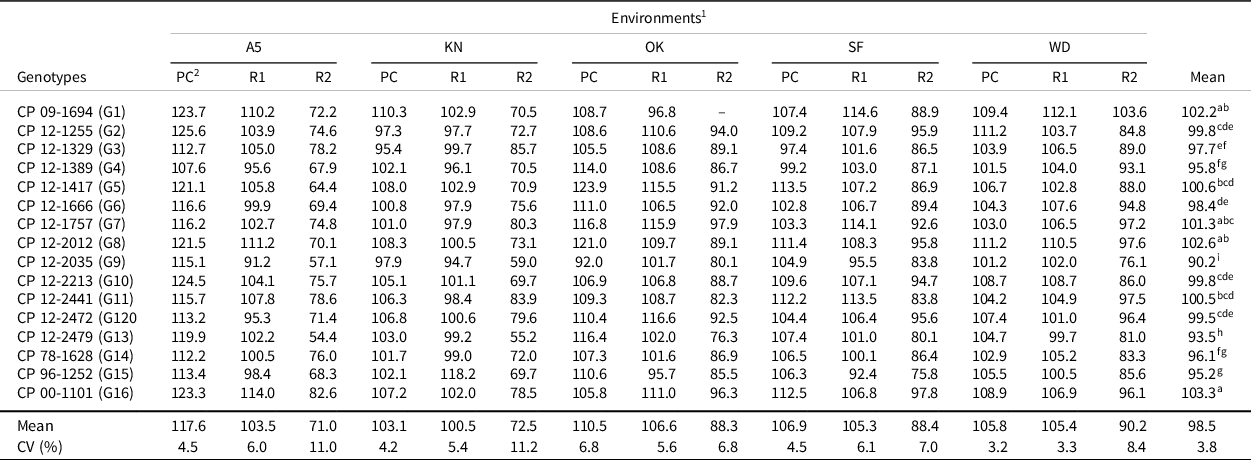
Materials and Methods
Study materials and site
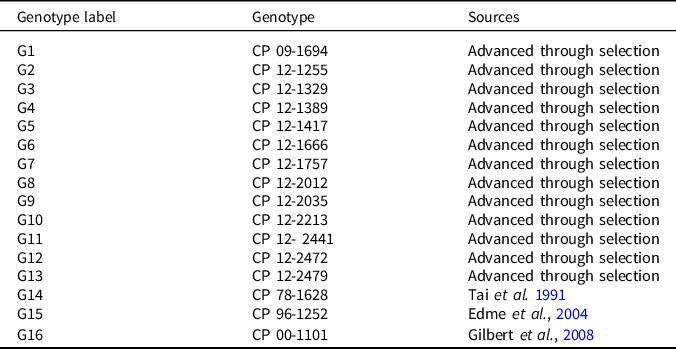
Thirteen sugarcane genotypes in this study originating from the ‘CP-12’-series and one from the ‘CP−09’ series of the CP breeding program were evaluated in three crop cycles of plant cane (PC), first ratoon (R1), and second ratoon (R2) cycles, as part of the final selection stage of the breeding program (Stage 4). The genotypes used in this study were CP 09-1964 (G1), CP 12-1255 (G2), CP 12-1329 (G3), CP 12-1389 (G4), CP 12-1417 (G5), CP 12-1666 (G6), CP 12- 1757 (G7), CP 12-2012 (G8), CP 12-2035 (G9), CP 12-2213 (G10), CP 12-2441 (G11), CP 12-2472 (G12), and CP 12-2479 (G13), as well as three controls (elite commercial cultivars), labeled as CP 78-1628 (G14) (Tai et al., Reference Tai, Miller, Glaz, Deren and Shine1991), CP 96-1252 (G15) (Edme et al., Reference Edme, Tai, Glaz, Gilbert, Miller, Davidson, Dunckelman and Comstock2004), and CP 00-1101 (G16) (Gilbert et al., Reference Gilbert, Comstock, Glaz, Edme, Davidson, Glynn, Miller and Tai2008) (Table 1).
Thirteen new Canal Point (CP) sugarcane genotypes advanced from Stage 3 to Stage 4 of the CP program, along with three reference cultivars tested during 2015–2018 cropping season

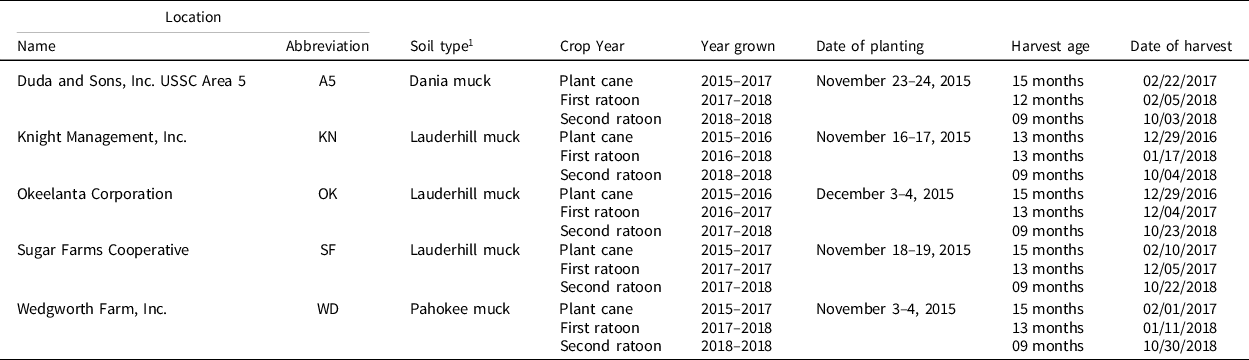
This study was performed in commercial fields at five growers’ farms on muck soil in the EAA. The locations were Duda and Sons, Inc. USSC Area 5 (A5, 26°36′N, 80°37′ W); Knight Management, Inc. (KN, 26°38′N, 80°27′ W); Okeelanta Corporation (OK, 26°35′N, 80°49′ W); Sugar Farms Cooperative (SF, 26°43′N, 80°28′ W); and Wedgworth Farms, Inc. (WD, 26°42′N, 80°34′ W). All five locations have muck (organic) soils, which are primarily decomposed sawgrass (Cladium jamaicense Crantz) in layers of various depths. KN, OK, and SF have a Lauderhill muck type of soil which extends 51−91 cm in depth to bed rock, whereas A5 has a Dania muck soil of 51 cm in depth and WD has a Pahokee muck soil which extends 91–130 cm in depth to bed rock (Glaz and Kang, Reference Glaz and Kang2008; Rice et al., Reference Rice, Gilbert and Daroub2002). Rainfall and temperatures during the growing season are listed in Table 2.
Soil types, planting, and harvest dates at five locations in the south Florida for this study

1 Details of the soil types had been described by Rice et al. (Reference Rice, Gilbert and Daroub2002) and Glaz and Kang, (Reference Glaz and Kang2008).
Experimental design
The cane was planted on November 23–24, 2015 at A5, November 16–17, 2015 at KN, December 3–4, 2015 at OK, November 18–19, 2015 at SF, and November 3–4, 2015 at WD locations. The experimental period lasted for 3 years and involved three crop cycles (i.e. plant cane and first and second ratoon crops). The experiment was laid out in a randomized complete block design with six replications. The experiment had three row plots of 10.5 m length with 1.5 m between rows. Plant cane (first cut) was harvested in December 2016 to February 2017, first ratoon cane (second cut) harvested from December 2017 to February 2018, and second ratoon cane (third cut) was harvested in October 2018 (Table 2).
Data collection
Ten-stalk samples were randomly collected from the 2nd and 3rd rows of each plot in the plant cane, first ratoon and second ratoon crop cycles. Each bundle was weighed to determine an average stalk weight, which was used with the millable stalk number to determine the cane yield per hectare (Momotaz et al., Reference Momotaz, Davidson, Zhao, McCord, Sandhu, Baltazar, Islam and Coto Arbelo2021). All stalks were milled to extract juice for determining the theoretical recoverable sucrose (TRS) as described by Legendre (Reference Legendre1992). Commercial recoverable sugar (CRS) was estimated as described in Legendre (Reference Legendre1992), which is the conversion of TRS to CRS by multiplying a commercial liquidation factor 0.86. For the purpose of this article, the data on sucrose yield (t.ha−1) and CRS (kg.t−1) were used to test adaptability and phenotypic stability of the genotypes as described in Davidson et al. (Reference Davidson, Scott, Hernandez, Gordon, McCord, Sandhu, Zhao, Comstock, Sood, Singh, Islam, Baltazar and McCorkle2019).
 $$Sucrose\;yield\left( {t.h{a^{ - 1}}} \right) = {{{\left[ {\left\{ {Cane\;yield\left( {t.h{a^{ - 1}}} \right)} \right\} \times \left\{ {CRS\left( {kg.{t^{ - 1}}} \right)} \right\}} \right]}}\over{{1000}}}$$
Data analysis
Sucrose yield and CRS data from across the locations and from combined data of all three crop cycles (PC, R1, and R2) were used to compute the analysis of variance (method = type 3) using PROC MIXED (SAS Institute, 2017). The genotypes (G), crop cycles (C), and genotypes × crop (G × C), genotypes × crops × locations (G × C × E) interaction were considered as fixed effects, whereas locations (E), replications within locations (R(E)) were considered as random effects. The least squares means statement was used to test the SY and CRS means of 16 CP sugarcane genotypes. The results were declared significant for p < 0.05 and highly significant for p < 0.01, 0.001.
GGE biplot analysis was used to visualize GEI patterns (Yan, Reference Yan2001). The analysis was also undertaken using GGEBiplotGUI package within the GEA-R software (Genotype × Environment analysis with R for Windows) Version 4.1 software (Pacheco et al., Reference Pacheco, Mateo, Gregorio, Francisco, José and Juan2015). The graphs were generated to i) genotype evaluation (mean performance and stability), ii) mega-environment analysis (‘which-won-where’ pattern), and iii) environment/location assessment (the power of environments to discriminate among genotypes/on the basis of discriminating ability and representativeness). Combined data of commercial recoverable sucrose and sucrose yield from all three crop cycles were used from all five locations and all six replications to construct the biplots. In CP breeding program, the genotypes are evaluated over three crop cycles over multi-location trials and then a cultivar is released based on yield of sugar (t.h−1) and cane yield (t.h−1) along with other variables, which lead to enhance the ultimate economic profit to the growers. The basic models used in this analysis are based on Yan and Kang (Reference Yan and Kang2003) and have been detailed in Frutos et al. Reference Frutos, Galindo and Leiva2014. All biplots were generated using the first principal component (IPCA1 and IPCA2) PC1 and PC2 based on standard deviation (SD) scale method, environment centered (centering 2), and genotype-focused singular value partition (SVP) (Yan et al., Reference Yan, Kang, Ma, Woods and Cornelius2007).
Results and Discussion
Analysis of variance and genotype performance at different locations
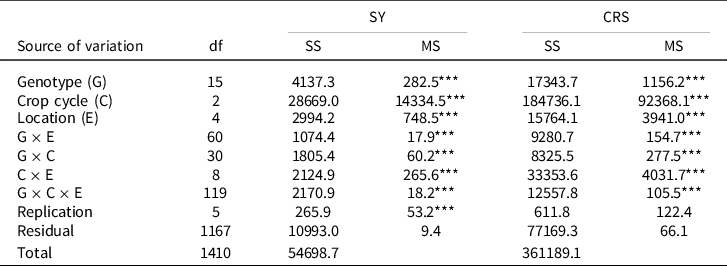
The combined analyses of variance for sucrose yield (SY, t.ha−1) and CRS (kg.t−1) for the 16 genotypes evaluated at five locations across three crop cycles are presented in Table 3. The analyses showed highly significant effects (p ≤ 0.001) of genotypes (G), locations (E), and crop cycles (C) for both traits. The three-way interaction effect, G × E × C, was highly significant (p ≤ 0.001) for both traits, which means that ratooning performance of the tested genotypes was dependent on location. Significant (p ≤ 0.001) G × E for both traits indicated the importance of testing genotypes in more locations rather than for more ratoons. The genotype (G) by crop cycles (C) revealed significant (p ≤ 0.001) effect for both traits indicating the genotype performed differently among the three crop cycles. Genotype by crop interaction was reported to be important in determining the sugarcane yield and its associated traits (Glaz and Kang, Reference Glaz and Kang2008; Milligan et al., Reference Milligan, Gravois, Bischoff and Martin1990; Orgeron, Gravois and Bischoff, Reference Orgeron, Gravois and Bischoff2007).
Combined analysis of variance for sucrose yield (SY, t.ha−1), commercial recoverable sucrose (CRS, kg.t−1) of 16 sugarcane genotypes tested across five environments for three crop cycles

*, **, and *** indicate significant at P ≤ 0.05, 0.01, and 0.001 levels, respectively.
df: degree of freedom; SS: sum of squares; MS: mean squares.
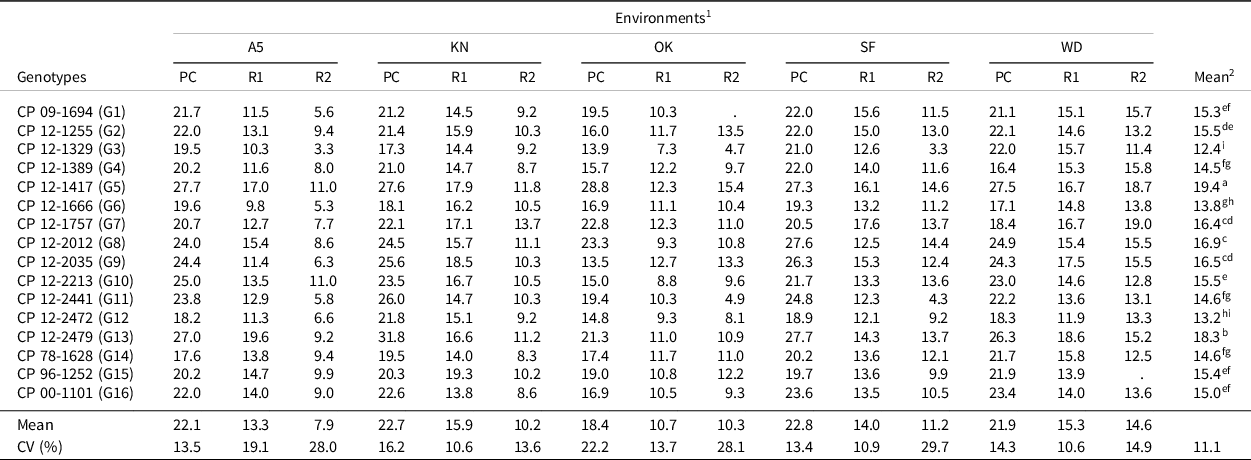
A yield variation explained by environments indicated that the environments were diverse, with differences among environmental means one of the significant causes of the variation in sucrose yield. Sucrose yield (averaged across genotypes) over the locations ranged from 18.4 (OK) to 22.8 t.ha−1 at (SF) for plant cane; from 10.7 t.ha−1 at OK to 15.9 t.ha−1 at KN for first ratoon, and from 7.9 t.ha−1 at A5 to 14.6 t.ha−1 at WD for second ratoon (Table 4). CRS values (average across genotypes) over the locations ranged from 103.1 kg.t−1 (KN) to 118.0 kg.t−1 (A5) for plant cane; 100.5 kg.t−1 (KN) to 106.6 kg.t−1 (OK) for first ratoon, and 71.0 kg.t−1 (A5) to 90.2 kg.t−1 (WD) for second ratoon (Table 5). The environmental effect on sugar and cane yield was also reported in several other sugarcane studies (Duma et al., Reference Duma, Shimelis, Ramburan and Shayanowako Admire2019; Gilbert et al., Reference Gilbert, Shine, Miller, Rice and Rainbolt2006; Momotaz et al., Reference Momotaz, Davidson, Zhao, McCord, Sandhu, Baltazar, Islam and Coto Arbelo2021; Silveira et al., Reference Silveira, Kist, Paula, Barbosa, Peternelli and Daros2013). Our results further revealed that effect of location (environment) on sucrose yield was much higher than that on CRS because the CV values across five location were 11.1% for sucrose yield and 4.0% for CRS.
Sucrose yield (t.ha−1) for all genotypes tested across three crops of plant cane (PC), first ratoon (R1), and second ratoon (R2) at five locations of A5, KN, OK, SF, and WD

1 Abbreviations: Five locations (A5, KN, OK, SF, and WD) abbreviations can be found in Table 2.
2 LS-means with same letter are not significantly different.
Commercial recoverable sucrose (CRS, kg.t−1) for all genotypes tested across three crops of plant cane (PC), first ratoon (R1), and second ratoon (R2) at five locations of A5, KN, OK, SF, and WD

1 Abbreviations: Five locations (A5, KN, OK, SF, and WD) abbreviations can be found in Table 2.
2 LS-means with same letter are not significantly different.
Sucrose yield (averaged across environments) ranged from 12.4 t.ha−1 (CP 12-1329) to 18.3 t.ha−1 (CP 12-2479) (Table 4). CRS (averaged across environments) ranged from 90.2 kg.t−1 (CP 12-2035) to 103.3 kg.t−1 (CP 00-1101) (Table 5).
The significant GEI, for both traits, indicated that genotypes had variable performances over locations. The GEI for both traits was of a crossover type as revealed by differential yield ranking of genotypes across environments (Tables 4 and 5). For SY, genotype CP 12-1417 was the top ranking genotype at three environments (A5, OK, WD) in the plant cane crop cycle, for first ratoon at two locations (OK and SF) and for second ratoon crops at all locations except tied with CP 12-2213 at locations A5. In comparison, CP 12-2479 was the top-yielding clone at two locations (KN and SF) in plant cane, two locations (KN and OK) in first ratoon; however, it was not the top yielder for second ratoon at any location. CP 12-2479 showed the highest sugar yield (31.8 and 27.7 t.ha−1) in the best environment (KN and SF, respectively, in plant cane), whereas clone CP 12-1417 was the highest yielder (28.8 t.ha−1) at the lowest yielding environment (OK in plant cane and lowest yielding environment A5 in second ratoon). The yield was lower in ratoon crops. In first ratoon, clone CP 12-2035 was the highest yielder (12.7 and 18.5 t.ha−1) both at the lowest yielding environment (OK) and at the highest yielding environment (KN). In second ratoon, CP 12-1417 was the highest yielder at both the lowest yielding environment (A5) and the highest yielding environment (WD) (Table 4).
In this study with both traits (SY and CRS), the location, genotype, and crop year were significantly responsible for the greatest part of the variations. Performance of genotypes on different crop cycles (PC, R1, and R2) (Tables 4 and 5) is a complex situation, which is not only due to the ratooning ability of a genotype but also others factors, such as crop management, stalk damaged by mechanical harvesting, crop maturity, time of the harvest, and soil compaction (Naseri, Jafari and Alimohammadi, Reference Naseri, Jafari and Alimohammadi2007; Orgeron, Gravois and Bischoff, Reference Orgeron, Gravois and Bischoff2007).
Changes in SY among genotypes were observed over locations and over crop cycles, which affected the ranking of the genotypes displaying GEI similar to that observed by Duma et al., (Reference Duma, Shimelis, Ramburan and Shayanowako Admire2019), Rea et al., (Reference Rea, De Sousa-Vieira, Díaz, Ramón, Briceño, George, Niño and Demey2015), Silveira et al. (Reference Silveira, Kist, Paula, Barbosa, Peternelli and Daros2013), Gilbert et al., (Reference Gilbert, Shine, Miller, Rice and Rainbolt2006), and Milligan (Reference Milligan1994) in their studies with sugarcane. The significant sugar yield reduction in ratoon crops may be due to genotype, duration of growing time, harvest time environment, and management practices (Gilbert et al., Reference Gilbert, Shine, Miller, Rice and Rainbolt2006; Salassi and Milligan, Reference Salassi and Milligan2013). Usually sugarcane grows for a longer time in plant cane crop cycles than the ratoon crops, particularly second ratoon. In our earlier studies with cane yield, we have also seen yield decrease in ratoon crops compared to the plant crop cycle, and we have reviewed that phenomenon which is due to genotype, environment, and management practices (Momotaz et al., Reference Momotaz, Davidson, Zhao, McCord, Sandhu, Baltazar, Islam and Coto Arbelo2021). In this study, significant GEI represents interaction of genotype with both location and crop cycle as yield is influenced by ratooning ability and by environments.
Genotype evaluation based on GGE biplot
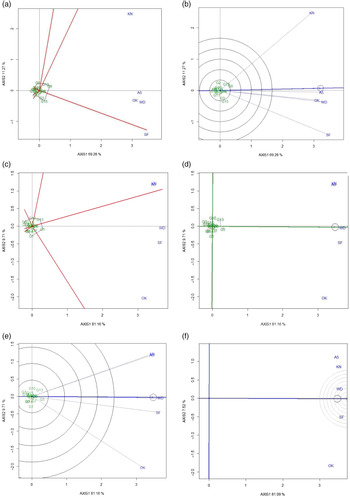
The GGE biplots for CRS and sucrose yield (SY) of 13 genotypes along with their check cultivars are shown in Figure 1a–f. The analysis was done using combined data from all three crop cycles for both CRS and SY separately and from all five locations. In this study, the first two principal components (PC1 and PC2) captured 69.3% and 11.3% of the variations, respectively, for CRS (Figure 1a-and 1b). For SY, the two PCs captured 81.2% and 9.7% of the variations, respectively, (Figure 1c–f). These two PCs would be adequate to explain the phenotypic variation and would allow sufficiently concrete conclusions (Crossa et al., Reference Crossa, Gauch and Zobel1990; Zobel et al., Reference Zobel, Wright and Gauch1988).
GGE biplot showing a) mega environments in a polygon view for commercial recoverable sucrose (CRS) yield (kg.t−1); b) showing comparison of five locations for CRS yield (kg.t−1); c) mega environments in a polygon view for sucrose yield (t.ha−1); d) mean yield and stability performance of the for sucrose yield (t.ha−1); e) genotype-focused scaling for comparison for sucrose yield (t.ha−1); f) biplot for the environments in the study based on representative locations using sucrose yield (t.ha−1). All GGE-biplots are for mean data over three crop cycles (PC, R1, and R2) of 16 clones for mean of all locations. Sixteen clones are in green colored point and numbered from 1 to 16. Five locations (A5, KN, OK, SF, and WD) are also shown in each panel. The specific genotype code numbers and location abbreviations can be found in Tables 1 and 2.

Commercial Recoverable Sucrose
Figure 1a shows the ‘which won where’ view of the GGE biplot for CRS yield of 16 genotypes over three crop cycles at 5 locations. The outmost genotypes formed the polygon. These are the genotypes with the largest vector length perfomed in their respective area based on their best or poorest performance. The rest of the genotypes contained in the polygon are less responsive. The genotypes CP 12-2035 (G9), CP 12-2479 (G13), CP 12-1255 (G2), CP 12-2012 (G8), CP 00-1101 (G16), CP 12-2441 (G11), and CP 96-1252 (G15) had the largest vector length in their respective area. The five locations formed two groups. Locations KN, A5, OK, and WD formed one group with the winning genotype of CP 12-2479 (G13) and location SF formed a separate group with the winning genotype of CP12-1417 (G5). This figure suggested there might be two mega environments.
Figure 1b shows discriminating power versus a representativeness view. According to Yan and Kang (Reference Yan and Kang2003), the ideal location is the one closest to the pointing arrow. All the locations had acute angles between them; hence, all of them were positively correlated. The KN location had the longest projection from the biplot origin followed by location SF indicates that these two locations were more discriminating. The most representative locations were A5 followed by OK and WD which showed a smaller angle with the Average Environment Axis (AEA). A5 was the most representative among all five of the test locations, which would allow to test for generally adapted varieties (Yan and Tinker, Reference Yan and Tinker2006), but this was not in accordance with the study of Glaz and Kang (Reference Glaz and Kang2008). In their analysis with theoretical recoverable sugar (TRS) for CP genotypes on mineral soil, the location SF was the most representative followed by KN, WD.
Sucrose yield
Figure 1c is the polygon view of GGE biplot’s ‘which won where view’ showing the best genotype in each environment. In this figure, the genotypes CP 12-1417 (G5), CP 12-2479 (G13), CP 12-2213 (G10), CP 12-1329 (G3), CP 12- 1666 (G6), and CP 09-1964 (G1) had the largest vector length in their respective area. Genotype CP 12-1417 (G5) had the highest yield in locations WD, SF, and OK, whereas CP 12-2479 (G13) was the best genotype for location A5 and KN (Figure 1c). The rest of the genotypes were less responsive to any of the locations. The locations WD, SF, and OK were grouped together. The locations A5 and KN were grouped seperately. However, with CRS yield the grouping of the locations was not similar (Figure 1a). With the cane yield data of the same experiement, locations, KN, A5, and WD fromed one mega environment and OK and SF formed another mega environment (data not showing), which is not in agreement with this study using SY and CRS data. The ‘which-won-where’ pattern found in this studies (Figure 1a and 1c) is suggesting the possible existence of different groupings in terms of CRS yield and sugar yield (Glaz and Kang, Reference Glaz and Kang2008; Yan and Kang, Reference Yan and Kang2003; Yan and Hunt, Reference Yan and Hunt2001).
Figure 1d shows genotypes’ mean yield (SY) and stability performance of genotypes across the locations. The average tester axis (ATA) line, passing through the origin of the biplot with the arrow points to it and a small black circle close to the arrow indicating the position of the average tester, and the horizontal line points to a greater instability in either direction (Yan, Reference Yan2001; Yan and Tinker, Reference Yan and Tinker2006). The genotype CP 12-1417 (G5) had the highest mean yield among all the genotype tested followed by CP 12-2479 (G13), CP 12- 2012 (G8), CP 12-2035 (G9), and CP 12-1757 (G7). All other genotypes were further away from the ATA-X-axis arrow and had below average mean yield. Among the genotypes with high mean yield, CP 12-2479 (G13), CP 12-1757 (G7), and CP 12-1417 (G5) had longer projection (higher PCA2 values) than the genotypes CP 12-2012 (G8) and CP 12-2035 (G9) which means they were less stable compared to CP 12-2012 (G8) and CP 12-2035 (G9). CP 12-1417 (G5) was the best performer through all the crop cycles (data not shown) and it had the highest mean yield followed by CP 12-2479 (G13), CP 12-1757 (G7) (Table 5). Growers prefer to grow sugarcane through a number of ratoon crops; thus, a variety is selected based on its performance averaged across three crop cycles. In addition to the mean sucrose and cane yield, genotypic stability is important to select a variety. Based on the highest mean sucrose yield and stability in all crop cycles, the clone CP 12-1417 would be the superior genotype to choose as it was reported that the increase in sucrose yield was mainly due to cane yield rather than CRS (Zhao et al., Reference Zhao, Zhu and Momotaz2020; Zhao and Yang-Rui, Reference Zhao and Yang-Rui2015; Khan I.A. et al., Reference Khan, Seema, Raza, Yasmine and Bibi2013).
Figure 1e shows a comparison of genotypes using an ideal genotype focusing scale. In this figure, the genotype CP 12-1417 (G5) was the ideal genotype in terms of higher sucrose yielding ability and stability as it is in the first concentric circle with an arrow pointing to it (Yan and Kang, Reference Yan and Kang2003). Figure 1f shows discriminating power and representativeness of the GGE biplot with ideal location, which allowed the evaluation of the test environment to identify environments that may serve to select superior genotypes in an efficient way for a mega environment. The selected test environment should have high genotype discriminating ability and representativeness. All the environments tested here presented long vectors, which means they have high discriminating ability for the genotypes. The location WD had the smaller angle between an environment and the mean-environment axis (blue axis), the higher is its representativeness as well as representative. KN, A5, and OK have long vectors but greater angles, implying that these locations are most discriminating.
The realtionship among environments using mean sucrose yield of 13 promising sugarcane genotypes (see Tables 1 and 2 for genotype and environment names) is presented in Figure 1e. The vector view depicts the relationship among environments. The angle between two environment vectors determines the correlation between two locations; acute angle between two test environmental vectors indicates a positive correlation, an obtuse angle indicates a negative correlation, and a right angle infers no correlation. The length of the vectors represents a location’s ability to discriminate genotypes (Yan and Tinker, Reference Yan and Tinker2006; Yan and Kang, Reference Yan and Kang2003; Ahmadi et al., Reference Ahmadi, Vaezi and Fotokian2012). The locations A5 and KN had the smallest angle between them and thus provided same information with sucrose yield. Locations A5, KN, and OK had the longest vectors with large angle with AEA. These locations may be useful of culling unstable genotypes (Yan and Tinker, Reference Yan and Tinker2006). The location WD had a smaller angle with the AEA and it was placed close to the small black circle and close to the arrow indicating the position of the average tester; thus, it was the most representative location among all five test locations. This allows testing for generally adapted varieties (Yan and Tinker, Reference Yan and Tinker2006).
In this study with CRS, the locations KN and SF were more discriminating and less representative test environments as they had the longest vectors. With sucrose yield, the locations KN, A5, and OK were most discriminating. The locations A5 for CRS yield and WD for sucrose yield had the smallest angle with the AEA and were close to the average tester. In our earlier study with cane yield data, the location WD had an acute angle with AEA in PC and R1 crop cycles and was considered as representative environment among all the five tested environments which is in accordance with this study (Momotaz et al., Reference Momotaz, Davidson, Zhao, McCord, Sandhu, Baltazar, Islam and Coto Arbelo2021). In that same study, locations OK and KN were found to be more discriminating (data not showing) which is in accordance with this study with SY. In this study with CRS, locations A5, OK, and WD had the shorter vector length among the tested five locations. For SY, WD and SF also had the shorter vector length which is in accordance with the study of Glaz and Kang (Reference Glaz and Kang2008). In their study with combined cane and sucrose yield data from all crop cycles (PC1 to R2) of sugarcane, the location WD and SF had the lowest genotype discrimination ability (Glaz and Kang, Reference Glaz and Kang2008). They also reported that for sucrose yield, locations A5 and OK had the short vectors with low genotype discriminating ability, which is not in accordance with our study. To verify a variety’s GEI’s pattern and to delineate mega environments EAA area’s muck soil, it is necessary to conduct more studies across more variety series.
Conclusion
In this study, it can be concluded that the differential response of the sugarcane genotypes based on CRS and SY over the locations was not only because of genotypes, the location, and crop cycles but also due to the tested locations and their interaction. The GGE biplot analysis indicated that CP 12-1417 would be the most productive genotype in terms of sugar yield and stability across the locations tested. The locations A5, KN, and OK were found to be more discriminating and non-representative test environments for sucrose yield. The locations WD and SF for sucrose yield had an acute angle with the AEA and had the shortest vector length among tested environments for both traits which means they have lowest genotype discriminate ability.
Acknowledgements
The authors would like to thank Zachary Young for collecting data. We also thank all other staffs at Canal Point and Belle Glade for planting, harvesting, and sample processing.
Disclosure Statement
The authors declare no conflict of interest.