INTRODUCTION
Meteorological conditions can influence the main biological processes responsible for plant growth and development affecting vegetative growing, setting and ripening of different plant organs, onset and duration of phenological stages and the final production, exerting a strong impact on agricultural activities. In particular, the study of the variability of timing and length of the growing season is gaining importance because plant phenology is a sensitive indicator of climate change and has large impacts on terrestrial ecosystems through changes in productivity and in the annual carbon and water cycles (D'Odorico et al. Reference D'Odorico, Yoo and Jaeger2002; Klik & Eitzinger Reference Klik and Eitzinger2010). At present, there is general consensus on the existence of a strong climatic variability, which is perceived as a signal of a global climatic change.
Grapevine (Vitis vinifera) growing is one of the major agricultural economic activities in Italy. The effect of weather variables on vine has been described in numerous papers. Meteorological conditions can influence the main processes responsible for grapevine growth and development, and therefore the final characteristics of the wines (Moncur et al. Reference Moncur, Rattigan, Mackenzie and McIntyre1989; Mullins et al. Reference Mullins, Bouquet and Williams1992; Jones & Davis Reference Jones and Davis2000a, Reference Jones and Davisb; Esteves & Manso Orgaz Reference Esteves and Manso Orgaz2001; Grifoni et al. Reference Grifoni, Mancini, Maracchi, Orlandini and Zipoli2006; Vilanova et al. Reference Vilanova, Santalla and Masa2009). For many years, mathematical descriptions of these effects have been formulated in order to provide users (farmers, technicians, extension services, researchers, etc.) with operational tools for processing information to improve management and planning activities (Grifoni et al. Reference Grifoni, Mancini, Orlandini, Rossi and Zipoli2003). Simple bio-climatic indices, complex statistical relationships, empirical and mechanistic simulation models (Bindi et al. Reference Bindi, Miglietta, Gozzini, Orlandini and Seghi1997a, Reference Bindi, Miglietta, Gozzini, Orlandini and Seghib; Weiss & Wilhelm Reference Weiss and Wilhelm2006) can be applied using climatic data, weather monitoring and forecasting as driving variables for obtaining a definition of vine responses to meteorological conditions (Huglin Reference Huglin1986).
In addition to common meteorological information supplied by local or synoptic weather stations, the use of large-scale climatic variables has also been investigated in order to forecast agricultural yields and production quality in several regions of the world (Atkinson et al. Reference Atkinson, Kettlewell, Hollins, Stephenson and Hardwick2005; Grifoni et al. Reference Grifoni, Mancini, Maracchi, Orlandini and Zipoli2006; Ribeiro et al. Reference Ribeiro, Cunha and Abreu2009).
Large-scale climate variability affects average conditions considerably and is therefore likely to influence the phenology of plants. In Europe, the North Atlantic Oscillation (NAO) seems to be responsible for a large component of climate variability (Post & Stenseth Reference Post and Stenseth1999; Benestad Reference Benestad2001; Wanner et al. Reference Wanner, Bronnimann, Casty, Gyalistras, Luterbacher, Schmutz, Stephenson and Xoplaki2001; Sivle Reference Sivle2005), particularly influencing winter weather and, through climate interactions on plants, flowering time of many tree species (Klaveness & Wielgolaski Reference Klaveness and Wielgolaski1996; Gormsen et al. Reference Gormsen, Hense, Toldam-Andersen and Braun2005; Avolio et al. Reference Avolio, Pasqualoni, Federico, Fornaciari, Bonofiglio, Orlandi, Bellocci and Romano2008).
The higher correlation between NAO and meteorological conditions, in particular precipitation and temperature, is typically observed during the winter period of December/January–March (Hurrell Reference Hurrell1995).
A positive winter NAO phase results in prevailing westerly winds that are strengthened with low pressure anomalies in the Icelandic region and high pressure anomalies across the subtropical Atlantic Ocean. It is associated with increased precipitation and temperatures over northern Europe; however, it is also strongly related to higher than average pressure and drier conditions in the Mediterranean regions. The opposite conditions occur during a negative NAO phase.
The positive correlation between NAO and winter temperature gradually decreases from northern Europe towards the Mediterranean basin, with negative values over North Africa. With this pattern, northern and central Italy shows a positive correlation that becomes negligible in the southern part of the country (Hurrell & Van Loon Reference Hurrell and Van Loon1997; Osborne et al. Reference Osborne, Briffa, Tett, Jones and Trigo1999).
At the same time, winter meteorological conditions play an important role in processes controlling the termination of dormancy and bud-break, strongly affecting the onset of the growing season, spring flowering phenophases and pollen season of different woody plants in North Atlantic and southern Europe (Fitter et al. Reference Fitter, Fitter, Harris and Williamson1995; Klaveness & Wielgolaski Reference Klaveness and Wielgolaski1996; D'Odorico et al. Reference D'Odorico, Yoo and Jaeger2002; Gormsen et al. Reference Gormsen, Hense, Toldam-Andersen and Braun2005; Avolio et al. Reference Avolio, Pasqualoni, Federico, Fornaciari, Bonofiglio, Orlandi, Bellocci and Romano2008; Nordli et al. Reference Nordli, Wielgolaski, Bakken, Hjeltnes, Måge, Sivle and Skre2008). The present study was undertaken to describe the relationship between large-scale (NAO index and geopotential height field) and local (air temperature and precipitation) meteorological information with grapevine phenology with a view to exploring possibilities in terms of predicting bud-break, flowering and harvest time. The historical influence of climate change and variability on grapevine phenology for the last 40 years, through the trend analysis of meteorological information, and their effect on grapevine phenological stages onset was also investigated.
MATERIALS AND METHODS
In the present study, data series of phenological stages of Sangiovese grapevine were analysed for the productive area of Montepulciano wine. The study area, located in Tuscany (Central Italy, 43°05′E, 11°46′N, 575 m asl), is characterized by a typically Mediterranean climate, mainly affected by Azores and Russian anticyclones, and by Mediterranean depressions, with a mean annual temperature of c. 14°C and a cumulated precipitation of 700 mm, mostly distributed during winter and autumn.
Bud-break, flowering and harvest dates were used for the analysis and related to meteorological information. A data series for bud-break date was available from 1979 to 2006, while flowering and harvest date series were available from 1970 to 2006. Data, expressed as the day of the year in which the phenological stage was reached (Balloid & Baggiolini Reference Balloid and Baggiolini1993), were collected by skilled field operators and considered as the mean value of 20 vines. The criteria for cultivation and production of Nobile di Montepulciano are homogeneous and are regulated by the standards of the Consortium (available online at: http://www.consorziovinonobile.it/104-41/ENG/DISCIPLINARY).
Air temperature and precipitation data were obtained from a standard weather station located in the study area. The historical series of air temperature and precipitation data from 1970 to 2006 underwent quality controls and were subsequently homogenized via the Craddock test (Craddock Reference Craddock1979; Bartolini et al. Reference Bartolini, Morabito, Crisci, Grifoni, Torrigiani, Petralli, Maracchi and Orlandini2008). Air temperature data over the wine production area were also obtained by reanalysis data at sea level and geopotential heights at the 925 and 850 hPa levels (925 and 850 hPa GPH), i.e. the air temperature is observed at the altitude where the air pressure is the specified level of hPa; 925 and 850 hPa GPH correspond to altitudes of c. 750 and 1500 m asl, respectively. Reanalysis is achieved by reprocessing and combining past observations (from ground, satellite, soundings, etc.) with the output of weather forecast models in order to derive a complete spatial/temporal description of the state of the environment at a global level. This information, available from 1948 onwards, was provided by the NOAA-CIRES Climate Diagnostics Center, Boulder, Colorado, USA (http://www.cdc.noaa.gov/) and processed by the NCEP/NCAR Reanalysis Project (Kalnay et al. Reference Kalnay, Kanamitsu, Kistlter, Collins, Deaven, Gandin, Iredell, Saha, White, Woollen, Zhu, Chelliah, Ebisuzaki, Higgins, Janowiak, Mo, Ropelewski, Wang, Leetma, Reynolds, Jenne and Joseph1996).
The 500 hPa GPH, representing the altitude (m) where the air pressure is 500 hPa (closely related to the sea level pressure and consequently to meteorological characteristics at ground level), was also obtained from reanalysis data. The NAO index, derived from meteorological information and in particular from sea level pressure, was also used. The NAO index is based on the difference of normalized sea level pressure between the Azores and Iceland. It can be described as a temporal fluctuation of the zonal wind strength across the Atlantic Ocean due to pressure variation in both the sub-tropical anticyclone belt and the sub-polar low near Iceland. In the northern hemisphere, the winter NAO index (December/January–March) shows a significant relationship with storm track, temperature and precipitation (Hurrell & van Loon Reference Hurrell and Van Loon1997). An extended version of the index can be obtained for the winter half of the year by using a station in the south-western part of the Iberian Peninsula (Hurrell Reference Hurrell1995). Jones et al. (Reference Jones, Jonsson and Wheeler1997) used early instrumental data to extend the NAO index calculated from Gibraltar and Iceland back to 1823. The present study used the latter version of the index (http://www.cru.uea.ac.uk/).
The correlations between dates of different phenological stages and air temperature and precipitation data over the Montepulciano production area were calculated. They were calculated on a monthly to a multi-monthly basis in order to identify the periods with the best correlation. Correlations of the NAO index and the 500 hPa GPH with air temperature both from the ground station and reanalysis data at different levels were also calculated over the wine production area.
The dates of phenological stages were correlated with NAO index (again on a monthly to a multi-monthly basis) and with the 500 hPa GPH, producing correlation maps, to verify the possible impact of some large-scale phenomena on phenophases (Nemani et al. Reference Nemani, White, Cayan, Jones, Running, Coughlan and Peterson2001). Tele-connections in atmospheric science are climate anomalies which are related to each other at large distances (typically thousands of km). The correlation maps, obtained from the interactive website of the NOAA-CIRES Climate Diagnostics Center, show the distribution of the correlation coefficient between phenological phase date and the 500 hPa GPH in each pixel of a European-North African area. In other words, these maps allow verification of the existence of tele-connections between the date of phenological stages onset in the study area and the 500 hPa GPH of previous months over a more extended area. In order to quantify the existing tele-connection between phenological stages and 500 hPa GPH inside the European–North African area and to define the regression functions during the highest correlation periods, 500 hPa GPH data over the more correlated pixels were extracted from the internet database and correlated with the phenological data series.
Finally, the trends of historical series, both climatic and phenologic, were analysed for the evaluation of impacts of climate change and variability on grapevine phenology and so to identify possible short- and long-term adaptation options for Tuscany viticulture. The trend analysis was performed by linear regression analysis for the normally distributed data of air temperature (1948–2008, reanalysis data), GPH (1948–2008, reanalysis data) and phenological dates (1970/1979–2006, observed data), and by non-parametric tests for precipitation (1952–2006, 22 ground weather stations data scattered on the regional area). In particular, the Excel template programme MAKESENS (Version 1.0; Salmi et al. Reference Salmi, Määttä, Anttila, Ruoho-Airola and Amnell2002), which applies the non-parametric Mann–Kendall test for testing the presence of monotonic increasing or decreasing trend and the non-parametric Sen's method for estimating the slope of a linear trend, was used (Gilbert Reference Gilbert1987).
RESULTS
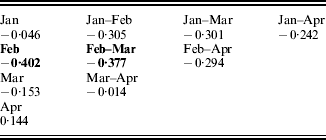
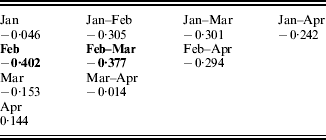
Bud-break date was negatively correlated with NAO index for February (r=−0·402, P⩽0·05) and for the period February–March (r=−0·377, P⩽0·05), even when the month of March did not show a significant correlation when considered as a single month (Table 1).
Correlation coefficient (r) between grapevine bud-break date and monthly or multi-monthly average NAO index. Critical values of r for statistical significance are: r⩾0·361, P⩽0·05; r⩾0·463, P⩽0·01; r⩾0·570, P⩽0·001. Values in bold indicate a significance of at least P⩽0·05
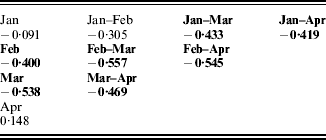
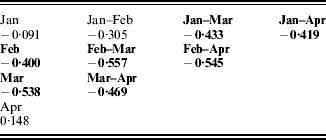
A significant negative correlation was also found between bud-break date and 500 hPa GPH in February and March over all of the Mediterranean area (data not shown); the highest correlations were obtained using the 500 hPa GPH over the wine production area, reaching r=−0·557 (P⩽0·01) for the period February–March (February r=−0·400, P⩽0·05; March r=−0·538, P⩽0·01; Table 2).
Correlation coefficient (r) between grapevine bud-break date and monthly or multi-monthly average 500 hPa geopotential height over the wine production area. Critical values of r for statistical significance are: r⩾0·361, P⩽0·05; r⩾0·463, P⩽0·01; r⩾0·570, P⩽0·001. Values in bold indicate a significance of at least P⩽0·05
At the same time, negative correlation coefficients between bud-break and air temperature were observed over the wine production area during the same periods (data not shown). No significant correlation was found between bud-break date and accumulated precipitations in previous months.
NAO index, 500 hPa GPH and air temperature seemed to have a simultaneous effect on the onset of phenological phase; therefore their possible interdependence was investigated.
NAO index and 500 hPa GPH over the wine production area were significantly correlated during winter months (data not shown) because of the connection between NAO index and atmospheric configuration on Europe.
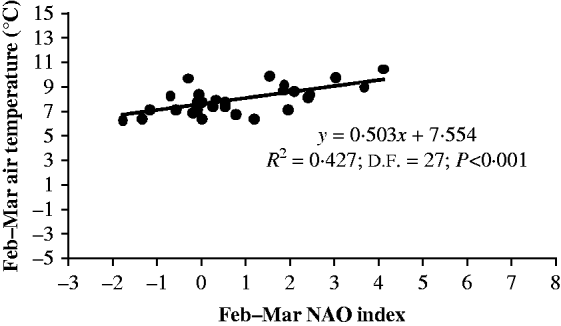
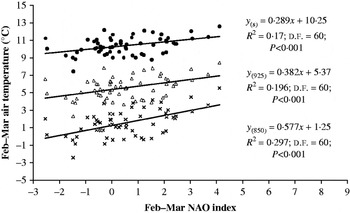
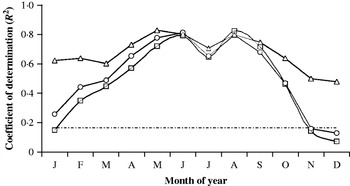
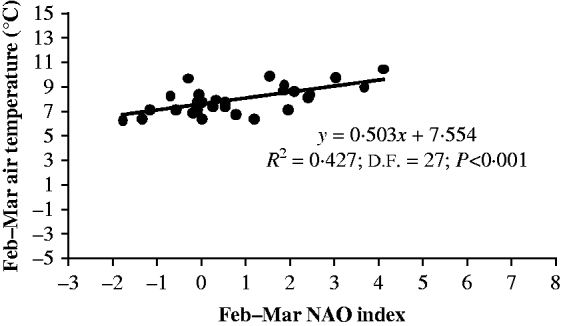
The results obtained showed a highly significant positive correlation between February–March NAO index and February–March air temperature measured by ground stations over the wine production area from 1979 to 2006 (Fig. 1). This positive significant correlation was confirmed using air temperature reanalysis data at different altitudes for 1948–2009 (Fig. 2) and 1979–2006 (data not shown); the correlation increased from the surface to 925 and, particularly, to 850 hPa GPH (Fig. 2). The dependence of air temperature at different heights on the 500 hPa GPH field distribution was, as expected, very strict, particularly from February to October, with a maximum during the summer months (r=0·894, P⩽0·001). A non-significant relationship was found during November and December for surface and 925 hPa GPH levels, while the coefficient of determination was always significant at 850 hPa GPH (Fig. 3). Considering this relationship, particularly significant in spring and autumn, for flowering and harvest dates the analysis and the discussion was performed in terms of GPH instead of air temperature. In fact, the use of GPH could represent a more interesting and valuable measure due to its large-scale value and its free availability on the internet.
Linear correlation between NAO index and air temperature measured by ground station during the period February–March (1979–2006). Legend: R 2=coefficient of determination, d.f.=degrees of freedom.
Linear correlations between NAO index and reanalysis air temperature at surface (●), 925 (∆) and 850 (×) hPa during the period February–March (1948–2009). Legend: R 2=coefficient of determination, d.f.=degrees of freedom.

Trend of the coefficient of determination (R 2) between 500 hPa GPH and reanalysis air temperature at surface (□) and at 925 (○) and 850 (∆) hPa GPH levels during different months of the year (1948–2008) in the wine production area. Dotted line indicates P<0·001.

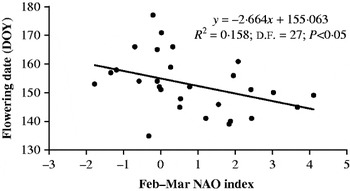
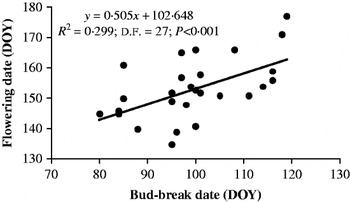
Flowering of grapevine in the study area usually occurs between mid-May and early June. The NAO index of single months showed no correlation with flowering stage (data not shown), but a significant negative correlation was found between the NAO index for February–March (r=−0·397, P⩽0·05) and the phenological stage date (Fig. 4). In view of the previously cited negligible effect of the NAO index on meteorological conditions over the study area during non-winter periods, therefore during the flowering phase, an indirect effect of NAO was supposed by investigating a direct relationship between bud-break date (affected by NAO) and flowering time (Fig. 5).
Linear correlation between February–March NAO index and grapevine flowering phase date. Legend: DOY=day of the year, R 2=coefficient of determination, d.f.=degrees of freedom.

Linear correlation between grapevine bud-break and flowering phase dates. Legend: DOY=day of the year, R 2=coefficient of determination, d.f.=degrees of freedom.

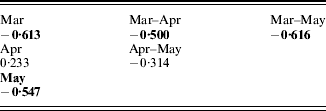
Flowering dates were negatively related to GPH over the wine production area in March (r=−0·613, P⩽0·001) and May (r=−0·547, P⩽0·01), while there seems to have been no effect in April (Table 3).
Correlation coefficient (r) between grapevine flowering date and monthly or multi-monthly average 500 hPa geopotential height over the wine production area. Critical values of r for statistical significance are: r⩾0·361, P⩽0·05; r⩾0·463, P⩽0·01; r⩾0·570, P⩽0·001. Values in bold indicate a significance of at least P⩽0·05
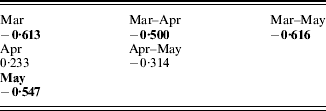
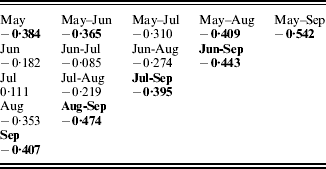
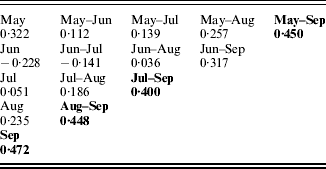
Harvest is usually conducted from mid-September to mid-October, depending on different environmental and physiological factors. The NAO index did not significantly affect harvest date, confirming that its effect on meteorological conditions is limited mainly to winter and, less strongly, to early spring. On the other hand, a higher 500 hPa GPH over the wine production area from May (r=−0·384, P⩽0·05) to September (r=−0·407, P⩽0·05) seems to have a large effect on harvest date (Table 4). During that period, the month of July had a negligible contribution to the negative correlation. With regard to rainfall, a positive correlation was found between cumulated precipitation in September and harvest date (r=0·472, P⩽0·01; Table 5).
Correlation coefficient (r) between grapevine harvest date and monthly or multi-monthly average 500 hPa geopotential height over the wine production area. Critical values of r for statistical significance are: r⩾0·361, P⩽0·05; r⩾0·463, P⩽0·01; r⩾0·570, P⩽0·001. Values in bold indicate a significance of at least P⩽0·05
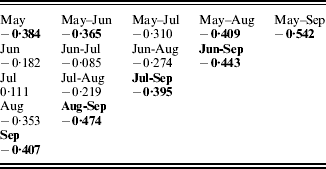
Correlation coefficient (r) between grapevine harvest date and monthly or multi-monthly average precipitations. Critical values of r for statistical significance are: r⩾0·361, P⩽0·05; r⩾0·463, P⩽0·01; r⩾0·570, P⩽0·001. Values in bold indicate a significance of at least P⩽0·05
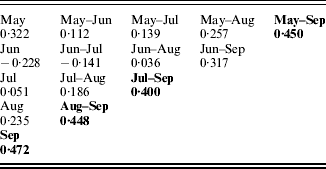
The trends of historical time series were analysed in order to evaluate the impacts of climate change and variability on grapevine phenology and so to identify possible short- and long-term adaptation options for Tuscany viticulture.
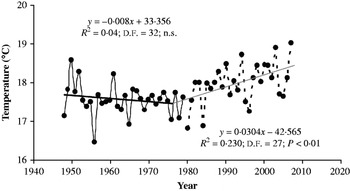
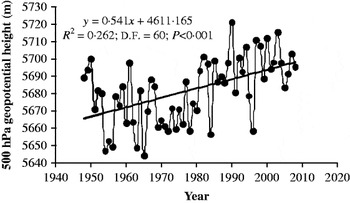
The reanalysis of air temperature for February–September over the wine production area of Tuscany showed a dual trend: not significant during the first 33 years, positive and significant after the 1980s (P⩽0·01) (Fig. 6). The 500 hPa GPH over the wine production area for the same period showed a similar trend, increasing its value by c. 30 m (Fig. 7). However, the NAO index showed no significant trend (data not shown) for the period February–September.
Trends of February–September air temperature of the periods 1948–1980 and 1981–2008. Legend: R 2=coefficient of determination, d.f.=degrees of freedom.

Trend of February–September 500 hPa geopotential height (1948–2008). Legend: R 2=coefficient of determination, d.f.=degrees of freedom.

The analysis of precipitation data showed a complex behaviour depending on the season analysed. In fact, winter (December–February) and spring (March–May) rainfall decreased by c. 37 (P⩽0·05) and 25% (P⩽0·05), respectively, over the 53-year period, while the decrease in summer (June–August) precipitation was not significant. In contrast, rainfall in September increased by c. 36% (P⩽0·05).
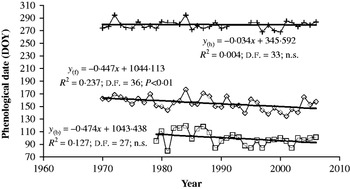
The relationship between plant behaviour and climate, and the potential effect of climate change and variability on the final production, is also confirmed by the modification of phenological stages. The onset of bud-break and flowering showed a negative trend whereas harvest date showed no significant variations during the period analysed (Fig. 8).
Trend of grapevine phenological dates of bud-break (1979–2006), flowering and harvest (1970–2006). Legend: b=bud-break, f=flowering, h=harvest, R 2=coefficient of determination, d.f.=degrees of freedom, ns=not significant.

DISCUSSION
The negative correlation between February–March NAO index and bud-break data was mainly due to the relationship between NAO and weather conditions in the wine production area at the beginning of the grapevine vegetative season. Winter and early spring NAO has a strong and well-documented effect on precipitation and consequently on the cloudiness of the same period. A high winter NAO index, due to the stronger westerlies, is related to higher precipitation in Northern Europe and scarcity of perturbations in the Mediterranean areas (Lamb & Peppler Reference Lamb, Peppler, Glantz, Katz and Nicholls1991; Hurrell Reference Hurrell1995). However, no significant correlations were found between winter precipitation and the bud-break date in the present study. The role of NAO, therefore, could be mainly due to a reduction in cloud cover and consequently greater insolation than average for the positive NAO index phase. Greater sunshine probably leads to an increased surface temperature and thus the heat requirement for various stages of plant development could be reached earlier (Avolio et al. Reference Avolio, Pasqualoni, Federico, Fornaciari, Bonofiglio, Orlandi, Bellocci and Romano2008). The effect of NAO phase on winter air temperature in the Mediterranean area is less evident than in northern Europe; a positive NAO phase in Northern Europe produces a strong westerly flow of warm air (D'Odorico et al. Reference D'Odorico, Yoo and Jaeger2002). In contrast, in winter, northern and central Italy show a positive correlation between NAO index and air temperature, which becomes negligible in the southern part of the country (Hurrell & Van Loon Reference Hurrell and Van Loon1997; Osborne et al. Reference Nordli, Wielgolaski, Bakken, Hjeltnes, Måge, Sivle and Skre1999). For the wine production area, a higher positive correlation between air temperature measured by ground stations and NAO index for the period February–March was found than that reported in the literature (Fig. 1). This is probably because the present data referred to a location at 600 m asl, where the effect of global atmospheric circulation (and consequently of NAO index phase) is more evident and less influenced by local phenomenon (particularly thermal inversion very common in winter). Accordingly, an increase of the correlation between NAO index and air temperature over the wine production area has been verified in the present results by using air temperature reanalysis data at different heights from the surface to 925 and, particularly, to 850 hPa GPH (Fig. 2). The differences in R 2 obtained using reanalysis and ground station air temperature data were significantly reduced considering the same time period, 1979–2006, for both data series.
Similar results were obtained by analysing the 500 hPa GPH value over the wine production area. A high value of 500 hPa GPH determines a situation with high surface pressure and consequently low presence of cyclones over the Mediterranean, with higher levels of both solar radiation and surface temperature. This is mainly seen from February onwards, allowing plants to start growth (Table 2). The results showed that air temperature behaved in a very similar fashion to 500 hPa GPH, leading to almost the same effect on bud-break date. This was due to the high dependency of temperature on 500 hPa GPH starting from February through October and rising to a maximum correlation during summer (Fig. 3). This dependency can be invalid during winter, particularly at low altitudes, when high pressure can determine local phenomena, such as thermal inversion due to the weak air circulation.
The effect of winter NAO on flowering stage was probably an indirect result beginning at the bud-break stage. In fact, the effect of NAO on meteorological conditions is strong during winter and decreases in the spring and early summer months. However, the two stages of bud-break and flowering are partially auto-correlated and the period in between is mainly determined by a thermal summation (Fig. 5). Therefore, the anticipation of bud-break due to high values of winter NAO also has the indirect effect of anticipating flowering in late spring. This inter-dependency between specific phenological stages has also been found for other species (Hurley et al. Reference Hurley, Gilliland and O'Donovan2008).
The negative correlation between 500 hPa GPH (and temperature) over the wine production area and flowering date (Table 3) is probably due to the fact that during March, higher GPH, and consequently higher air temperatures, determine an acceleration of bud-break, while during May it seems to induce a more direct effect on the onset of flowering. As a consequence, March–May is the most important in determining the phase of flowering. However, neither GPH nor temperature during the month of April seems to have any effect on this phenological phase. During this period of the year the shoot is generally formed and its elongation and development before flowering onset is probably more dependent on plant reserves than on meteorological conditions. However, the effect of warm temperature and high pressure conditions during May, when flowering occurs, is confirmed by the direct correlation between flowering date and rainfall in May (r=0·442, P⩽0·05), with rainfall appearing to delay the onset of this phenological stage.
The grape harvest normally occurs between late September and early October. In contrast to the other stages analysed, it depends on different factors, such as the sugar content of grape, the phytosanitary condition of plants and the meteorological conditions in the area. For these reasons, harvest cannot be considered a true phenological phase, but is a complex process also determined by the local experience of individual vine-growers, including their expectations of weather conditions in the near future. As shown by the present results, NAO had no significant effect on harvest date, confirming that the relationship between NAO and meteorological conditions was strongest during winter and early spring months and gradually decreases through the year to complete independence in summer.
The large impact of 500 hPa GPH on harvest date, from May to September, is clearly related to the grape maturation processes, which require warm and dry weather. During that period, July had a negligible effect on the negative correlation between meteorological variables and harvest time, probably because it is usually the warmest month. In fact, the high temperatures that are normally suitable for grape maturation can represent a critical factor; if they are too high, they can cause a slowing down of maturation processes.
The need for a dry period at the end of maturation is also confirmed by the direct relation between rainfall in September and harvest date. The delay of harvest time caused by precipitation is probably due mainly to a double effect; the presence of water and high relative humidity. These conditions during harvest can limit the presence of operators in the field, but can also affect the final quality of the wine by creating particular microclimatic conditions suitable for the development of undesirable mildews on the grapes.
The trend analysis demonstrated that the change and variability of climate, due to global warming, has a direct effect on the phenophases of grapevine in Tuscany. In fact, rising air temperatures and 500 hPa GPH during the vegetative season are sufficient for interrupting the development of dormancy of plants and for starting the biological processes of bud-break and flowering, leading to a general anticipation of the onset of phenological stages of c. 10 and 15 days, respectively. The contemporary absence of a significant trend in NAO index is not surprising because its interconnection with atmospheric circulation is restricted to winter. Hurrell (Reference Hurrell1996) showed a recent (from 1970) significant upward trend in the winter NAO, which accounts for much of the observed regional surface warming over Europe and Asia.
However, the positive trend of precipitation in September is not sufficient to significantly affect the harvest date, because at harvest time all maturation processes are already concluded, and the most important characteristic of precipitation affecting harvest date is not its total quantity but its temporal distribution and duration. Further investigations into this important aspect are required.
The results of the present research demonstrate that large-scale meteorological data can provide crucial information to forecast the most suitable field and marketing operations. In fact, the analysis of these aspects on the basis of current meteo-climatic variability and change has a high importance, also in order to provide the growers with operational and forecasting tools to improve the management and planning of their production.