


Introduction
Colorectal cancer (CRC) causes approximately 900,000 deaths annually and 1.9 million new cases worldwide, making it the second leading cause of cancer-related deaths and the third most common cancer globally.(1) Although CRC is more common in those over 50 years of age, it is increasingly affecting younger individuals, with rising incidence rates among those under 50,(1) highlighting the need for prevention strategies.
Inflammation is closely linked to the development of CRC.(Reference Long, Lundsmith and Hamilton2) For instance, patients with inflammatory bowel disease (IBD), characterised by chronic intestinal inflammation, exhibit an increased risk of developing the disease.(Reference Long, Lundsmith and Hamilton2) The protective effect of anti-inflammatory agents, such as aspirin, further supports the role of inflammation in CRC development.(3) Vitamin D might play a role in CRC prevention through multiple mechanisms. Its active form, 1.25-dihydroxyvitamin D (1.25(OH)D), binds to the vitamin D receptor (VDR) to regulate genes involved in promoting cellular differentiation, inhibiting proliferation and angiogenesis, and inducing apoptosis.(Reference Feldman, Krishnan and Swami4–Reference Ferrer-Mayorga, Larriba and Crespo7) Furthermore, vitamin D signalling has been implicated in maintaining intestinal barrier integrity, favourably modulating the gut microbiota composition, and regulating inflammatory pathways associated with colorectal carcinogenesis.(Reference Bouillon, Manousaki and Rosen6–Reference Liu, Zhang and Xu8) Mechanistic studies suggest that vitamin D signalling may suppress NF-κB activation and downregulate the expression of pro-inflammatory cytokines, including TNF, IL-6, and IL-8.(Reference Ferrer-Mayorga, Larriba and Crespo7,Reference Harten-Gerritsen, Balvers and Witkamp9) In addition, vitamin D may influence tumour immune surveillance by modulating innate and adaptive immune responses.(Reference Ferrer-Mayorga, Larriba and Crespo7,Reference Harten-Gerritsen, Balvers and Witkamp9) Notably, both VDR and the enzyme cytochrome P450 family 27 subfamily B member 1 (CYP27B1), which converts 25(OH)D into 1.25(OH)D, are expressed in colon tissue and immune cells, supporting a potential local regulatory role for vitamin D within the colorectal microenvironment.(Reference Bouillon, Manousaki and Rosen6,Reference Liu, Zhang and Xu8) Several studies have investigated the association between low 25-hydroxyvitamin D (25(OH)D) levels and CRC risk, with the majority supporting an association.(Reference Ma, Zhang and Wang10–Reference Touvier, Chan and Lau12) However, evidence for a causal relationship has not been established.(Reference Brustad and Meyer13) Furthermore, intervention studies, such as the Vitamin D and Omega-3 Trial, have failed to demonstrate an effect of vitamin D on CRC prevention.(Reference Manson, Cook and Lee14) However, these findings may have been influenced by the generally sufficient baseline 25(OH)D levels of most participants.(Reference Bouillon, Manousaki and Rosen6,Reference Brustad and Meyer13,Reference Manson, Cook and Lee14) Moreover, the long latency period for CRC development, which is observed to range from 5 to 15 years following the occurrence of colorectal adenomas, underscores the need for extended follow-up durations in such studies.(Reference Umar, Dunn and Greenwald15)
It has been suggested that the observed association between vitamin D and CRC may be mediated through the vitamin D’s influence on inflammation-related biomarkers.(Reference Harten-Gerritsen, Balvers and Witkamp9) Previous studies have examined the relationship between vitamin D and inflammation across various clinical contexts of CRC. One study found no evidence that adjusting for inflammatory markers affected the association between 25(OH)D and CRC.(Reference Song, Wu and Chan16) However, other studies reported inverse associations between 25(OH)D and inflammatory biomarkers in diagnosed CRC patients and in pre-operative CRC cases compared to controls.(Reference Wesselink, Balvers and Bours17,Reference Väyrynen, Mutt and Herzig18) RCTs have investigated the effects of vitamin D3 supplementation on inflammatory markers in patients with a history of sporadic colorectal adenoma, reporting a decrease in blood inflammatory biomarker levels and changes in tissue-level markers of inflammation and proliferation.(Reference Hopkins, Owen and Ahearn19,Reference Kwan, Um and Rutherford20) Although most studies relied on limited number of biomarkers, findings from both observational studies and interventions support a potential anti-inflammatory or modulatory role of vitamin D on CRC development.
We have previously observed, using a similar study sample, that a 5 nmol/L increase in plasma 25(OH)D levels was associated with 6% reduced odds of proximal colon cancer. Sensitivity analysis revealed a 62% increased rectal cancer risk among women with 25(OH)D levels below 50 nmol/L compared to those with sufficient levels (≥50 to <75 nmol/L).(Reference Paulsen, Braaten and Urbarova21) Building on these findings, this study investigated expression of 92 inflammatory biomarkers and their associations with 25(OH)D levels in pre-diagnostic plasma samples from CRC cases and cancer-free controls to provide a more comprehensive insight into association of vitamin D, inflammation, and CRC risk.
Methods
Study design
The Norwegian Women and Health Study (NOWAC) is an ongoing population-based prospective cohort study that was initiated in 1991.(Reference Lund, Dumeaux and Braaten22) Women were eligible to participate if they were born between 1927 and 1965 and had a Norwegian personal identification number, which is assigned to all individuals registered in the Norwegian Population Register.(Reference Lund, Dumeaux and Braaten22) Participants were randomly selected from this register. The use of personal identification numbers enables long-term follow-up through national registries, including those for cancer, death, and emigration.
By December 2018, approximately 172,000 women had completed one to four comprehensive self-reported questionnaires covering a range of topics, including lifestyle factors, diet, anthropometrics, and self-reported diseases.(Reference Lund, Dumeaux and Braaten22) Additionally, between 2003 and 2006, the NOWAC post-genome cohort was established as a subcohort within the NOWAC study, comprising approximately 50,000 women born between 1943 and 1957. Blood samples were collected for biomarker analysis in addition to questionnaire data.(Reference Dumeaux, Børresen-Dale and Frantzen23) A detailed description of the NOWAC study and the NOWAC post-genome cohort have been published elsewhere.(Reference Lund, Dumeaux and Braaten22,Reference Dumeaux, Børresen-Dale and Frantzen23)
All participants provided written informed consent. The NOWAC post-genome cohort study was approved by the Norwegian Data Protection Authority (2002/2241) and the Regional Committees for Medical and Health Research Ethics (REK Nord 2003/01). The study adhered to the guidelines established in the Declaration of Helsinki.
Study sample
Utilising data from the Cancer Registry of Norway, we identified a total of 803 women diagnosed with CRC by the end of 2018 among the 50,000 women who had participated in the NOWAC post-genome cohort. In a previous study, all available CRC cases were matched 1:1 with cancer-free controls based on age, region of living (north, middle, south-east, and west of Norway), and time of blood sampling (within ± 30 days) and investigated for the association between 25(OH)D and the incidence of CRC and its subsites.(Reference Paulsen, Braaten and Urbarova21)
For the present study, we selected 176 of these CRC cases and their corresponding controls based on the criterion that the blood samples were drawn within 1 to 6 years prior to diagnosis. However, four samples were incorrectly retrieved from the freezer and sent to the laboratory. Additionally, 13 observations were excluded due to quality control warnings provided by TATAA Biocentre, resulting in 17 incomplete case–control pairs. Only four observations with missing pair could be reassigned to other appropriate case–control pairs in the dataset, resulting in four pairs with three observations each: two pairs with two CRC cases and one cancer-free control, and two pairs with the opposite ratio. 26 case–control pairs had to be removed. Consequently, the final study sample comprised 326 women: 163 CRC cases and 163 cancer-free controls (Figure 1).
Flow chart of the participant inclusion process for the study.

Figure 1. Long description
The flowchart begins with the Norwegian Women and Cancer Post-Genome Cohort Study from 2003 to 2006, involving approximately 50,000 participants. CRC cases are identified through the Cancer Registry of Norway by 2018, totaling 803 cases. These cases are further filtered to include only those with blood drawn 1 to 6 years before diagnosis. Additionally, 176 cancer-free controls are selected based on matching criteria. This results in a total of 352 blood samples sent for analysis. Samples are excluded due to quality control warnings, no existing matching, and incorrect retrieval from the freezer, totaling 30 exclusions. Four samples are matched to existing pairs, consisting of 2 CRC cases and 2 cancer-free controls. The final study sample includes 326 participants: 163 CRC cases and 163 cancer-free controls. The end of follow-up for the current study is December 31, 2018.
Biomarker measurements
Blood samples were drawn at local health centres and sent via prepaid overnight mail to UiT the Arctic University of Norway.(Reference Dumeaux, Børresen-Dale and Frantzen23) Upon arrival, the samples were processed using a centrifuge to separate their components. The plasma was then preserved in 2 ml cryotubes and stored at-80°C to ensure long-term stability.(Reference Dumeaux, Børresen-Dale and Frantzen23) The plasma samples (n = 352) were delivered on dry ice to the Department of Laboratory Medicine at the University Hospital of North Norway. There, they were thawed for on-site 25(OH)D analysis. The remaining portions (n = 352) were refrozen and transported on dry ice to TATAA Biocentre in Goteborg, Sweden, for further analysis of inflammatory biomarkers.
Analysis of plasma 25-hydroxyvitamin D
The analysis of plasma 25-hydroxyvitamin D2 (25(OH)D2) and 25-hydroxyvitamin D3 (25(OH)D3) has been detailed in a previously published study.(Reference Paulsen, Braaten and Urbarova21) In brief, 80 µl of plasma was analysed using liquid chromatography-tandem mass spectrometry (LC-MS/MS). All 352 samples were prepared and analysed on the same day using four 96-well plates in a single LC-MS/MS analytical batch, with adjustments for plate-specific variability as previously described.
Quality assurance was maintained by including two controls (MassCheck® 25-OH-Vitamin D3/D2 and 3-epi-25-OH-Vitamin D3 Serum Controls, Chromsystems) and six serially diluted standards at both the beginning and end of each plate. The correlation coefficient (R 2) for the standard curve was required to exceed 0.99 for results to be reported. The laboratory conducting the vitamin D analyses is certified according to the International Organization for Standardization 15189 standard and participates in the Vitamin D External Quality Assessment Scheme’s ring test programme four times annually. Further details of the laboratory’s analysis method have been published elsewhere.(Reference Sollid, Hutchinson and Fuskevåg24)
In the analysis, 25(OH)D2 and 25(OH)D3 were combined and are hereafter referred to as 25(OH)D.
Assessment of inflammatory biomarkers
A volume of 1 µL plasma was analysed for 92 biomarkers in each of the 352 samples using the Olink Target 96 Inflammation Panel.(Reference Proteomics25) This panel is based on the Proximity Extension Assay, a method that enables protein quantification through real-time PCR.(Reference Assarsson, Lundberg and Holmquist26) The results are reported as Normalized Protein eXpression values, which provide relative protein quantification and are log2-transformed to facilitate comparisons across samples.(Reference Assarsson, Lundberg and Holmquist26)
A total of four plates was used to analyse the 352 samples. To correct for technical variations across plates, the laboratory applied intensity normalisation. This method adjusts the data so that the median NPX for each protein on every plate is equal to the overall median across all plates. The average intra-assay CV was 3%, and the inter-assay CV was 8%. Of the 92 proteins, 65 had intra-assay CVs <5%, and 57 had inter-assay CVs <10%.In total, 17 proteins were excluded due to having more than 25% missing data, with 16 of these proteins showing over 70% missing data (Table S1). For IL-15RA, which had a 49% missing data frequency, we verified that the missingness was not related to case or control status. The missing data were evenly distributed (78 missing among cases and 86 among cancer-free controls), and the protein was excluded due to the high frequency of missing values.
In total, 75 of the 92 proteins were included in the analysis. For the included biomarkers, observations with biomarker values below the limit of detection (LOD) were replaced with half of the LOD. A list of the 92 biomarkers, along with their LODs and missing data frequencies, is provided in (Table S1), while their abbreviated and full protein names are displayed in (Table S2).
Covariates
Covariates were selected by reviewing existing literature and considering the availability of variables in the NOWAC database. Age, region of living, and time of blood sampling (within ±30 days) were accounted for through matching. Additional covariates included BMI, and smoking history. BMI was calculated using the formula: weight in kilograms divided by height in metres squared (kg/m2), self-reported height and weight has previously been validated.(Reference Skeie, Mode and Henningsen27) In the analysis, BMI was categorised as follows: underweight (<18.5), normal weight (≥18.5 to <25), overweight (≥25 to <30), and obese (≥30). Smoking status was categorised into current smoker, former smoker, and never smoker.
Physical activity (PA) and education were additionally included as covariates in a sensitivity analysis. PA was self-reported on a 10-point scale, ranging from 1 (very low activity) to 10 (very high activity). For the analysis, PA was categorised into three levels: low,(1–Reference Feldman, Krishnan and Swami4) moderate,(Reference Na, Kim and Lim5,Reference Bouillon, Manousaki and Rosen6) and high.(Reference Ferrer-Mayorga, Larriba and Crespo7–Reference Ma, Zhang and Wang10) This measure of PA has been validated previously.(Reference Borch, Ekelund and Brage28) Education was categorised as low (<10 years), medium (10–12 years), and high (>12 years).
Outcome
CRC cases were identified through the Cancer Registry of Norway using ICD-10 (C18–C18.9) and ICD-O-3 (C199, C209) codes. CRC includes all cancers of the colon and rectum.
Statistical methods
All statistical analyses were conducted using Stata/MP 18. The baseline descriptives are presented as numbers and percentages or as mean values with standard deviations. To test for differences in continuous variables across the 25(OH)D categories, we applied an ANOVA test. When the assumption of equal variance was not met, as assessed by Bartlett’s test, welch ANOVA was used. For categorical variables, we employed a chi-square test. P-values below 0.05 were considered statistically significant.
We explored the association between 25(OH)D and inflammatory biomarkers in two steps. First, we performed factor analysis to identify underlying patterns among the inflammatory markers. The suitability of the biomarkers for factor analysis was confirmed using the Kaiser–Meyer–Olkin (KMO) measure and Bartlett’s test of sphericity. A KMO value of 0.9 indicated that the variables shared sufficient common variance to justify factor analysis. Bartlett’s test yielded a P-value of <0.001, confirming that the correlation matrix significantly differed from an identity matrix, thereby supporting the use of factor analysis.
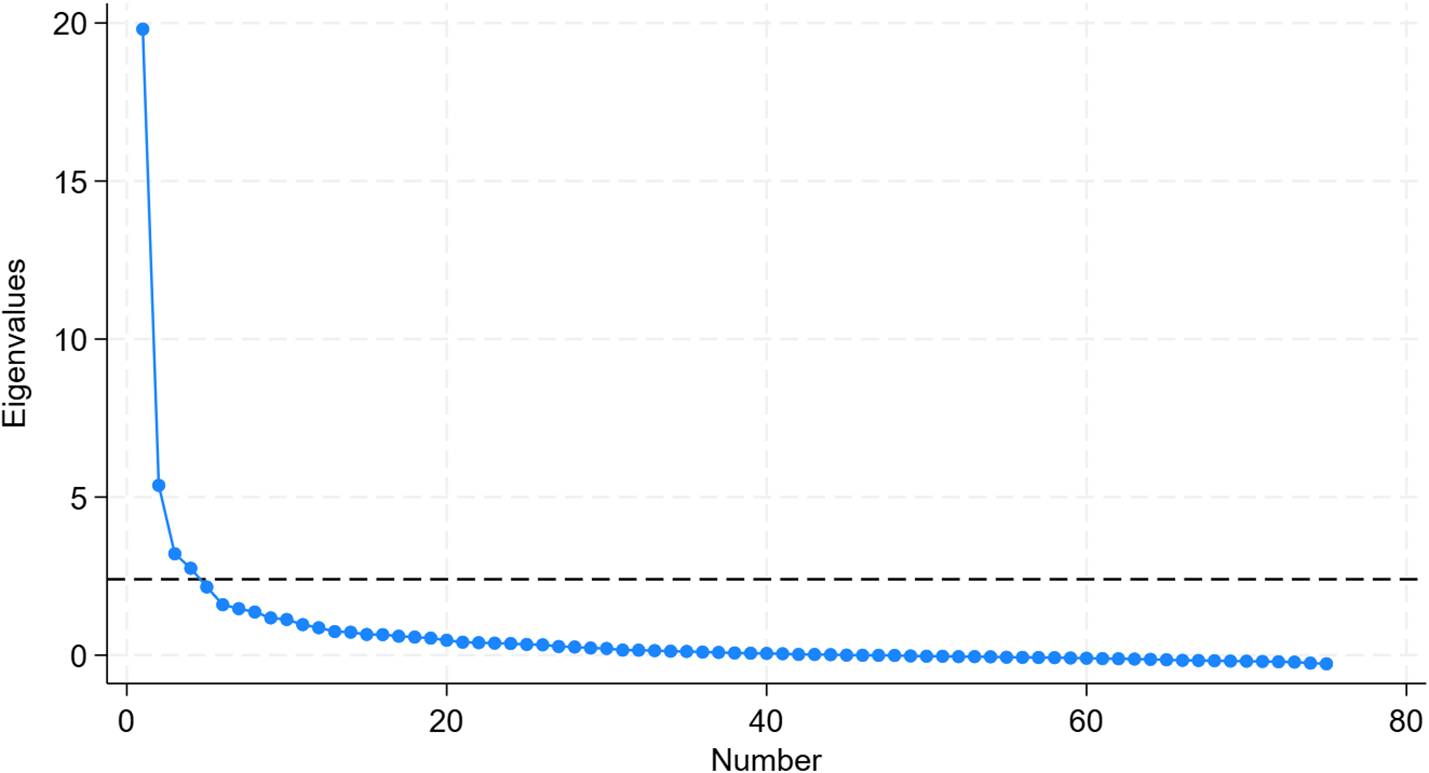
To determine how many factors to include in the factor analysis, a scree plot was created. The number of factors retained was based on those above the ‘elbow’ point, but also taking the cumulative variance explained into account. Factor analysis was then performed, and varimax rotation was applied to make the factors orthogonal, thereby minimising correlations between them. A threshold of the absolute value (±0.4) was established for factor loadings, with biomarkers above this value considered to be sufficiently strongly associated with each factor. Factor scores for each of the identified factors were generated using the predict command in Stata. This command calculates scores for each observation based on the factor loadings from the factor analysis, providing a numerical representation of how strongly each observation is associated with the identified factors.
In the next step, we investigated whether there was an association between 25(OH)D and the identified factors. Separate linear regression analyses were conducted for each of the four factors as dependent variables, examining their association with 25(OH)D using two approaches: continuous and categorised variables. The continuous 25(OH)D variable was modelled based on a 5 nmol/L increase. The categorised 25(OH)D variable was divided into three groups: deficiency (≤30 nmol/L), insufficiency (>30 to <50 nmol/L), and sufficiency (≥50 nmol/L), with sufficiency serving as the reference category, based on the Nordic Nutrition Recommendations.(Reference Brustad and Meyer13) Two models were used: a univariable model, and a multivariable model where we adjusted for age, BMI, and smoking. Additionally, we conducted a subgroup analysis, restricting the analysis to either CRC cases or cancer-free controls. In a sensitivity analysis we added PA and education. To account for multiple testing, we applied the Benjamini–Hochberg procedure to control the false discovery rate (FDR).(Reference Benjamini and Hochberg29) Statistical significance was defined as an FDR-adjusted P-value < 0.05.
Results
Baseline descriptives
Baseline descriptive statistics for the study sample are presented in Table 1. The mean time from blood sampling to CRC diagnosis was 3.7 years (range: 1.1 to 6.0 years). No significant differences in time to CRC were observed across the 25(OH)D categories.
A higher proportion of women had a normal weight (BMI: >18.5 to <25) and were never smokers in the sufficient compared to those in the deficient 25(OH)D category. Additionally, a greater proportion of women were obese (BMI: ≥30), current smokers, and reported low PA in the deficient 25(OH)D category compared to the sufficient category.
Baseline descriptives of the study sample (n 326) by 25-hydroxyvitamin D plasma levels in the Norwegian Women and Health post-genome cohort (2003–2006) (Numbers and percentages; mean values and standard deviations)

Table 1. Long description
A table comparing baseline descriptives of a study sample by 25-hydroxyvitamin D plasma levels. The table has 12 rows and 6 columns. Column headers are Total, <= 30, >30 to <50, >=50, and p. Row labels include Number of participants, Number of colorectal cancer cases, Number of cancer-free controls, Time to colorectal cancer, Age in years, 25(OH)D levels in nmol/L, BMI, Region of living, Level of physical activity, Educational years, and Smoking. Each row provides specific data points for each category. Notable trends include variations in the number of participants, cancer cases, and controls across different 25-hydroxyvitamin D levels, with significant differences in 25(OH)D levels and BMI categories.
25(OH)D: 25-hydroxyvitamin D.
* 25-hydroxyvitamin D is derived from the combination of D2 and D3, measured in plasma.
Ϯ 15 missing values.
‡ 23 missing vaues.
§ 11 missing values.
| 3 missing values.
Factor analysis results and protein associations
The scree plot revealed four factors above the ‘elbow’ point (Figure 2), each with eigenvalues greater than 2. Although a fifth factor was considered, it contributed only an additional 4% to the cumulative variance explained and was therefore not included. The four retained factors together accounted for 65% of the total variance, with factor 1 contributing 23%, factor 2 contributing 16%, factor 3 contributing 14%, and factor 4 contributing 12%. After applying a threshold of the absolute value (±0.4) to the factor loadings, factor 1 retained the highest number of associated proteins compared to the other factors: 20 proteins were retained in factor 1, 17 in factor 2, 13 in factor 3, and 13 in factor 4. Notably, no proteins had values below −0.4. The results of the factor analysis, including Factors 1 to 4, their corresponding biomarkers, and factor loadings, are presented in Table 2, while the variance explained by each factor is presented in Table S3.
Scree plot of eigenvalues after factor analysis. The figure shows the scree plot obtained from the factor analysis conducted on 75 biomarkers. The dashed line indicates the identified ‘elbow’ point, above which four factors were retained for further analysis.

Factors 1 to 4, their corresponding biomarkers and factor loadings. The table presents factors 1 to 4 along with their corresponding biomarkers, displaying factor loadings with an absolute value of ±0.4. All biomarkers had positive factor loadings

Table 2. Long description
The table presents four factors with their corresponding biomarkers and factor loadings. It has four columns labeled Factor 1, Factor 2, Factor 3, and Factor 4, each containing biomarkers and their respective factor loadings. Each factor column lists biomarkers and their factor loadings. Row 1: Factor 1, Biomarkers: OSM, Factor loading: 0.93; Factor 2, Biomarkers: CXCL9, Factor loading: 0.77; Factor 3, Biomarkers: TNFSF12, Factor loading: 0.78; Factor 4, Biomarkers: CXCL6, Factor loading: 0.71. Row 2: Factor 1, Biomarkers: TNFSF14, Factor loading: 0.91; Factor 2, Biomarkers: CXCL10, Factor loading: 0.76; Factor 3, Biomarkers: uPA, Factor loading: 0.70; Factor 4, Biomarkers: CXCL1, Factor loading: 0.71. Row 3: Factor 1, Biomarkers: TGF-alpha, Factor loading: 0.87; Factor 2, Biomarkers: CDCP1, Factor loading: 0.64; Factor 3, Biomarkers: LIF-R, Factor loading: 0.67; Factor 4, Biomarkers: CXCL5, Factor loading: 0.69. Row 4: Factor 1, Biomarkers: S100-A12, Factor loading: 0.87; Factor 2, Biomarkers: CXCL11, Factor loading: 0.64; Factor 3, Biomarkers: DNER, Factor loading: 0.66; Factor 4, Biomarkers: ST1A3, Factor loading: 0.64. Row 5: Factor 1, Biomarkers: HGF, Factor loading: 0.84; Factor 2, Biomarkers: IFN-gamma, Factor loading: 0.61; Factor 3, Biomarkers: TNFRSF11B, Factor loading: 0.60; Factor 4, Biomarkers: AXIN1, Factor loading: 0.63. Row 6: Factor 1, Biomarkers: IL-8, Factor loading: 0.79; Factor 2, Biomarkers: IL-10, Factor loading: 0.54; Factor 3, Biomarkers: KITLG, Factor loading: 0.54; Factor 4, Biomarkers: STAMBP, Factor loading: 0.50. Row 7: Factor 1, Biomarkers: CASP-8, Factor loading: 0.77; Factor 2, Biomarkers: TNFRSF9, Factor loading: 0.53; Factor 3, Biomarkers: CX3CL1, Factor loading: 0.52; Factor 4, Biomarkers: SIRT2, Factor loading: 0.48. Row 8: Factor 1, Biomarkers: IL-18, Factor loading: 0.72; Factor 2, Biomarkers: CSF-1, Factor loading: 0.53; Factor 3, Biomarkers: CD244, Factor loading: 0.51; Factor 4, Biomarkers: MCP-4, Factor loading: 0.47. Row 9: Factor 1, Biomarkers: VEGF-A, Factor loading: 0.70; Factor 2, Biomarkers: CCL7, Factor loading: 0.52; Factor 3, Biomarkers: TNFSF10, Factor loading: 0.49; Factor 4, Biomarkers: TGF-beta-1, Factor loading: 0.47. Row 10: Factor 1, Biomarkers: CD5, Factor loading: 0.61; Factor 2, Biomarkers: IL-12B, Factor loading: 0.50; Factor 3, Biomarkers: IL-10RB, Factor loading: 0.48; Factor 4, Biomarkers: CD40, Factor loading: 0.43. Row 11: Factor 1, Biomarkers: CD6, Factor loading: 0.60; Factor 2, Biomarkers: IL-6, Factor loading: 0.47; Factor 3, Biomarkers: TNFRSF9, Factor loading: 0.47; Factor 4, Biomarkers: CXCL11, Factor loading: 0.43. Row 12: Factor 1, Biomarkers: ADA, Factor loading: 0.57; Factor 2, Biomarkers: CCL19, Factor loading: 0.47; Factor 3, Biomarkers: TNF-beta, Factor loading: 0.43; Factor 4, Biomarkers: CCL13, Factor loading: 0.41. Row 13: Factor 1, Biomarkers: SIRT2, Factor loading: 0.54; Factor 2, Biomarkers: CCL3, Factor loading: 0.46; Factor 3, Biomarkers: TGF-beta-1, Factor loading: 0.42; Factor 4, Biomarkers: CASP-8, Factor loading: 0.41. Row 14: Factor 1, Biomarkers: STAMBP, Factor loading: 0.53; Factor 2, Biomarkers: IL-18R1, Factor loading: 0.44; Factor 3, Biomarkers: TNF, Factor loading: 0.42; Factor 4, Biomarkers: CCL3, Factor loading: 0.41. Row 15: Factor 1, Biomarkers: CCL3, Factor loading: 0.52; Factor 2, Biomarkers: CCL8, Factor loading: 0.42; Factor 3, Biomarkers: SLAMF1, Factor loading: 0.42; Factor 4, Biomarkers: CCL4, Factor loading: 0.46. Row 16: Factor 1, Biomarkers: CSF-1, Factor loading: 0.49; Factor 2, Biomarkers: TNF, Factor loading: 0.42; Factor 3, Biomarkers: 4E-BP1, Factor loading: 0.46; Factor 4, Biomarkers: TGF-beta-1, Factor loading: 0.46. Row 17: Factor 1, Biomarkers: CCL4, Factor loading: 0.46; Factor 2, Biomarkers: SLAMF1, Factor loading: 0.42; Factor 3, Biomarkers: CD40, Factor loading: 0.45; Factor 4, Biomarkers: CD40, Factor loading: 0.43.
Association between 25(OH)D levels and factors 1 to 4
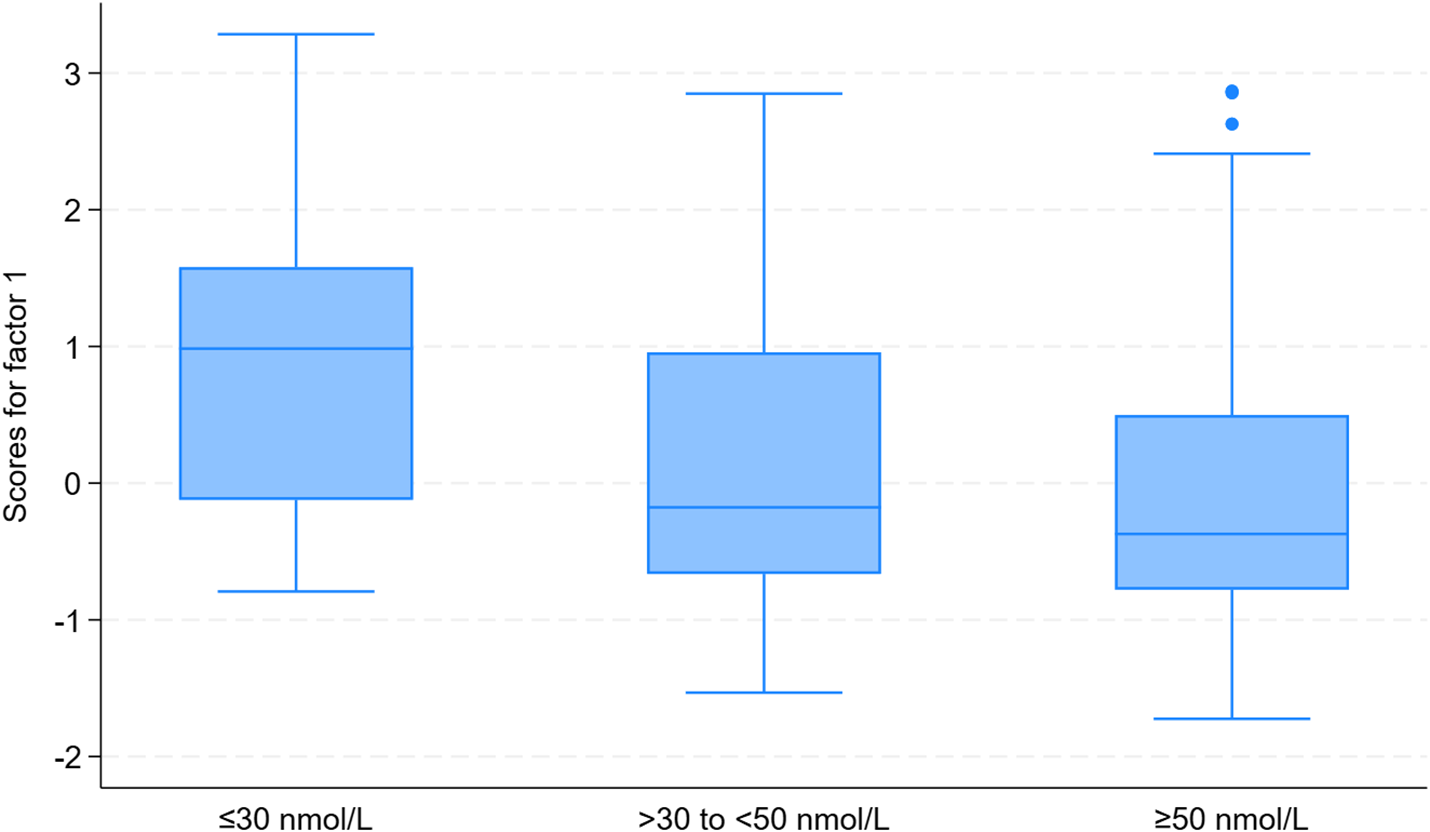
For factor 1, the univariable analysis revealed a decrease in factor scores per 5 nmol/L increase in 25(OH)D (β = −0.04, 95% CI: −0.07 to −0.01; Table 3). However, the finding was not significant in the multivariable analysis. Interestingly, women with 25(OH)D deficiency (≤30 nmol/L) had significantly higher factor 1 scores compared to those with sufficient levels (≥50 nmol/L) (multivariable analysis: β = 0.72, 95% CI: 0.26 to 1.18; Table 3). The subgroup analysis revealed that this association was specific to pre-diagnostic CRC cases (multivariable analysis: β = 0.97, 95% CI: 0.33 to 1.60; Figure S1) and was not observed in cancer-free controls (multivariable analysis: β = 0.22, 95% CI:-0.50 to 0.93; Figure S2). Figure 3 illustrates the distribution of factor 1 scores across 25(OH)D categories.
Factor 1 scores across categories of 25-hydroxyvitamin D. The figure shows factor 1 and 25(OH)D levels categorised into three groups: deficient (≤30 nmol/L, n = 19), insufficient (>30 to <50 nmol/L, n = 102), and sufficient (≥50 nmol/L, n = 205), within the combined sample of pre-diagnostic CRC cases and cancer-free controls (n = 326).

Regression analysis results in a sample of colorectal cancer cases (n = 163) and cancer-free controls (n = 163). Data are from a nested case–control study (n = 326) within the Norwegian Women and Health Post-Genome Cohort (2003–2006), presented as regression coefficients (β) and 95% CI

Table 3. Long description
A table comparing regression analysis results for colorectal cancer cases and controls. The table has 12 rows and 12 columns. Column headers are: Crude Model n, Crude Model β, Crude Model 95% CI, Crude Model p, Crude Model pτ, Model 1 n, Model 1 β, Model 1 95% CI, Model 1 p, Model 1 pτ. Row labels are: Factor 1 Continuous (5 nmol/L increase), Factor 1 Grouped ≤ 30 nmol/L, Factor 1 Grouped >30 to <50 nmol/L, Factor 1 Grouped Reference value ≥50 nmol/L, Factor 2 Continuous (5 nmol/L increase), Factor 2 Grouped ≤ 30 nmol/L, Factor 2 Grouped >30 to <50 nmol/L, Factor 2 Grouped Reference value ≥50 nmol/L, Factor 3 Continuous (5 nmol/L increase), Factor 3 Grouped ≤ 30 nmol/L, Factor 3 Grouped >30 to <50 nmol/L, Factor 3 Grouped Reference value ≥50 nmol/L, Factor 4 Continuous (5 nmol/L increase), Factor 4 Grouped ≤ 30 nmol/L, Factor 4 Grouped >30 to <50 nmol/L, Factor 4 Grouped Reference value ≥50 nmol/L. The table presents regression coefficients (β) and 95% confidence intervals (CI) for different factors and groups.
* Adjusted for age, region of living and time of blood sampling (± 30 days) through matching, with additional adjustments for body mass index (weight/height in meters2), and smoking status (never smoker, former smoker or current smoker).
Ϯ P-values adjusted for the false discovery rate (FDR) using the Benjamini–Hochberg procedure.
For factor 2, the univariable analysis revealed a decrease in factor scores per 5 nmol/L increase in 25(OH)D (β = −0.04, 95% CI: −0.07 to −0.01; Table 3). Additionally, women with 25(OH)D deficiency had significantly higher factor 2 scores compared to those with sufficient levels 25(OH)D levels (≥50 nmol/L) in the categorical analysis (univariable analysis: β = 0.64, 95% CI: 0.18 to 1.09; Table 3). However, these associations did not remain significant in the multivariable analysis. No significant associations were found between 25(OH)D levels (used as a continuous or categorical variable) and factors 3 or 4. In the sensitivity analysis, additional adjustment for PA and education in the multivariable model did not alter the results for factors 1–4 (Table S5).In summary, deficient 25(OH)D levels were significantly associated with higher factor 1 scores compared to sufficient 25(OH)D levels, particularly in pre-diagnostic CRC cases. No significant associations were observed for factors 2, 3, or 4 after adjustment.
Discussion
Vitamin D may help reduce the risk of CRC by exerting an anti-inflammatory or modulatory effect on biomarkers associated with the disease. In this study, women with deficient 25(OH)D levels (<30 nmol/L) had significantly higher factor 1 scores compared to those with sufficient levels (≥50 nmol/L). Subgroup analyses revealed that this association was specific to pre-diagnostic CRC cases and was not observed in cancer-free controls, even though all samples were collected at least one year prior to the diagnosis.
To our knowledge, this is the first study to explore the association between 25(OH)D and inflammatory biomarkers using factor analysis to identify patterns. Previous studies have largely focused on individual biomarkers. For instance, in a nested case–control study within the Nurses’ Health Study and the Health Professionals Follow-up Study (615 cases and 1209 matched controls), Song et al. (Reference Song, Wu and Chan16) found that the inverse association between 25(OH)D and CRC risk was not confounded by inflammatory markers such as C-reactive protein (CRP), IL-6, soluble tumour necrosis factor receptor 2 (sTNFR-2), or a composite inflammatory score in blood samples taken prior to the diagnosis. Controversially, in CRC patients from the COLON and EnCoRe study (n = 708), Wesselink et al. (Reference Wesselink, Balvers and Bours17) found that higher circulating 25(OH)D levels were associated with lower levels of IL-6, and a reduced summative inflammatory z-score, including IL-10, IL-8, IL-6, TNF alpha (referred to as TNFα in the original study), and high-sensitivity CRP during the two years following diagnosis. Väyrynen et al. (Reference Väyrynen, Mutt and Herzig18) also reported inverse correlations between 25(OH)D and systemic markers, including neutrophil count, neutrophil-to-lymphocyte ratio, CRP, and IL-6, based on pre-operative serum samples from 117 CRC patients and 86 matched controls in Finland. Additionally, an RCT conducted at Emory University (Calcium and Vitamin D vs. Markers of Adenomatous Polyps study) involving 92 participants with a history of sporadic colorectal adenomas showed that daily vitamin D3 supplementation over six months reduced levels of several plasma inflammatory markers, such as CRP, IL-6, TNF (referred to as TNFα in the original study), IL-1 beta, and IL-8, although most changes were not statistically significant.(Reference Hopkins, Owen and Ahearn19)
Taken together, previous observational studies, including cohort and nested case–control studies, as well as intervention studies have identified inverse associations between 25(OH)D and the inflammatory biomarkers IL-6, TNF, IL-1 beta, IL-8 and IL-10. Among these, in our analysis, IL-8 contributed strongly to factor 1, with a factor loading of 0.8. Notably, IL-8 has also been associated with 25(OH)D in a review of mechanistic studies exploring the links between vitamin D, inflammation, and CRC progression, further supporting its contribution.(Reference Harten-Gerritsen, Balvers and Witkamp9) That said, other biomarkers with loadings below the ±0.4 threshold may have also influenced factor 1 but were excluded from consideration due to the applied cut-off criteria.
The discrepancy between our findings and previous studies may stem from differences in analytical methods, and biomarker quantification techniques. Furthermore, unlike prior studies, which often measured biomarkers in diagnosed CRC cases or patients with a history of colorectal adenomas, we assessed them at least one year before diagnosis. Most prior studies have focused on a limited number of individual biomarkers, not accounting for combined effects among them. This methodological distinction highlights the novelty of our approach. Evidence indicates that measuring single biomarkers is insufficient, and that combinations of biomarkers offer greater potential for understanding complex inflammatory pathways,(Reference Harten-Gerritsen, Balvers and Witkamp9,Reference Bresalier, Grady and Markowitz30) a key strength of our study.
Results from previous RCTs indicate that vitamin D supplementation has no effect on cancer incidence in individuals who are vitamin D sufficient.(Reference Bouillon, Manousaki and Rosen6) However, there is a lack of RCTs involving patients with vitamin D deficiency, primarily due to methodological and ethical considerations.(Reference Brustad and Meyer13) That said, there is some evidence of effects on non-skeletal health outcomes in individuals with vitamin D deficiency.(Reference Brustad and Meyer13) This observation is highly relevant to our study, as our regression analysis showed that 25(OH)D deficiency (≤30 nmol/L) was significantly associated with a higher factor 1 score, compared to 25(OH)D sufficiency (≥50 nmol/L). We suspected that the observed association could be attributable to the fact that those with deficiency could be closer to diagnosis compared to the other 25(OH)D categories. However, the time to CRC diagnosis across the 25(OH)D categories was not significantly different. Therefore, this explanation was ruled out.
There are several pro-inflammatory biomarkers in factor 1 with factor loadings above ± 0.4, such as oncostatin M (OSM), tumour necrosis factor superfamily member 14 (TNFSF14), S100 calcium-binding protein A12 (S100-A12), IL-8, and IL-18. These biomarkers promote inflammation, for example, by inducing the production of other pro-inflammatory cytokines or mediators of inflammation.(Reference Wolf, Pruett and Lighter31–Reference Ihim, Abubakar and Zian35) Additionally, IL-8, C–C motif chemokine 3 (CCL3), and C–C motif chemokine 4 (CCL4) act as chemoattractants, attracting immune cells to infection sites.(Reference Cambier, Gouwy and Proost34,Reference Xu, Xing and Tang36) Notably, five of these biomarkers: OSM, TNFSF14, S100-A12, IL-8, and IL-18 contributed highly to factor 1, with factor loadings above 0.7.
Beyond their roles in inflammation, several biomarkers in factor 1 are also involved in critical cellular processes, including angiogenesis, cell proliferation, differentiation, and apoptosis.(Reference Proteomics25) For example, OSM, protransforming growth factor alpha (TGF-alpha), hepatocyte growth factor (HGF), vascular endothelial growth factor A (VEGF-A), macrophage colony-stimulating factor 1 (CSF-1), and transforming growth factor beta-1 proprotein (TGF-beta-1) contribute to processes like angiogenesis and cell growth.(Reference Cambier, Gouwy and Proost34,Reference Nakamura and Mizuno37–Reference Deng, Fan and Xiao41) Caspase-8 (CASP-8) regulates apoptosis, balancing cell death and survival.(Reference Oberst and Green42)
Several biomarkers within factor 1 have previously been associated with CRC. For example, OSM, TGF-alpha, HGF, VEGF-A, S100-A12, IL-8, CCL3, CCL4, and eukaryotic translation initiation factor 4E-binding protein (4E-BP1) have been linked to increased tumour growth, invasion, metastasis, or poor prognosis.(Reference Gurluler, Tumay and Guner43–Reference Bazzichetto, Milella and Zampiva55) In contrast, lower expression or reduced activity of NAD-dependent protein deacetylase sirtuin-2 (SIRT2) has been associated with more aggressive CRC disease and worse outcomes, suggesting tumour-suppressive functions.(Reference Du, Li and Zhang56) Similarly, TNFSF14 and IL-18 have been linked to improved survival and enhanced anti-tumour immunity.(Reference Qiao, Qin and Kunda57–Reference Feng, Zhang and Sun60)
In summary, factor 1 consists of biomarkers involved in inflammation and critical cellular processes like cell growth. Dysregulation of both inflammation and cell growth is well known to increase cancer risk. Furthermore, many of these biomarkers have been independently linked to CRC, with both favourable and unfavourable roles. The significant association between 25(OH)D deficiency and factor 1 raises important questions about whether addressing 25(OH)D deficiency could aid in preventing CRC development. This hypothesis warrants further investigation and verification.
Our study has several limitations. The systemic biomarkers analysed in this study may differ from local inflammatory processes in the colon and rectum or represent other underlying mechanisms. However, the association between 25(OH)D deficiency and factor 1 is observed only in pre-diagnostic CRC cases, supporting that these biomarkers might reflect an inflammatory environment favouring CRC development. The inflammatory biomarkers and 25(OH)D levels were measured in the same blood sample, making it impossible to determine which preceded the other. We lacked information on IBD and family history of CRC, as these variables were not available in this cohort. Both are established risk factors for CRC and may be relevant in relation to disease risk. Additionally, blood samples were collected only once, and relying on a single 25(OH)D measurement is a limitation, although evidence suggests it reliably reflects long-term vitamin D status.(Reference Hofmann, Yu and Horst61,Reference Jorde, Sneve and Hutchinson62) Furthermore, prolonged storage of blood samples may have led to degradation of inflammatory biomarkers.(Reference Harten-Gerritsen, Balvers and Witkamp9) The sample size was relatively small, particularly regarding the 25(OH)D deficiency category. Nevertheless, the entire sample collectively shows a clear decrease in scores for Factor 1 with increasing 25(OH)D levels. While the random selection of participants from the national registry in the NOWAC study, with a 57% response rate,(Reference Deng, Fan and Xiao41) is a strength, respondents were more likely to have higher education levels, be younger, and differ demographically.(Reference Moravkova, Kohoutova and Rejchrt47) Additionally, our analytical sample was not randomly selected but consisted of cases and matched controls. To assess whether our analytical sample was representative of the NOWAC post-genome cohort (n = 47,764), we compared the distribution of baseline covariates in the analytical sample with those in the full cohort (Supplementary Table S4). No substantial differences were observed, although minor deviations were expected due to the nested case–control design. Despite these limitations, we find no strong arguments to suggest that the observed associations between 25(OH)D and the inflammatory biomarkers within Factor 1 would differ from the general population.
Our study also has several strengths. Biomarkers were measured at least one year prior to CRC diagnosis, a critical advantage given that CRC can develop over up to 15 years after the occurrence of colorectal adenomas. Additionally, pre-diagnostic blood samples are not influenced by surgery, cancer treatment, or behavioural changes following a cancer diagnosis. The sensitivity analysis including additional adjustment for PA and education, which may be associated with both vitamin D status and systemic inflammation,(Reference Kasapis and Thompson63–Reference Thacher, Dudenkov and Mara66) did not substantially change the results, supporting the robustness of our findings. The 25(OH)D biomarker reflects both skin production and dietary intake, making it the most reliable indicator of vitamin D status due to its half-life of two to three weeks. Additionally, the analysis was conducted using LC-MS/MS, the gold standard for measuring 25(OH)D levels.(Reference Brustad and Meyer13) The use of Olink Target 96 Inflammation Panel enabled us to explore the association between 25(OH)D and a comprehensive amount of 75 inflammatory biomarkers, while factor analysis allowed us to account for their combined effects. Even though the Olink Target 96 panel generate only relative protein quantification, case–control design allowed us to investigate differences in associations between 25(OH)D levels and expression of inflammatory biomarkers between pre-diagnostic plasma samples of CRC cases and cancer-free controls.
Future studies should aim to replicate our findings. Additionally, we recommend employing methods that allow for absolute quantification of the observed biomarkers. This would enable direct comparison across studies and populations. Furthermore, future studies should particularly focus on individuals with 25(OH)D deficiency.
Conclusion
Factor 1 represents a cluster of biomarkers involved in inflammation, many of which are pro-inflammatory and play key roles in cellular processes such as cell growth, angiogenesis, and apoptosis. Several of these biomarkers have been independently associated with CRC, exhibiting both unfavourable and favourable roles. The observed association between 25(OH)D deficiency and factor 1 in pre-diagnostic CRC cases supports the hypothesis that sufficient levels of vitamin D could potentially contribute to prevention of CRC development.
Supplementary material
The supplementary material for this article can be found at https://doi.org/10.1017/jns.2026.10152.
Data availability statement
Data from the NOWAC Study are available for research purposes through an application to the NOWAC access committee. Due to legal, privacy, and ethical restrictions, the data cannot be made publicly available in open repositories. Detailed descriptions of variables and their metadata, including descriptions of data collection methods, variable definitions, are accessible at https://helsedata.no.
Acknowledgements
The authors sincerely thank all the women who participated in the NOWAC study and the NOWAC post-genome cohort. We are also grateful to the Department of Laboratory Medicine at the University Hospital of North Norway and Tataa Biocenter in Goteborg, Sweden, for analysing 25(OH)D levels and inflammatory biomarkers, respectively. Lastly, we extend our appreciation to everyone who contributed valuable discussions and insights on the topic.
Author contributions
The authors collaboratively developed the research question and study design. E.M.P. performed the analysis, interpreted the results, and drafted the initial manuscript. I.U. and D.C. guided the biomarker analysis, contributed to result interpretation, and critically reviewed the manuscript. T.B. provided statistical expertise, contributed to result interpretation, and revised the manuscript. M.B. offered expertise in vitamin D, contributed to result interpretation, provided critical revisions, and approved the final manuscript for publication.
Financial support
This research received no specific grant from any funding agency, commercial or not-for-profit sectors.
Competing interests
The authors declare none.





 Open access

