Introduction
Horizontal cells are second-order neurons of the vertebrate retina that modulate synaptic transmission at the first synapse of the visual system either by feedback to photoreceptors (Baylor et al., Reference Baylor, Fuortes and O’Bryan1971; Kamermans & Spekreijse, Reference Kamermans and Spekreijse1999; Thoreson et al., Reference Thoreson, Babai and Bartoletti2008) or by feedforward to bipolar cells (Yang & Wu, Reference Yang and Wu1991). A distinctive feature of horizontals cells is a receptive field size that exceeds greatly the dendritic field size, a consequence of gap junction coupling (Naka & Rushton, Reference Naka and Rushton1967; Kaneko, Reference Kaneko1971). Functionally, this allows for the summation of photoreceptor input to the horizontal cell network that contributes to the receptive field surround of bipolar cells and retinal ganglion cells (Naka & Nye, Reference Naka and Nye1971; Naka & Witkovsky, Reference Naka and Witkovsky1972).
The receptive field size of horizontal cells is not static but is modulated by the level of ambient illumination. It has consistently been shown that periods of illumination decrease horizontal cell receptive field size (Shigematsu & Yamada, Reference Shigematsu and Yamada1988; Baldridge & Ball, Reference Baldridge and Ball1991; Dong & McReynolds, Reference Dong and McReynolds1991; Umino et al., Reference Umino, Lee and Dowling1991; Djamgoz et al., Reference Djamgoz, Petruv, Yasui, Furukawa and Yamada1998; Weiler et al., Reference Weiler, Schultz, Pottek, Tieding and Janssen-Bienhold1998; Xin & Bloomfield, Reference Xin and Bloomfield1999; Pottek & Weiler, Reference Pottek and Weiler2000) and the movement of dye or tracer through gap junctions (Baldridge & Ball, Reference Baldridge and Ball1991; Xin & Bloomfield, Reference Xin and Bloomfield1999; Pottek & Weiler, Reference Pottek and Weiler2000; Weiler et al., Reference Weiler, Pottek, He and Vaney2000; Ribelayga & Mangel, Reference Ribelayga and Mangel2003, Reference Ribelayga and Mangel2007). Similar results have been found in fish, amphibians, and mammals, suggesting that modulation of horizontal cell receptive field size by light is a general feature of the vertebrate retina.
The dynamic nature of horizontal cell receptive field size and gap junction coupling has also been established through exogenous application of three different neuromodulators. Dopamine (Negishi & Drujan, Reference Negishi and Drujan1978, Reference Negishi and Drujan1979; Teranishi et al., Reference Teranishi, Negishi and Kato1983), retinoic acid (Weiler et al., Reference Weiler, Schultz, Pottek, Tieding and Janssen-Bienhold1998, Reference Weiler, He and Vaney1999), and nitric oxide (DeVries & Schwartz, Reference DeVries and Schwartz1989; Lu & McMahon, Reference Lu and McMahon1997; Pottek et al., Reference Pottek, Schultz and Weiler1997; Xin & Bloomfield, Reference Xin and Bloomfield2000; Furukawa et al., Reference Furukawa, Petruv, Yasui, Yamada and Djamgoz2002) have each been shown to decrease the receptive field size and gap junction coupling of horizontal cells.
In this study, we have examined the potential role of nitric oxide in decreasing the receptive field size of horizontal cells following background illumination in the goldfish retina. Consistent with previous studies of nitric oxide in the vertebrate retina, we first show that the effect of illumination on horizontal cell receptive field size is mimicked by the nitric oxide donor, (Z)-1-[N-(2-aminoethyl)-N-(2-ammonioethyl)amino]diazen-1-ium-1,2-diolate (DETA NONOate). We then provide direct evidence that the effect of illumination on horizontal cell receptive field size is mediated by nitric oxide by demonstrating that the effect of illumination is blocked by the nitric oxide synthase inhibitor, NG-nitro-l-arginine methyl ester (L-NAME). These results indicate that nitric oxide is involved in the light-dependent reduction of horizontal cell receptive field size.
Materials and methods
Isolated goldfish retina preparation
Ethical approval for use of animals was obtained from the University Committee for Laboratory Animals at Dalhousie University, and all animals were treated in accordance with guidelines set forth by the Canadian Council on Animal Care. All reagents were purchased from Sigma Chemical Co. (St Louis, MO) unless otherwise stated. Adult goldfish (Carassius auratus), 10–15 cm in length, were kept on a 12 h light/dark cycle and housed in aerated aquaria with a water temperature of approximately 18°C. At least 3 h into the light cycle, an animal was placed in darkness for 15–20 min. Under dim red illumination, the animal was decapitated and pithed and a retina was quickly isolated and placed in the superfusion chamber. The preparation was superfused (1–2 ml/min) in darkness for 30 min prior to intracellular recording. The bathing solution contained (in millimolar): 100 NaCl, 2.5 KCl, 1.2 MgSO4, 1.0 CaCl2, 20 D-glucose, and 20 NaHCO3 and was bubbled continuously with 97.5% O2/2.5% CO2 (pH 7.5).
Intracellular microelectrode recordings
Borosilicate glass electrodes were pulled on a Flaming–Brown model P-97 microelectrode puller (Sutter Instruments, Novato, CA) and filled with 2.5 M KCl, yielding a resistance of 50–150 MΩ. Light stimulus was produced using a modified Powerlite S1+ digital projector (Epson Canada, Toronto, Canada) controlled by ACME 500i software (provided by Dr. John McReynolds, University of Michigan). The maximum unattenuated light irradiance (I 0) was 655 μW/cm2 that was adjusted by placing calibrated neutral density filters in the light path. Neutral density values (I) reported hereafter are stated as log(I/I 0). Electrodes were positioned into the retina using a piezoelectric positioning system (Burleigh Inchworm; Burleigh Instruments Inc., Victor, NY). Intracellular recordings were amplified using a Dagan 8700 Cell Explorer amplifier (Dagan Corporation, Minneapolis, MN) and recorded and analyzed using Axoscope 9.0 (Axon Instruments Inc., Union City, CA). Horizontal cell somata were impaled 30–50 μm below the surface of the retina and the subtype identified based upon their response to chromatic stimuli (Stell et al., Reference Stell, Lightfood, Wheeler and Leeper1975; Stell & Lightfoot, Reference Stell and Lightfoot1975). Although all horizontal cell types were encountered, L-type (H1) cells predominated, and therefore, the data presented are from this subtype only.
The receptive field size of horizontal cells was assessed by comparing the peak response to a centered 500 μm spot of white (full spectrum) light to that of an annulus (outer diameter 3.5 mm and inner diameter 3.0 mm) and by measuring the peak response to a slit of white light (width 150 μm and length 2.6 cm) positioned at the tip of the electrode (zero position) and then translated 0.25, 0.75, 1.25, 1.75, 2.25, and 2.75 mm away from the zero position. Spot, annulus, and slit stimulation were each 400 ms in duration. Interstimulus interval was 2000 ms between the presentation of the spot and annulus and 4000 ms between each translated slit distance. Spot–annulus and slit translation data from at least five different H1 cells were recorded and averaged per retina. Then, one of the following treatments was applied: (1) −3.5 log(I/I 0) full-field light was applied for 2 min and then discontinued. (2) Normal Ringer’s solution was changed for 5 min to one containing the nitric oxide donor DETA NONOate (100 μM; Cayman Chemical, Ann Arbor, MI). The DETA NONOate-containing solution was prepared immediately prior to use. (3) −3.5 log(I/I 0) full-field light adaptation in the presence of the competitive nitric oxide synthase inhibitor, L-NAME (1 mM). L-NAME was present in the superfusate for the entirety of the experiment. Following each treatment, horizontal cell receptive field size was assessed as outlined above. In each treatment condition, five cells were recorded (over a period of 30 min) and averaged per retina.
Data analysis and statistics
The relative response to spot and annulus stimuli was quantified by dividing the amplitude of the peak response to the annulus (V annulus) by the amplitude of the peak response to the spot (V spot) to produce a V annulus:V spot ratio. The relative response to spot and annulus stimuli (and V annulus:V spot ratio) has been used extensively as an indicator of horizontal cell receptive field size (Baldridge & Ball, Reference Baldridge and Ball1991; Pottek et al., Reference Pottek, Schultz and Weiler1997; Djamgoz et al., Reference Djamgoz, Petruv, Yasui, Furukawa and Yamada1998; Weiler et al., Reference Weiler, Schultz, Pottek, Tieding and Janssen-Bienhold1998; Pottek & Weiler, Reference Pottek and Weiler2000; Xin & Bloomfield, Reference Xin and Bloomfield2000; Furukawa et al., Reference Furukawa, Petruv, Yasui, Yamada and Djamgoz2002). For slit translation, the responses were normalized to the maximum peak light response (at the zero position) for each cell recorded and, in some cases, fit with a single exponential decay function (Prism 4; GraphPad, La Jolla, CA). Statistical comparisons were done using the Student’s t-test (pairwise comparison) or analysis of variance (with the Bonferroni posttest for multiple comparisons) (Prism 4), and data are reported as mean ± standard deviation).
Results
Care was taken to limit the exposure of goldfish retinas to light prior to recording from horizontal cells. However, retinas were not subjected to prolonged periods of darkness, or protocols to limit exposure to light flashes prior to cell impalement, conditions that have been reported to reduce horizontal cell response amplitude (responsiveness) and receptive field size, a phenomenon termed “dark suppression” (Yang et al., Reference Yang, Tornqvist and Dowling1988). Consequently, we use the term “light sensitized (LS)” (Yang et al., Reference Yang, Tornqvist and Dowling1988; Baldridge et al., Reference Baldridge, Weiler and Dowling1995) to describe the responses of horizontal cells at the start of the experiments.
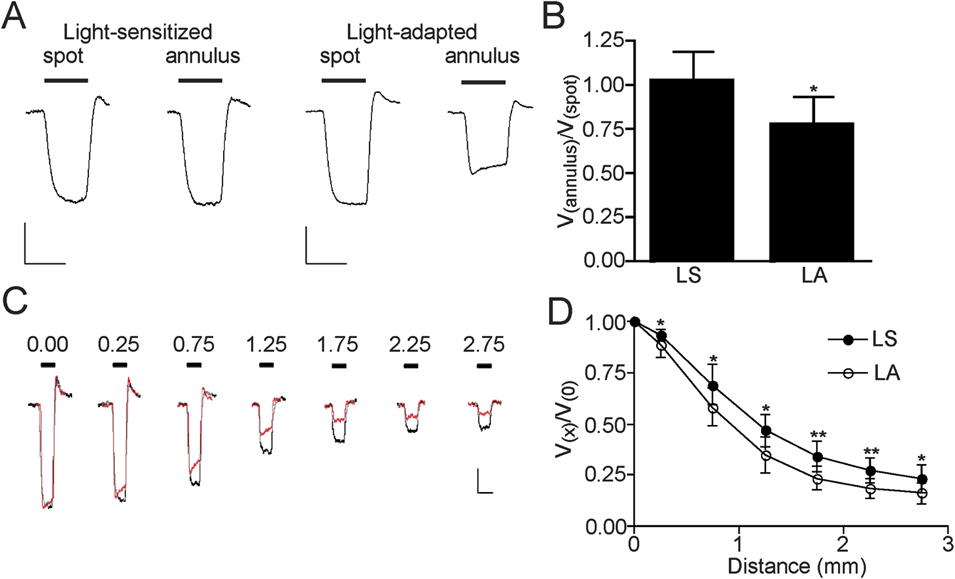
Horizontal cell receptive field size was assessed using static stimuli (a 500 μm spot and a 3.5 mm outer diameter and 3.0 mm inner diameter annulus centered at the position of the recording pipette) and by measuring the peak response to a slit (width 150 μm and length 2.6 cm) at discrete distances after translation up to 2.75 mm away from the position of the recording pipette. In the case of the spot and annulus, at an intensity of −3.5 log(I/I 0) and under LS conditions, these stimuli typically produced peak responses of similar amplitudes (Figs. 1A and 2A), with a ratio of the response to the annulus (V annulus) compared to the response to the spot (V spot) near unity (1.03 ± 0.16, n = 14).
Illumination reduces H1 horizontal cell receptive field size in the goldfish retina. (A) Representative recordings of the responses of horizontal cells to spot (500 μm diameter) and annulus (3.5 mm outer diameter and 3.0 mm inner diameter) stimuli before [light-sensitized (LS)] and after [light-adapted (LA)] exposure to 2 min of steady full-field −3.5 log(I/I 0) illumination. To emphasize the amplitude of the response to the annulus relative to the spot, the size of the responses following light adaptation has been adjusted so that the spot response is the same as that prior to illumination (LS). The response to the annulus, relative to the response to the spot, was decreased following illumination. Scale bars: 10 mV vertically, 400 ms horizontally. (B) Mean [±standard deviation (s.d.)] of the ratio of the response to the annulus and the response to the spot (V annulus:V spot) was decreased (*P < 0.05, n = 8) when LS retinas were exposed to illumination (LA). (C) Representative recordings of the responses of horizontal cells to slit stimuli (width 150 μm and length 2.6 cm) at discrete distances after translation up to 2.75 mm away from the position of the recording pipette before (black) and after (red or gray) exposure to illumination. The decay in the response to slit stimuli with distance is greater after illumination. Scale bars: 10 mV vertically, 400 ms horizontally. (D) Mean (±s.d.) responses to slit stimuli after translation up to 2.75 mm (relative to the response at the position of the recording pipette, V (0)) before (LS) and after (LA) exposure to illumination. Following illumination, the relative response (V (x)/V (0)) at each translation position was decreased (*P < 0.05; **P < 0.01, n = 8).

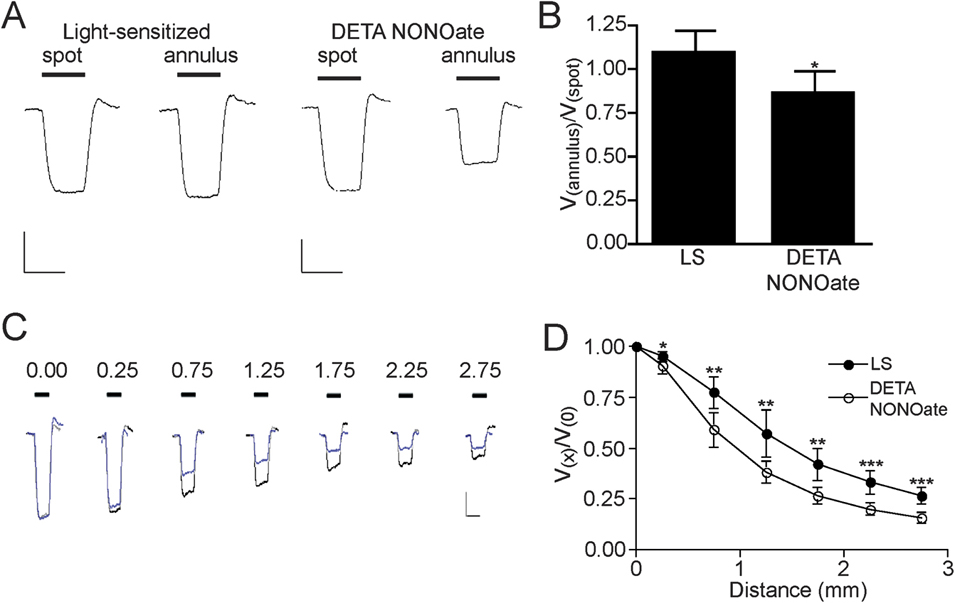
Nitric oxide donor reduces H1 horizontal cell receptive field size in the goldfish retina. (A) Representative recordings of the responses of horizontal cells to spot (500 μm diameter) and annulus (3.5 mm outer diameter and 3.0 mm inner diameter) stimuli before [light sensitized (LS)] and after treatment with (Z)-1-[N-(2-aminoethyl)-N-(2-ammonioethyl)amino]diazen-1-ium-1,2-diolate (DETA NONOate) (100 μM) for 5 min. To emphasize the amplitude of the response to the annulus relative to the spot, the size of the responses following treatment with DETA NONOate has been adjusted so that the spot response is the same as that prior to treatment (LS). The response to the annulus, relative to the response to the spot, was decreased following DETA NONOate treatment. Scale bars: 10 mV vertically, 400 ms horizontally. (B) Mean [±standard deviation (s.d.)] of the ratio of the response to the annulus and the response to the spot (V annulus/V spot) was decreased (*P < 0.05, n = 6) when LS retinas were treated with DETA NONOate. (C) Representative recordings of the responses of horizontal cells to slit stimuli (width 150 μm and length 2.6 cm) at discrete distances after translation up to 2.75 mm away from the position of the recording pipette before (black) and after (blue or gray) treatment with DETA NONOate. The decay in the response to slit stimuli with distance was greater after NO donor treatment. Scale bars: 10 mV vertically, 400 ms horizontally. (D) Mean (±s.d.) responses to slit stimuli after translation up to 2.75 mm (relative to the response at the position of the recording pipette, V (0)) before (LS) and after treatment with DETA NONOate. Following treatment with NO donor, the relative response (V (x)/V (0)) at each translation position was decreased (*P < 0.05; **P < 0.01; ***P < 0.001, n = 6).

We first tested the effect of exposing the retina to full field (whole retina) −3.5 log(I/I 0) illumination for 2 min. Illumination resulted in a relative decrease in the response to the annulus compared to the response to the spot (Fig. 1A). On average, there was a 25% decrease (P < 0.05) in the V annulus:V spot ratio from 1.01 ± 0.18 to 0.76 ± 0.18 (Fig. 1B, n = 8). Similar results were found when comparing the peak responses to slit stimuli translated up to 2.75 mm from the position of the recording pipette. In recordings from two representative cells, one before illumination and one after a 2-min period of −3.5 log(I/I 0) illumination, but both with similar peak response amplitude to the slit positioned at the recording pipette (x = 0), the decay in the response amplitude with translation distance is greater in the horizontal cell recorded after illumination (Fig. 1C). On average, the normalized response at each translation position was less (P < 0.05 or better) after illumination (Fig. 1D). The effect of illumination on horizontal cell receptive field size did not reverse over the subsequent period during which five cells were recorded. Horizontal cell dark resting membrane potential was not affected significantly (P > 0.05) by light adaptation. Overall, these results are consistent with previous reports of decreased horizontal cell receptive field size by periods of full-field illumination, a change that has been termed “light adaptation” (Baldridge, Reference Baldridge2001).
We next demonstrated that treatment with a nitric oxide donor mimicked the effect of illumination on our measures of horizontal cell receptive field size. Similar to the effect of illumination, treatment with the NO donor DETA NONOate (100 μM) for 5 min resulted in a relative decrease in the peak response to the annulus compared to the peak response to the spot (Fig. 2A). On average, treatment with NO donor produced a 22% decrease (P < 0.05) in the V annulus:V spot ratio from 1.06 ± 0.15 to 0.83 ± 0.15 (Fig. 2B, n = 6). Similar results were found when comparing the responses to translated slit stimuli. In recordings from two representative cells, one before and one after treatment with 100 μM DETA NONOate, the decay in the peak response amplitude with translation distance was greater in the horizontal cell recorded after treatment with NO donor (Fig. 2C). On average, the normalized response at each translation position was less (P < 0.05 or better) after treatment (Fig. 2D). Similar to the effect of illumination on horizontal cell receptive field size, the effect of DETA NONOate did not reverse over a 30-min washout period. Horizontal cell dark resting membrane potential was not affected significantly (P > 0.05) by treatment with DETA NONOate.
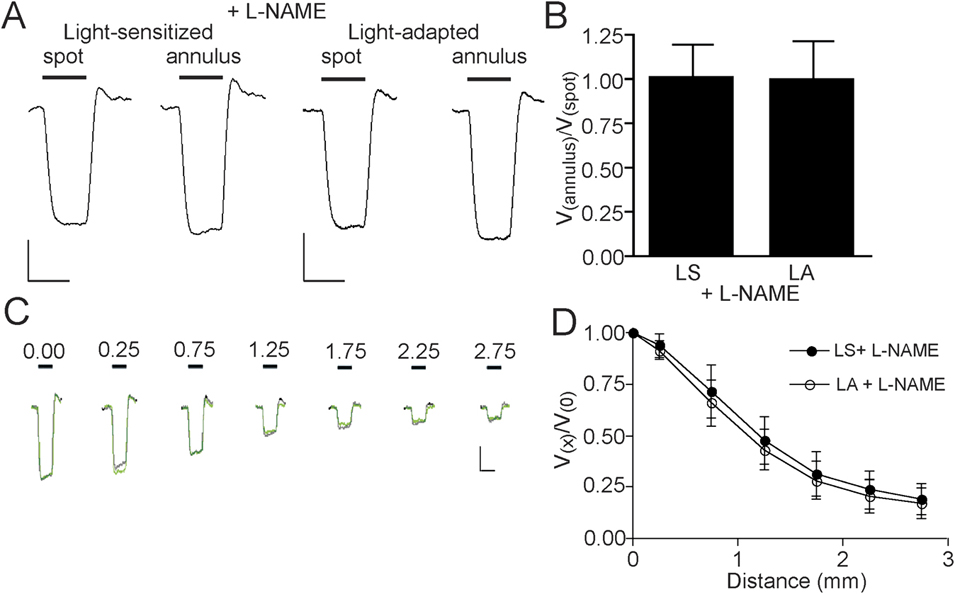
To determine if the effect of light adaptation on horizontal cell receptive field size is related to endogenous nitric oxide production, we challenged the effect of illumination using the nitric oxide synthase inhibitor, L-NAME. In the presence of 1 mM L-NAME, exposure to a 2-min period of −3.5 log(I/I 0) illumination did not significantly alter the peak response to the annulus relative to the peak response to the spot (Fig. 3A and 3B). Similar results were found when comparing the peak responses to translated slit stimuli. In the presence of 1 mM L-NAME, the decay in the peak response to the slit with translation distance was not affected by illumination (Fig. 3C and 3D). Horizontal cell dark resting membrane potential was not affected significantly (P > 0.05) by light adaptation.
The effect of illumination on H1 horizontal cell receptive field size in the goldfish retina is reduced in the presence of nitric oxide synthase inhibitor. (A) Representative recordings of the responses of horizontal cells to spot (500 μm diameter) and annulus (3.5 mm outer diameter and 3.0 mm inner diameter) stimuli before [light-sensitized (LS)] and after [light-adapted (LA)] exposure to 2 min of steady full-field −3.5 log(I/I 0) illumination in the presence of 1 mM NG-nitro-L-arginine methyl ester (L-NAME). To emphasize the amplitude of the response to the annulus relative to the spot, the size of the responses following light adaptation has been adjusted so that the spot response is the same as that prior to illumination (LS). The response to the annulus, relative to the response to the spot, was not decreased following illumination. Scale bars: 10 mV vertically, 400 ms horizontally. (B) Mean [±standard deviation (s.d.)] of the ratio of the response to the annulus and the response to the spot (V annulus/V spot) was not decreased (P > 0.05, n = 8) when LS retinas were exposed to illumination (LA) in the presence of L-NAME. (C) Representative recordings of the responses of horizontal cells to slit stimuli (width 150 μm and length 2.6 cm) at discrete distances after translation up to 2.75 mm away from the position of the recording pipette before (black) and after (green or gray) exposure to illumination in the presence of L-NAME. In the presence of L-NAME, the decay in the response to slit stimuli with distance after illumination was unchanged. Scale bars: 10 mV vertically, 400 ms horizontally. (D) Mean (±s.d.) responses to slit stimuli after translation up to 2.75 mm (relative to the response at the position of the recording pipette, V (0)) before (LS) and after (LA) exposure to illumination in the presence of L-NAME. Following illumination, the relative response (V (x)/V (0)) at each translation position was not decreased (P > 0.05, n = 8).

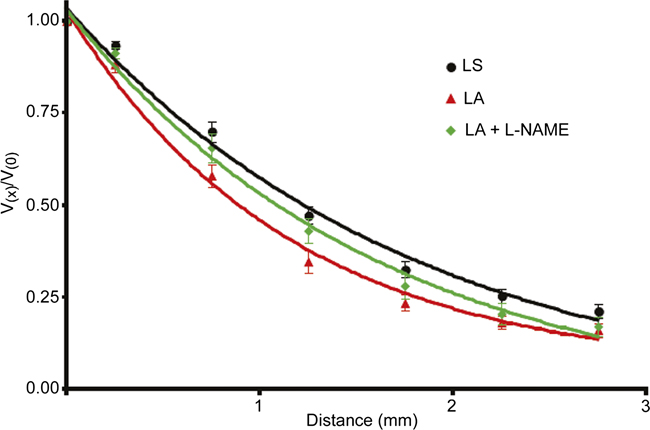
To compare directly the effect of light, in the absence and presence of L-NAME, we fit the translated slit data with a single exponential decay function (Fig. 4). As the data from LS retinas, treated or untreated with L-NAME, were not significantly different (P > 0.05 at each translation point), these data were combined. Each group was well fit (r 2 > 0.99) by a single exponential. The decay constant (k, where Vx/V 0 ≈ e−kx) generated from the recordings from LS horizontal cells (0.55 ± 0.11, n = 16) was significantly (P < 0.001) different from the decay constant from light-adapted horizontal cells (0.87 ± 0.11, n = 8). The decay constant from light-adapted horizontal cells (0.62 ± 0.10, n = 8), in the presence of 1 mM L-NAME, was different (P < 0.001) from decay constant from light-adapted horizontal cells but not (P > 0.05) from LS horizontal cells. Illumination reduced the half-decay distance, derived from each exponential curve, from 1.3 (LS) to 0.80 mm but less so (1.1 mm) in the presence of L-NAME.
NG-nitro-L-arginine methyl ester (L-NAME) reduces the effect of illumination on the decay constant from normalized translated slit data fit with a single exponential function. Mean [±standard deviation (s.d.)] responses to slit stimuli after translation up to 2.75 mm (relative to the response at the position of the recording pipette, V (0)) before [light-sensitized (LS)] and after exposure to illumination in the absence [light-adapted (LA)] or presence (LA + L-NAME) of L-NAME. The data have been fit with a single exponential decay function. The decay constant (k, where Vx/V 0 ≈ e-kx) from LS horizontal cells (circles, black, n = 16) was significantly (P < 0.001) reduced following illumination (LA, triangle, red, n = 8). The decay constant from LA horizontal cells, in the presence of 1 mM L-NAME (LA + L-NAME, diamond, green, n = 8), was greater (P < 0.001) than the decay constant from LA horizontal cells but not different (P > 0.05) from the decay constant from LS horizontal cells. Each group was well fit (r 2 > 0.99) by the single exponential.

Discussion
It has previously been demonstrated that the receptive field size of horizontal cells is decreased by exposure to sustained periods of illumination (Shigematsu & Yamada, Reference Shigematsu and Yamada1988; Baldridge & Ball, Reference Baldridge and Ball1991; Dong & McReynolds, Reference Dong and McReynolds1991; Umino et al., Reference Umino, Lee and Dowling1991; Djamgoz et al., Reference Djamgoz, Petruv, Yasui, Furukawa and Yamada1998; Weiler et al., Reference Weiler, Schultz, Pottek, Tieding and Janssen-Bienhold1998; Xin & Bloomfield, Reference Xin and Bloomfield1999; Pottek & Weiler, Reference Pottek and Weiler2000). We now report that nitric oxide contributes to the light-induced reduction of horizontal cell receptive field size as the effect of light was significantly reduced in the presence of the nitric oxide synthase inhibitor L-NAME.
A light-induced decrease of horizontal cell receptive field size mediated by nitric oxide is consistent with other studies of nitric oxide in the retina. Application of nitric oxide donors reduces horizontal cell receptive field size by decreasing gap junction coupling (Lu & McMahon, Reference Lu and McMahon1997; Pottek et al., Reference Pottek, Schultz and Weiler1997; Xin & Bloomfield, Reference Xin and Bloomfield2000; Furukawa et al., Reference Furukawa, Petruv, Yasui, Yamada and Djamgoz2002). Nitric oxide has also been implicated in the effects of light adaptation on the spectral responses of horizontal cells (Yamada et al., Reference Yamada, Fraser, Furukawa, Hirasawa, Katano, Djamgoz and Yasui1999; Furukawa et al., Reference Furukawa, Petruv, Yasui, Yamada and Djamgoz2002), the transfer function between cones and horizontal cells (Levy et al., Reference Levy, Twig and Perlman2004), and the maintenance of horizontal to cone feedback (Savchenko et al., Reference Savchenko, Barnes and Kramer1997). In each case, the effect of light adaptation was reduced by either a scavenger of nitric oxide or a nitric oxide synthase inhibitor. In mammalian (rabbit) retina, application of nitric oxide donor prevented the increase in horizontal cell receptive field size and coupling that normally occurs when dark-adapted retinas are exposed to dim background illumination (Xin & Bloomfield, Reference Xin and Bloomfield2000). Although this result is consistent with nitric oxide as a mediator of the reduction of horizontal cell receptive field size by bright background illumination (Xin & Bloomfield, Reference Xin and Bloomfield1999), it is not direct evidence that this is the case.
Nitric oxide donors mimic the effect of light on lower vertebrate cone photomechanical movements, and the effect of light was reduced by pretreatment with a nitric oxide scavenger (Greenstreet & Djamgoz, Reference Greenstreet and Djamgoz1994; Angotzi et al., Reference Angotzi, Hirano, Vallerga and Djamgoz2002; Haamedi & Djamgoz, Reference Haamedi and Djamgoz2002). Nitric oxide donors also mimic the effect of light by inducing the formation of spinules on horizontal cell dendrites (Greenstreet & Djamgoz, Reference Greenstreet and Djamgoz1994; Haamedi & Djamgoz, Reference Haamedi and Djamgoz2002). There is, however, some disagreement about whether the effect of light on horizontal cell spinule formation is mediated by nitric oxide. One study reported that the effect of light was blocked by a nitric oxide scavenger (Haamedi & Djamgoz, Reference Haamedi and Djamgoz2002) but another found that an inhibitor of nitric oxide synthase did not alter light-induced spinule formation (Pottek et al., Reference Pottek, Schultz and Weiler1997). Direct assessment of nitric oxide, using a variety of approaches, consistently suggests increased levels during light adaptation both in lower vertebrate and in mammalian retinas (Zemel et al., Reference Zemel, Eyal, Lei and Perlman1996; Neal et al., Reference Neal, Cunningham and Matthews1998; Eldred & Blute, Reference Eldred and Blute2005; Sekaran et al., Reference Sekaran, Cunningham, Neal, Hartell and Djamgoz2005; Piehl et al., Reference Piehl, Capani, Facorro, Lopez, de Celis, Pustovrh, Hager, Coirini and Lopez-Costa2007).
Many types of retinal neurons are potential sources of nitric oxide in the retina. Neuronal nitric oxide synthase is localized to amacrine cells, but several studies suggests that elements in the outer retina, including photoreceptors, horizontal cells, and bipolar cells, could also be potential sources (Weiler & Kewitz, Reference Weiler and Kewitz1993; Liepe et al., Reference Liepe, Stone, Koistinaho and Copenhagen1994; Kurenni et al., Reference Kurenni, Thurlow, Turner, Moroz, Sharkey and Barnes1995; Blute et al., Reference Blute, Mayer and Eldred1997; Haverkamp & Eldred, Reference Haverkamp and Eldred1998; Eldred & Blute, Reference Eldred and Blute2005; Blom et al., Reference Blom, Blute and Eldred2009; Giove et al., Reference Giove, Deshpande and Eldred2009; Pang et al., Reference Pang, Gao and Wu2010). For nitric oxide to be a modulator of horizontal cells may require a nearby source, perhaps the horizontal cells themselves, as the diffusion of nitric oxide from one retinal neuron to another may be limited (Eldred & Blute, Reference Eldred and Blute2005). If neuronal nitric oxide synthase is activated by increased intracellular calcium ion concentration ([Ca2+]i) (Schmidt et al., Reference Schmidt, Pollock, Nakane, Forstermann and Murad1992), due to Ca2+ influx through voltage- or ligand-gated channels, it is not clear how [Ca2+]i could increase in horizontal cell during illumination. One interesting possibility in the teleost is that melanopsin-containing horizontal cells drive nitric oxide production because its activation has been shown to increase voltage-gated Ca2+ channel activity (Cheng et al., Reference Cheng, Tsunenari and Yau2009). Alternatively, since ON bipolar cells depolarize in response to light and this could lead to activation of voltage-gated Ca2+ channels, elevated [Ca2+]i, and activation of nitric oxide synthase. In fact, application of l-amino-4-phosphonobutyrate, which blocks transmission between photoreceptors and depolarizing bipolar cells, abolishes light-dependent release of nitric oxide in the retina (Neal et al., Reference Neal, Cunningham and Matthews1998; Sekaran et al., Reference Sekaran, Cunningham, Neal, Hartell and Djamgoz2005). Neuronal nitric oxide synthase-containing amacrine cells in mouse were recently shown to depolarize in response to light (Pang et al., Reference Pang, Gao and Wu2010). This could lead to activation of voltage-gated Ca2+ channels, elevated [Ca2+]i, and activation of nitric oxide synthase.
Two studies have suggested that light-induced increases of dopamine trigger the production of nitric oxide (Haamedi & Djamgoz, Reference Haamedi and Djamgoz2002; Sekaran et al., Reference Sekaran, Cunningham, Neal, Hartell and Djamgoz2005). Previous work has demonstrated that the effect of steady light on horizontal cell receptive field size was not blocked by dopamine receptor antagonists or after the ablation of endogenous dopaminergic neurons (Baldridge & Ball, Reference Baldridge and Ball1991; Umino et al., Reference Umino, Lee and Dowling1991). This suggests that the effect of light on horizontal cell receptive field size, an effect reported here to be blocked by nitric oxide synthase inhibitor, can occur independently of dopamine.
A possible mechanism by which nitric oxide reduces horizontal cell receptive field size is by increasing intracellular 3′,5′-cyclic guanosine monophosphate (cGMP), through activation of guanylyl cyclase, that then reduces gap junction coupling (DeVries & Schwartz, Reference DeVries and Schwartz1989; Lu & McMahon, Reference Lu and McMahon1997). However, while several studies have reported that nitric oxide donor increases levels of cGMP immunoreactivity within presumptive horizontal cells or their processes in the outer plexiform layer, no differences were noted between light- and dark-adapted retinas (Blute et al., Reference Blute, Velasco and Eldred1998; Gotzes et al., Reference Gotzes, de Vente and Muller1998; Baldridge & Fischer, Reference Baldridge and Fischer2001; Blom et al., Reference Blom, Blute and Eldred2009).
It is also possible that nitric oxide affects horizontal cell receptive field size through mechanism other than, or in addition to, the modulation of gap junction coupling. Two possibilities are decreased horizontal cell membrane resistance or increased horizontal cell to cone feedback. In the former case, effects of nitric oxide on glutamate release from cones, or the modulation of glutamate receptor currents of horizontal cells, could alter horizontal cell membrane resistance and affect receptive field size. However, nitric oxide has been shown to reduce cone calcium currents (Kourennyi et al., Reference Kourennyi, Liu, Hart, Mahmud, Baldridge and Barnes2004), suggesting that modulation of glutamate release from cones is an unlikely mechanism by which nitric oxide affects horizontal cell receptive field size. Nitric oxide has been reported to produce, on average, a small (but not necessarily statistically significant) depolarization of the dark resting membrane potential of horizontal cells (Pottek et al., Reference Pottek, Schultz and Weiler1997; Xin & Bloomfield, Reference Xin and Bloomfield2000), and this would be consistent with potential decrease in horizontal cell membrane resistance. We did not find significant differences of horizontal cell dark resting membrane potential, suggesting that a change in membrane resistance is not responsible for the effect of light adaptation of nitric oxide on horizontal cell receptive field size. Although increased horizontal cell to cone feedback could explain changes of horizontal cell receptive field size, an alteration of the timing of the peak response, affected by the waveform of the horizontal cell response, does not explain the changes of horizontal cell receptive field size we report. A shift in the time of the peak response from late in the response to early in the response, as might be produced by increased feedback, would increase horizontal cell receptive field size, not decrease it (Kamermans et al., Reference Kamermans, Haak, Habraken and Spekreijse1996).
In summary, our results indicate that the reduction of horizontal cell receptive field size by light adaptation depends on nitric oxide. However, the mechanism by which nitric oxide exerts such an influence remains to be determined.
Acknowledgments
This work was supported by a Discovery Grant from the Natural Sciences and Engineering Research Council (NSERC) of Canada to W.H.B. and an NSERC Scholarship to B.A.D.