Introduction
Lysozyme is an anti-bacterial enzyme present in the body tissues, fluids and secretions of animals and humans. It cleaves peptidoglycans from the cell wall of Gram-positive bacteria, as well as from the outer membrane of Gram-negative bacteria. More specifically, it catalyzes the hydrolysis of β1–4 linkage between N-acetyl glucosamine and N-acetyl muramic acid present in polymer form in the bacterial cell wall (Jeanloz et al., Reference Jeanloz, Sharon and Flowers1963). Lysozyme from porcine and human milks, in combination with complement and secretory IgA, exhibits significant bactericidal activity to Escherichia coli in vitro (Sordillo et al., Reference Sordillo, Shafer-Weaver and DeRosa1997). In addition, lysozyme can limit the migration of neutrophils into damaged tissue and thus may function as an anti-inflammatory agent. Grün (Reference Grün1985) reported that lysozyme was one of the important factors for conferring innate defense mechanism to the mammary gland.
In Indian Sahiwal × Holstein Friesian crossbred cows, the occurrences of mastitis are very frequent and, consequently, it has been one of the great concerns for the dairy industry in India. Bovine milk contained lysozyme, which has approximately the same molecular weight as that of chicken lysozyme found in egg white (Chandan et al., Reference Chandan, Shahani and Holly1964). Lysozyme level is found to be higher in colostrum and mastitic milk than in normal milk (Goudswaard et al., Reference Goudswaard, Bakker-de Koff and Van Ravenswaaij-Kraam1978). The literature suggested that lysozyme plays a crucial role in combating mastitis in cows although there are some other molecules also participating in conferring resistance to the growth of pathogenic organisms in the mammary gland (Schmedt Auf Der Günne et al., Reference Schmedt Auf Der Günne, Tenhagen, Kutzer, Forderung and Heuwieser2002). The structure and organization of the lysozyme gene in Bos taurus cow are available at the National Centre for Biotechnology Information (NCBI) genbank. However, for Bos indicus and B. taurus × Indian B. indicus cow, it has not been reported so far in the literature. The bacteriocidal effect of this molecule has directed us to unravel the gene structure and variability of this gene in Indian Sahiwal × Holstein Friesian cows so that a possible association between genic variability with milk somatic cell content, which is an indicator of mammary gland health, could be explored precisely. Earlier literature revealed the genetic polymorphism of bovine lysozyme gene where three restriction fragment length polymorphism (RFLP) alleles were observed (Sigurdardottir et al., Reference Sigurdardottir, Lunden and Anderson1990). In the present study, we characterized the coding region of lysozyme gene of crossbred B. indicus × B. taurus cattle and elucidated the existence of polymorphism at this gene along with the association between its genotypes/haplotypes with milk production and milk somatic cell concentration.
Material and methods
Collection of sample
About 10 ml of milk from two mastitis-affected Indian Sahiwal × Holstein Friesian crossbred cows was collected from the Clinics of College of Veterinary and Animal Sciences, G.B. Pant University of Agriculture and Technology, Pantnagar, Uttaranchal, India. Milk somatic cells were pelleted by centrifugation and used for RNA isolation.
For polymorphism study, a total of 250 Indian Sahiwal × Holstein Friesian crossbred cattle maintained at Instructional Dairy Farm, G.B. Pant University of Agriculture and Technology, Pantnagar, Uttaranchal, India, were included. About 5 ml of blood was collected from each animal. Genomic DNA was isolated from blood following the phenol–chloroform extraction protocol (Sambrook and Russell, Reference Sambrook and Russell2001).
RNA
The total RNA was extracted from milk somatic cells of two animals following the standard protocol (Sambrook and Russell, Reference Sambrook and Russell2001). The purity of the RNA was checked by measuring absorbance of the RNA in a UV-spectrophotometer at 260 and 280 nm wave lengths using Milli Q water as blank. The RNA samples showing the optical density – OD260 : OD280 1.9 to 2.2 were considered to be of good quality. Furthermore, the integrity of the extracted RNA was checked by conducting 2.2 M formaldehyde denatured agarose gel electrophoresis.
Primer for reverse transcription polymerase chain reaction (RT-PCR)
For the amplification of the milk lysozyme gene open reading frame, the primers were designed from the B. taurus mRNA sequence available at the NCBI (AY684064). The sequences of the primers were forward (LYS1), 5′ ATGAAGGCTCTCCTTATTGTG 3′ and reverse (LYS2), 5′ TTACACTCTGCAACCCTGAAC 3′.
RT-PCR
About 2 μg of total RNA for each sample were taken in 0.2 ml PCR tubes, incubated at 70°C for 10 min and immediately snapped in ice. The master mix (MgCl2, 25 mM; reverse transcription buffer, 10×; deoxynucleotidetriphosphate (dNTP) mixture, 10 mM; Rnasin; avian myeloblastosis virus (AMV) reverse transcriptase, 15 U; Oligo (dT)15 primer and nuclease free water to make a final volume of 20 μl) was added to the PCR tube containing RNA. The reaction mixtures with RNA were incubated at 42°C for 15 min, heated to 95°C for 5 min and finally incubated at 5°C for 5 min to synthesize first-strand cDNA. Gene-specific PCR was carried out to amplify lysozyme cDNAs with a final volume of 25 μl PCR reaction mixtures containing 80 ng cDNA, 100 μM of each dNTP, 50 ng of each primer (LYS1 and LYS2), 2.0 mM MgCl2 and 1 U Taq DNA polymerase. The amplification condition was 94°C for 2 min followed by 30 cycles of 94°C for 45 s, 55°C for 45 s and 72°C for 1 min with a final extension of 72°C for 5 min.
Purification of the RT-PCR product
The amplified products were run in 0.8% agarose gel and the gel slice containing specific DNA band was excised. The DNA was isolated from that gel slice using a MinElute Gel extraction Kit (Qiagen, Hilden, Germany) following the manufacturer’s instruction. Thus, PCR products were purified for further cloning experiment.
Cloning of cDNA
The purified PCR products were cloned in pDRIVE cloning vector (Qiagen) and were transformed into E. coli DH5α. The recombinant clones were identified by white color on IPTG LB-agar plates and initially screened by the colony PCR, and later confirmed by the plasmid-PCR. Positive samples were reconfirmed by restriction digestion of the plasmid DNA with EcoR1 enzyme.
Sequencing and analysis of cloned cDNA
Two recombinant clones were sequenced from both sides of the insert in an ABI prism 377 DNA sequencer (Perkin-Elmer, MA, USA) using Sanger’s dideoxy chain termination method. The T7 forward and SP6 reverse primers were used for the sequencing of the clones. The sequences obtained were first blasted at www.ncbi.nlm.nih.gov to ascertain that the sequences were of milk lysozyme gene. The sequences from two clones were compared for the confirmation of correct sequences. The amino acid sequences were predicted from the base sequences of the gene. Both nucleotide and amino acid sequences were then aligned with those from different species using the clustalW method of MegAlign programme of DNASTAR Software (Lasergene Inc., Madison, USA). Secondary structure of the protein was predicted (Rost and Sander, Reference Rost and Sander1993) and solvent accessibilities were determined based on predicted amino acid sequences (Rost et al., Reference Rost, Fariselli and Casadio1996).
PCR
Two pairs of primers for amplification of the extended exon1 including partial promoter region (268 bp) and extended exon2 (287 bp) of milk lysozyme gene were designed from B. taurus mRNA sequences available at the NCBI (U25810 and AY684064). The sequences of the primers for promoter and exon1 were forward (E1) 5′ CCCAAACCAGTCACATAAGAAGGA 3′ and reverse (E2) 5′ CTGGCTAACTATTTGAAAGGATGAA 3′ while for exon2 they were forward (EF) 5′ AGTCATATGATTTGCTCTTTA 3′ and reverse (ER) 5′ TGAATGAACCTTTTGCATA 3′. The PCR reaction mixture for both extended exon1 and extended exon2 fragments included 80 ng genomic DNA, 20 pM of each primer, 200 μM each dNTP, I U Taq DNA polymerase and 1.5 mM MgCl2. The cycling conditions for the extended exon1 fragment was initial denaturation at 94°C for 5 min, 29 cycles of denaturation at 94°C for 45 s, annealing at 50°C for 30 s and extension at 72°C for 30 s and final extension at 72°C for 10 min. The PCR programme for extended fragment2 was initial denaturation at 94°C for 5 min, 29 cycles of denaturation at 94°C for 45 s, annealing at 53°C for 30 s and extension at 72°C for 30 s and final extension at 72°C for 10 min.
Single-stranded conformation polymorphism (SSCP)
A 12% native PAGE (50 : 1, acrylamide and bis-acrylamide) with 5% glycerol was prepared for electrophoresis. Furthermore, 3 μl of pcr product mixed with 15 μl formamide dye (95% formamide, 0.025% xylene cyanol, 0.025% bromophenol blue, 0.5 M ethylene diamine tetraacetic acid (EDTA)) was denatured at 95°C for 5 min followed by snapped cooling on ice for 15 min. Then, the product was loaded in the gel and electrophoresis was performed at 4°C for 12 h at 200 V. After electrophoresis was over, the gel was stained with silver nitrate to visualize banding patterns of the fragments (Vohra et al., Reference Vohra, Bhattacharya, Kumar and Sharma2006).
Sequencing of SSCP variants
The PCR products belonging to different SSCP genotypes were sequenced with the fragment-specific primers from both sides by the automated dye–terminator cycle sequencing method in an ABI PRIZM 377 DNA sequencer (Perkin-Elmer).
Traits
Two categories of traits such as milk production and somatic cell scores were considered for the present study of which milk production and other data were recorded from the farm registers and milk somatic cells were counted following standard protocol. Somatic cell score was calculated from the cell count by log transformation. The milk production traits included total milk production, daily milk production, peak yield and lactation length during first lactation.
Statistical analysis
Gene and genotype frequencies were calculated by the gene counting method described by Falconer and Mackay (Reference Falconer and Mackay1996). Sequence analysis was performed with DNASTAR Software (Lasergene Inc.). Haplotypes were constructed by combining single nucleotide polymorphisms (SNPs) of exon1 with partial promoter and exon2 extended fragments of each individual on haploid basis and, finally, haplotype combinations were developed for each animal. The association of genotypes/haplotype combinations and traits was estimated following the least-square maximum likelihood method of the LSML90 package (Harvey, Reference Harvey1990) where genotype and age at first calving were used as fixed effects and sire as random effect (Badola et al., Reference Badola, Bhattacharya, Biswas, Kumar and Sharma2003). The age at first calving was classified into three groups, namely <1000, 1001 to 1200 and >1200 days. Thus, the model used for this analysis was Y = μ + Si + Gj + Ak + eijk (where μ = overall mean, Si = ith sire effect, Gj = jth genotype effect, Ak = kth age at first calving and eijk = residual effect).
Results
Sequence characteristics
Sequencing of selected representative clones revealed that the insert was of exactly 447 bp with a guanine-cytosine (GC) content of 47.20%. The sequence was submitted to the Genebank and the accession number was DQ855425. The similarities of Indian Sahiwal × Holstein Friesian crossbred lysozyme gene sequence with that of B. taurus, human, pig, monkey, gorilla, mice, rat, chicken, dog and sheep (available at the NCBI) were estimated as 99.1%, 85%, 81.0%, 85.2%, 84.3%, 77.9%, 77.9%, 41.4%, 40.5% and 24.6%, respectively.
The amino acid sequence of the Indian Sahiwal × Holstein Friesian crossbred lysozyme was derived from the corresponding nucleotide sequences of the gene. The pre-mature protein was predicted to be consisting of a signal peptide of 19 amino acids and a mature peptide of 129 amino acids. In the pre-mature protein, there were 26 strongly basic amino acids, 10 strongly acidic amino acids, 54 hydrophobic amino acids, 10 polar amino acids and 48 neutral amino acids, whose molecular weight was estimated as 16.8 kDa. The mature protein was composed of 24 strongly basic, 10 strongly acidic, 42 hydrophobic, 41 polar and 12 neutral amino acids with a molecular weight of 14.85 kDa. The isoelectric point and charge of the protein were 9.777 and 13.660 at pH 7.0. Further, the secondary structure of the protein was predicted, which was composed of 39.19% helix, 10.81% total strand and 50% loop. The solvent accessibility was also predicted as 37.84% residues exposed with more than 16% of their surface and 62.16% all others in the protein.
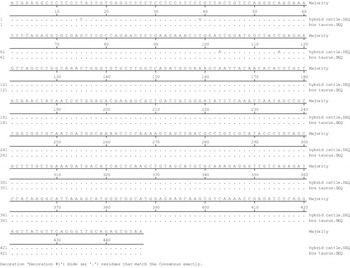
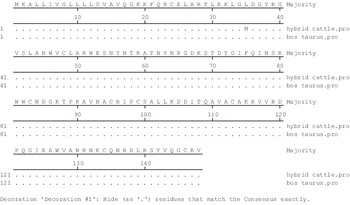
The amino acid sequence of this crossbred cow showed 98.7%, 80.5%, 80.5%, 77.2%, 80.5%, 80.5%, 75.8%, 80.5%, 24.2% and 6.9% identity with that of B. taurus cow, human, pig, monkey, gorilla, mice, rat, chicken, dog and sheep. B. indicus lysozyme sequence was not available in the literature while B. taurus was found at the NCBI data bank, which led us to compare the Indian Sahiwal × Holstein Friesian crossbred sequences with its taurus counterpart to get some idea about the variability of the gene within different groups of cattle. Only four nucleotide changes, namely C15T, G39C, T103A and A115C, were observed between them (Figure 1), of which T103A showed non-synonymous changes depicting Met35Leu in the protein itself (Figure 2).
Nucleotide sequence-based alignment of milk lysozyme gene between hybrid and Bos taurus cattle.

Amino acid sequence-based alignment of milk lysozyme between hybrid and Bos baurus cattle.

SSCP genotypes
For exon1 extended fragment, three alleles, namely A, B and C, and six genotypes, namely, AA, AB, AC, BB, BC and CC, were found in Indian Sahiwal × Holstein Friesian crossbred cattle. The frequencies of A, B and C alleles were found as 0.59, 0.29 and 0.12, while the frequencies of AA, AB, AC, BB, BC and CC genotypes were estimated as 0.27, 0.51, 0.16, 0.01, 0.04 and 0.01, respectively.
For exon2 extended fragment, three alleles, namely P, Q and R, and four genotypes such as PP, PQ, PR, and QQ were documented in the population. But QR and RR genotypes were not found in the crossbred population. However, the frequencies of P, Q and R alleles were 0.61, 0.38 and 0.01, whereas those of PP, PQ, PR and QQ genotypes were found to be 0.23, 0.74, 0.02 and 0.01, respectively.
Allelic variability
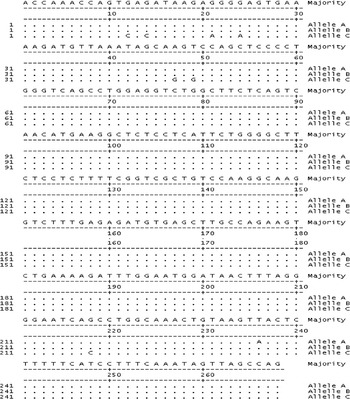
The exon1 extended fragment was composed of 1 to 93 bp promoter, 94 to 228 bp exon1 and 229 to 268 bp partial intron1. The obtained accession numbers for A, B and C allele were DQ855419, DQ855420 and DQ855421, respectively. The percentage similarity study showed that the similarity between alleles A and B was 99.6% whereas that of allele A with allele C was 97.0%. Likewise, similarity of allele B with allele C was estimated as 97.4%. The sequence variabilities among different alleles are depicted in Figure 3. The mutational changes between alleles A and B were found to exist as A236T while allele A was different from allele C by G12C, G14C, G218C, G21A, G24A, A47G, T49G and A236T of which G218C revealed non-synonymous change by serine with threonine. The nucleotide differences between alleles B and C were similar to that of alleles A with C except for A236T.
Allelic alignment of the nucleotide sequence of extended exon1 fragment of milk lysozyme gene.

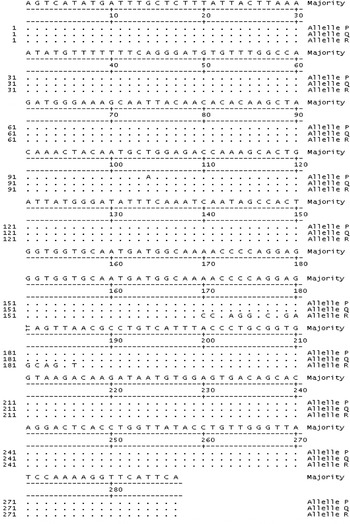
The 287 bp exon2 extended fragment consisted of 1 to 45 bp intron1, 46 to 209 bp exon2 and 210 to 287 bp intron2. The accession numbers of alleles P, Q and R were DQ855422, DQ855423 and DQ855424. The nucleotide similarities of allele P with alleles Q and R were observed as 99.7% and 95.1% while that of allele Q with allele R was calculated as 95.5%. The difference between alleles P and Q was A104T with corresponding amino acid change of glutamine with leucine whereas allele P was found to be different from allele R by a number of changes, of which the non-synonymous types were A104T (glutamine/leucine), A171C (lysine/threonine), C174G (proline/glycine), G177C (glutamine/aspartic acid), G180A (glutamine/glycine), G183A (glutamine acid/glycine) and A186T (leucine/valine). The difference between alleles Q and R was similar to that of alleles P and Q except for A104T (Figure 4).
Allelic alignment of the nucleotide sequence of extended exon2 fragment of milk lysozyme gene.

Haplotype and their frequencies
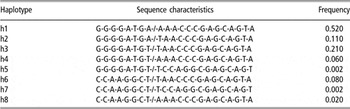
Haplotypes were constructed based on the SNPs identified from SSCP typing and their frequencies are shown in Table 1. A total of eight haplotypes were identified in 250 cows, in which h1 was the most predominant one. Haplotypes h1, h2, h3, h4 and h6 accounted for more than 98% of the genetic information. Out of total 15 haplotype pair combinations, only two homozygous combinations (h1h1 and h2h2) were found in the 250 individuals genotyped from the crossbred population and probably mixing of indicus and taurus populations is the reason for this high degree of heterozygosity.
Haplotypes and their characteristics along with frequencies in Indian Sahiwal × Holstein Friesian crossbred cattle

Association of genotypes with milk production and somatic cell traits
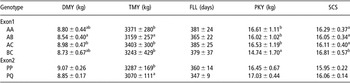
For exon1 extended fragment, the frequencies of BB and CC genotypes were too low (0.01) and hence they have been excluded from the association study. A significant association was determined between genotypes with total milk yield, daily milk yield and peak yield at P < 0.05 (Table 2). AA, AC and BC genotypes showed higher daily milk yield than AB genotypes; since the lactation length was not significantly different among various genotypic groups, AB genotypes produced lower total milk yield than other genotypes. Peak yield was found to be higher in AA, AB and AC genotypes while BC genotypes produced lower yield. Thus, although AB genotypes showed better peak production, its overall performance was lower than other genotypes.
Genotype-wise least-square means of milk production traits in crossbred cattle

TMY = total milk yield; FLL = first lactation length; DMY = daily milk yield; PKY = peak yield; SCS = somatic cell score.
Different superscripts indicate significance at P < 0.05.
In extended exon2 fragment, as the frequencies of PR and QQ genotypes were low (⩽0.02), they have not been included in the analysis. The association study revealed significant correlation between genotypes and total milk yield at P < 0.05 where the performance of PP genotype was found to be approximately 7% higher than PQ genotype.
Genotypes of exon1 extended fragment showed significant association (P < 0.05) with somatic cell score (Table 2). BC genotype showed the highest magnitude compared to other genotypes, indicating the relatively poor milk hygiene of animals. The association between genotypes of extended exon2 fragment and milk somatic cell score was found to be non-significant.
Association of haplotype combinations with milk production and somatic cell traits
Haplotype combinations where the number of individuals was below 15 were not included in the association study. Haplotype combinations were significantly associated with only total lactation milk yield (P < 0.05) while other traits were not associated with these haplotype variations (Table 3). Haplotype pairs, h1h1, h1h2, h1h4 and h1h6 were producing higher milk yield than h1h3 combination. The h1h1 animals had approximately 7% more yield than the lowest producer group (h1h3). Our results suggest that homozygous animals for h1 haplotype, although have low frequency in the population, have better milk yields and may be favored in the farm for augmenting productivity. No significant association was found between haplotype combinations and somatic cell score.
Least-square means ± s.e. under different haplotype combinations

TMY = total milk yield; FLL = first lactation length; DMY = daily milk yield; PKY = peak yield; SCS = somatic cell score. Values within parenthesis are the number of individuals.
Different superscripts indicate significance at P < 0.05.
Discussion
Some authors reported that Indian Sahiwal cattle have natural resistance towards diseases and stress and also survive in hot, humid climate without showing any health problems (Shashikanth and Yadav, Reference Shashikanth and Yadav2005). But, crossing of Sahiwal with exotic cattle like Jersey showed an incidence of mastitis of about 37% (Sharma et al., Reference Sharma, Dhingra, Pander and Kumar2006). Hence, we should look at the probable causal genetic factors affecting mastitis, and lysozyme is one of the factors related to the occurrence of mastitis in cows.
Lysozyme is an anti-bacterial peptide, which plays an immense role in providing immunity to the animals. Earlier studies revealed the significant role of lysozyme in combating mastitis in cows (Schmedt Auf Der Günne et al., Reference Schmedt Auf Der Günne, Tenhagen, Kutzer, Forderung and Heuwieser2002). Enzymatic variability originate from the variability of the base constitution of gene. Thus, exploring gene sequence is important. In addition, comparison between crossbred sequence and taurus and indicus sequences could provide an insight in understanding the role of sequence variability in occurrences of mastitis. The gene sequence in taurus cattle was reported in the literature, while indicus cattle sequence has not been available so far. We have characterized the sequence of Indian Sahiwal × Holstein Friesian cattle where one-half of the genetic materials come from taurus cattle and other half from indicus cattle. The change of gene sequences in our crossbred cattle from its taurus counterpart is probably due to the mixing of populations and segregation with/without recombination of the chromosomal segments over the generations. The crossbred cattle of our study evolved from four generations of inter-se mating, maintaining 50% of Holstein Friesian blood. Thus, this crossbred population is almost stable and develops a new gene pool. In this study, we characterized our crossbred cattle lysozyme sequence. Thus, we can evaluate the diversity of this new synthetic gene pool not only from another cattle population but also from other species. Both nucleotide and amino acid sequences of the crossbred and taurus cattle possessed high homology. Only one functional change was observed between crossbred and taurus cattle and probably the change in crossbred cow was inherited from indicus cattle. The homology with other species was not as much as with cattle, indicating species characteristics and structural as well as biological significance of the protein in the respective species. Due to some changes in protein sequences between the crossbred cattle with other species including taurus cattle, the predicted secondary structure of the mature protein and some of its properties varied between animals, and in case of the crossbred cattle, the variation may be attributed to the mixing of B. indicus and B. taurus genetics. But their actual organizational properties may be verified by the three-dimensional (3D) analysis of the protein.
Structurally, lysozyme consists of four regions: (a) 1 to 39, (b) 40 to 85, (c) 86 to 100 and (d) 101 to 129 (Nguyen-Huu et al., Reference Nguyen-Huu, Stratmann, Groner, Wurtz, Land, Giesecke, Sippel and Schutz1979). A deep crevice containing the deep active site divides the molecule into two halves: on one side are the β-structured (b) fragments, whereas on the other side are the (a) N-terminal and (d) C-terminal helical fragments. Fragment (c) with an alpha helix joins the two halves. Exon2 codes for a region that includes the catalytic center of the enzyme with Glu-35 and Asp-52, the surrounding functionally important elements from both sides of the crevice and part of the substrate-binding site and thus, exon2 function as a primitive glycosidase (Nguyen-Huu et al., Reference Nguyen-Huu, Stratmann, Groner, Wurtz, Land, Giesecke, Sippel and Schutz1979). Exon3 codes for a fragment that, combined with the exon2 region, completes the active site and could give additional substrate specificity and catalytic efficiency. Exon1 codes for the translational signal sequence on the mRNA, for the N- and C-terminal regions of the enzyme. Thus, exons 1 and 2 have been the hot spot region for the functioning of this enzyme in the specific site of the organ/tissues. The amino acid difference found in the exon1 region between our crossbred and taurus cattle may be responsible for part of the functional diversity between those populations.
The genotypes of extended exon1 fragment showed significant association with milk yield traits as well as somatic cell score. AA, AC and BC genotypes produced higher milk yield with lower somatic cell score. On the contrary, extended exon2 genotypes showed significant association with only total milk production. Furthermore, haplotype combinations having significant association with total milk production and h1h1 animals were also better producers. Thus, the superiority of these genotypes/haplotypes in the farm could have a certain role in the higher production of clean milk. Our study suggests that milk lysozyme may be a good indicator in the selection for both quantity and hygiene of milk.
Acknowledgments
The authors are thankful to the ICAR for providing financial support to carry out research works under the ICAR ad-hoc scheme.