Breast cancer is a complex condition characterised by uncontrolled growth of abnormal cells in the breast, which can form a tumour that invades other tissues(1). Currently, breast neoplasm represents a major health concern, as it is the second highest global incidence of cancer, accounting for 11·5 % of all cancer cases. It is also the fourth leading cause of cancer mortality, behind lung, colorectal and liver cancers(Reference Ferlay, Ervik and Lam2).
Risk factors for breast cancer include non-modifiable elements, such as genetic mutations, as well as lifestyle-related exposures that may be modifiable(Reference De Cicco, Catani and Gasperi3). In this context, cancer prevention strategies are proving to be essential to alleviate this public health problem, since 30–50 % of cancer cases can be avoided by adopting a healthy lifestyle(4).
A healthy diet rich in fruits, vegetables, whole grains and legumes is a significant source of bioactive compounds. These substances, which include polyphenols, have biological effects on the human body, mainly by modulating genes and cell receptors. For breast cancer, their effects extend to reducing tumour cell proliferation, inducing apoptosis, suppressing angiogenesis and reducing the migratory properties of cancer cells, consequently reducing the risk of metastasis(Reference Bhattacharya, Dutta and Akter5).
In addition, a possible synergistic relationship between bioactive compounds and chemotherapy or radiotherapy treatments has been demonstrated, by increasing their therapeutic effect and reducing their side effects(Reference Li, Li and Meng6). In this context, polyphenols have stood out for their potential to block the synthesis of pro-inflammatory cytokines, modulate kinases and transcription factors involved in tumor progression and their well-known antioxidant capacity(Reference Braakhuis, Campion and Bishop7). However, more studies are needed to prove the relationship between polyphenols and breast cancer prognosis(4). Given the above, this study aims to evaluate the association between polyphenol intake and mortality, survival and recurrence in women with breast cancer.
Methods
Study design and population
This is a longitudinal, observational and analytical study. The sample size calculation for this cohort was performed in OpenEpi®, applying the formula for cohort studies(Reference Kelsey, Whittemore and Evans8). A confidence level of 5 % and study power of 80 % were considered, and the expected proportions of the outcome between exposed and unexposed individuals were obtained from a similar cohort study in the breast cancer literature(Reference Taguchi, Kishimoto and Fukushima9), resulting in a sample size of eighty women. The study used a database containing information from two different periods. The first period, called Phase 1, covers the years 2006–2008 when pre-surgery interviews were carried out with all the women who were suspected of having breast cancer.
The second period, called Phase 2, covered the years 2020–2021 and focused on collecting data related to mortality and recurrence. The sampling process was carried out by convenience with women admitted for surgical treatment of breast cancer, in a referral hospital in southern Brazil, between October 2006 and June 2008(Reference Vieira10).
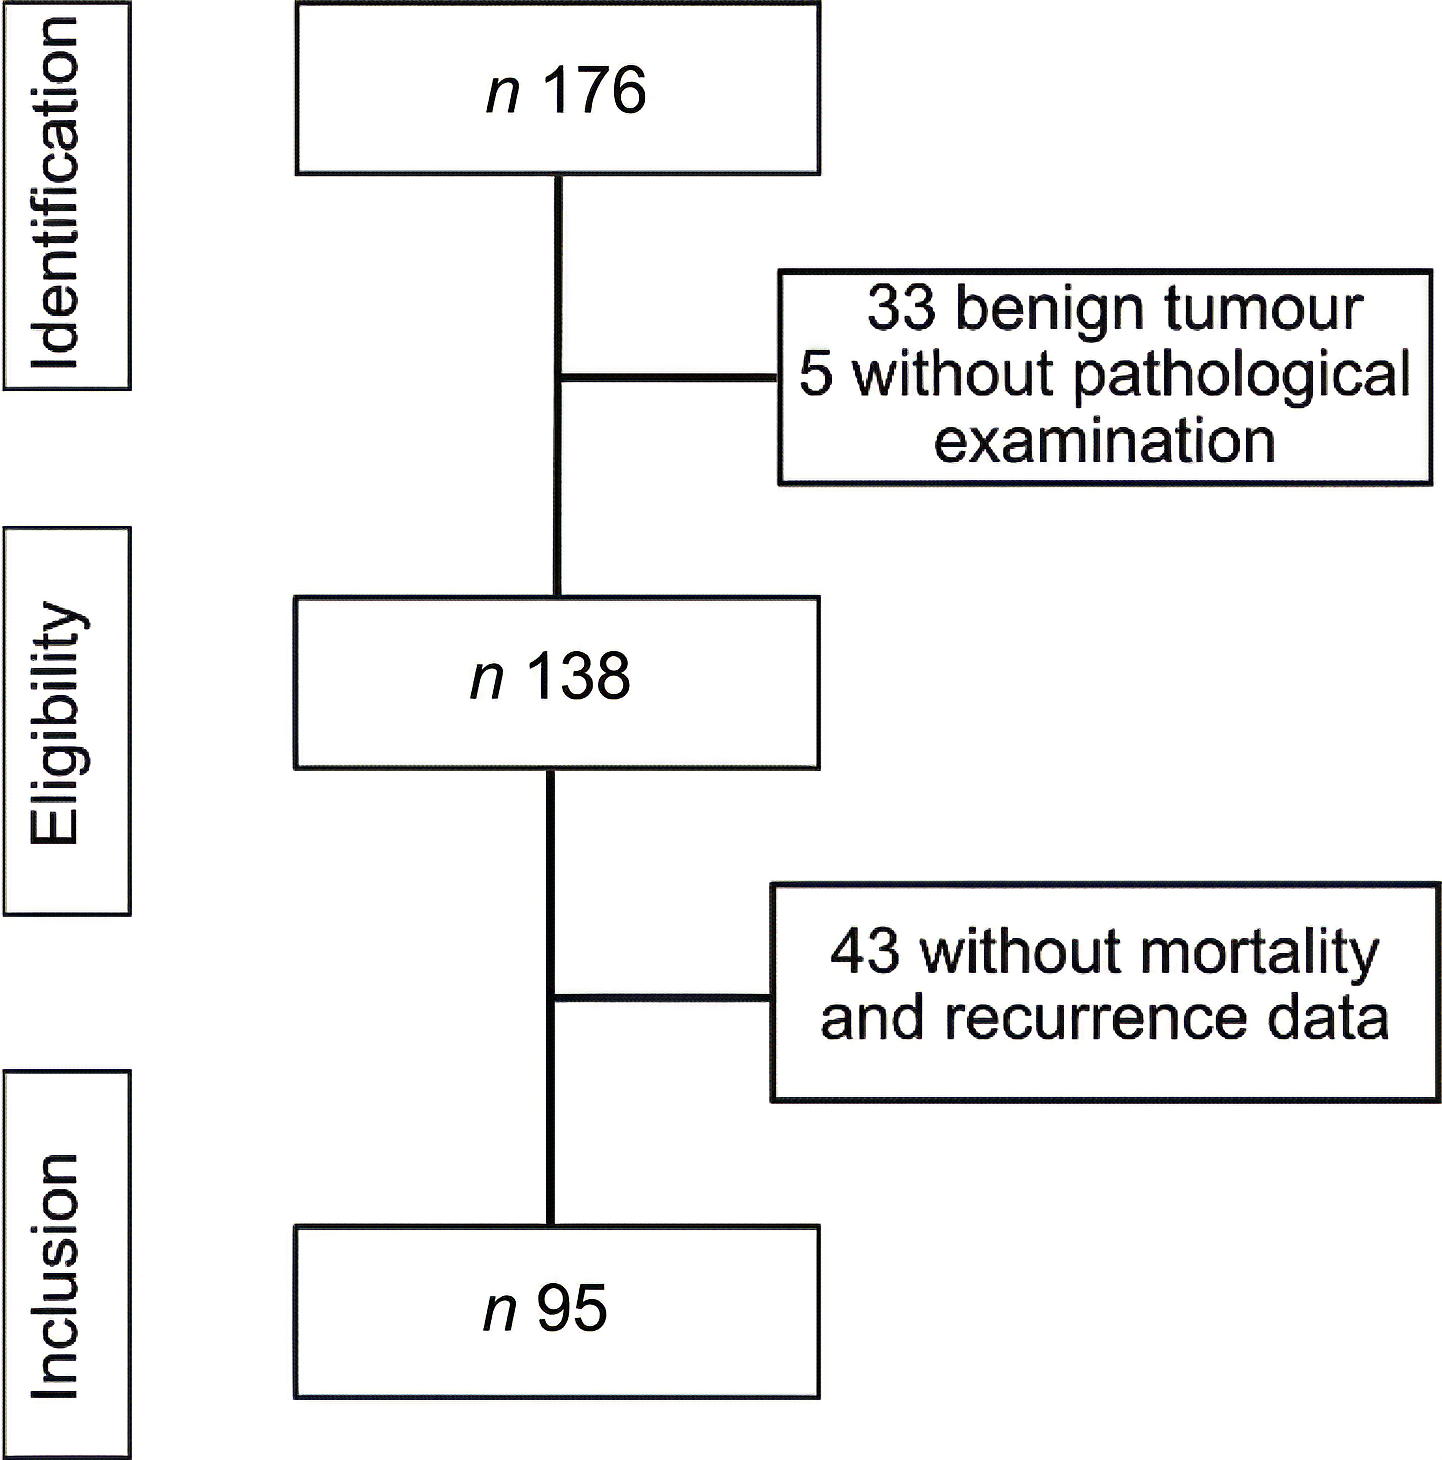
The sample included participants whose breast cancer had been confirmed by anatomopathological examination and who had all the information on food consumption, mortality and recurrence data. Exclusion criteria were previous history of cancer, surgical procedure performed up to one year before the study, tumour classified as benign, pregnancy and lactation, presence of human immunodeficiency virus (HIV+) and neoadjuvant therapy before data collection(Reference Vieira10). The final sample size, with the appropriate exclusions, is shown in Figure 1. To participate in the study, all the women were given the necessary guidance to understand the research protocol. They were instructed to fill in the Informed Consent Form in both study phases.
Sample size flow chart to investigate the association between polyphenol intake and breast cancer mortality, survival and recurrence.

Socio-demographic, clinical and anthropometric data
Data were collected through the application of a questionnaire containing identification data, patient’s clinical and reproductive history, socio-demographic data, physical activity, smoking, alcohol consumption, family history of neoplasia and anthropometric data, including information on body weight and height(Reference Vieira10). At the end of these measurements, BMI was calculated.
The evaluation of current physical activity was conducted at baseline. Participants were asked about the frequency, duration and type of physical exercise they regularly engaged in. Based on these reports, individuals were classified according to the recommendations of the US Physical Activity Guidelines(11). The TNM system, proposed by the International Union Against Cancer(12), was used to classify the staging of the disease. This system takes into account anatomical factors such as tumour location and size (T), lymph node involvement (N) and the presence of metastasis (M).
Food consumption
Data on food consumption were collected using a FFQ validated for the Brazilian population(Reference Sichieri and Everhart13) and adapted to regional eating habits(Reference Vieira10). The adaptations made to the FFQ included breakfast cereals, oilseeds, honey, jam, lard, cream, artificial juice, tea, mate, persimmon, strawberry and kiwi. The FFQ food list included 112 items, such as pastries, legumes, milk and dairy products, meat and eggs, fruit, vegetables, oils and fats, sweets and desserts, non-alcoholic drinks and alcoholic drinks. To determine habitual consumption over the last 12 months, the consumption frequencies from the FFQ were converted into daily frequency. The quantitative analysis of consumption was carried out by multiplying the daily frequencies in grams or milliliters, giving the daily quantitative consumption of each food(Reference Vieira10).
Microsoft Excel® was used to calculate energy intake (kcal), based on the composition values from the Brazilian Food Composition Table (TACO)(14) and the food composition table from the USA Department of Agriculture(15).
Polyphenol intake
The Phenol-Explorer® database (http://phenol-explorer.eu/) was used to quantify polyphenol intake. Individual polyphenol values (in mg/100 g of food) were obtained for each FFQ item. In accordance with the methodological approach adopted by Gardeazabal et al. (2019) for most phenolic compounds, values determined by HPLC were selected, as this method provides greater specificity for individual polyphenol quantification. In the case of lignans, values obtained through chromatography after hydrolysis were prioritized, since hydrolysis is required to release their aglycone forms and enable accurate measurement(Reference Gardeazabal, Romanos-Nanclares and Martínez-González16). For food items that were not included in the Phenol-Explorer® database, individual studies quantifying and characterising the polyphenols in these foods were used(Reference Shukla, Kushwaha and Singh17–Reference Nesovic, Gasic and Tosti21). When the scientific article quantified more than one species of the same food, an average of the values found was used. If these data were not found in the articles, the choice was based on certain criteria such as the same botanical group or similarity of nutritional composition according to the Brazilian TACO(14), using the food with the greatest similarity.
Foods of animal origin, as well as those whose polyphenol content was not quantified in Phenol-Explorer, scientific articles or similar food categories, were excluded from the analysis. This resulted in a total of sixty-nine FFQ items for quantification. For the FFQ items that combined multiple foods, we calculated the average polyphenol values when available or selected the most consumed food by the study population. In cases of culinary preparations with multiple ingredients, we analysed each component individually and calculated the polyphenol content based on the percentage contribution of each ingredient to the final product, using preparation technical sheets for support.
For foods typically consumed in their cooked form, the retention factor, available at <https://phenol-explorer.eu/food-processing/foods>, was applied. For those foods where retention data by processing were not available, no retention factor value was applied due to the high specificity of this index for the compound, food and preparation. The use of retention factors for other foods or compounds is not indicated(Reference Rothwell, Perez-Jimenez and Neveu22). Therefore, to minimise the overestimation of polyphenols due to the use of raw food values, the cooking index was applied to foods where retention factor values were not available(Reference Ornellas23,Reference Dos Santos and Basso24) .
To quantify total polyphenol consumption, more than 400 individual compounds were calculated per 100 grams of each food item. These compounds were then categorised according to their polyphenol classes (flavonoids, lignans, phenolic acids, stilbenes and other polyphenols) and summed by individual compounds of each class. Subsequently, the values for each class were combined to determine the total polyphenol content for each food item. This total was then multiplied by the amount consumed by each participant.
Mortality and recurrence data
Mortality and recurrence data were collected between 2020 and 2021 by searching physical and electronic medical records and the medical archive and statistics service of an oncology research institution. If this information was not available in the medical records, telephone calls were made, interviewing the participants themselves or family members in cases of death. In addition, if necessary, the Municipal Health Departments of the city where the patient came from were consulted, as well as the Health Center where the patient was affiliated and the health institution where the recurrence treatment was carried out(Reference Schroeder25).
Mortality was classified as: all-cause mortality or breast cancer-specific mortality, with or without metastasis and/or other comorbidities(Reference Heitz, Baumgartner and Baumgartner26). Recurrence was considered when the cancer returned locoregionally or metastasized within 10 years of the date of the first diagnosis. Survival time considered the interval between the date of the first diagnosis of breast cancer and the date of death or the final date of data collection for participants who did not die(Reference Schroeder25).
Statistical analysis
The qualitative variables were organised in tables displaying both absolute and percentage values for each variable. For the quantitative variables, we assessed data normality using the Shapiro–Wilk test, Skewness-Kurtosis measures and histograms. Based on the symmetry of the distribution, we described the values as mean and standard deviation or median and interquartile range. Pearson’s χ 2 test, t test or Mann–Whitney test were applied to assess heterogeneity. To evaluate the association between polyphenol intake and mortality or recurrence, we employed Cox regression models for total polyphenols, phenolic acids, lignans, flavonoids, stilbens and other polyphenols. To establish the intake groups, the sample was divided into tertiles. The medium and high intake tertiles were combined to form a single medium/high intake group. The hazard ratio (HR) values were then calculated. To establish the intake groups, because of the number of participants, the population was divided into tertiles with the medium and high intake tertiles combined to form a single medium/high intake group. The models were adjusted for confounding variables chosen based on a review of the existing literature and other established prognostic predictors.
Following the methodology of previous studies on the same topic(Reference Gardeazabal, Romanos-Nanclares and Martínez-González16,Reference Morimoto, Maskarinec and Park27,Reference Wang, Gapstur and Gaudet28) , the basic model (or model 1) was adjusted for age, marital status, years of schooling, presence of comorbidities, level of physical activity and smoking. In the second model, the following variables were added: degree of cancer staging (at first diagnosis), contraceptive use, menopause status, age at first menstruation, body mass index and energy intake. Finally, the third model also included the variable of alcohol consumption.
To confirm the hypothesis of proportional hazards in the Cox model, a graphical analysis was conducted to assess the parallelism of the curves for the three adjusted regression models. This approach demonstrated that the assumptions were satisfied in all models. For the survival analyses, Kaplan–Meier curves were generated, and significance was evaluated using the log-rank test. A 95 % CI and a significance level of P < 0·05 were applied to all statistical analyses. The analyses were performed using Stata® version 14.1 statistical software (StataCorp LP).
Results
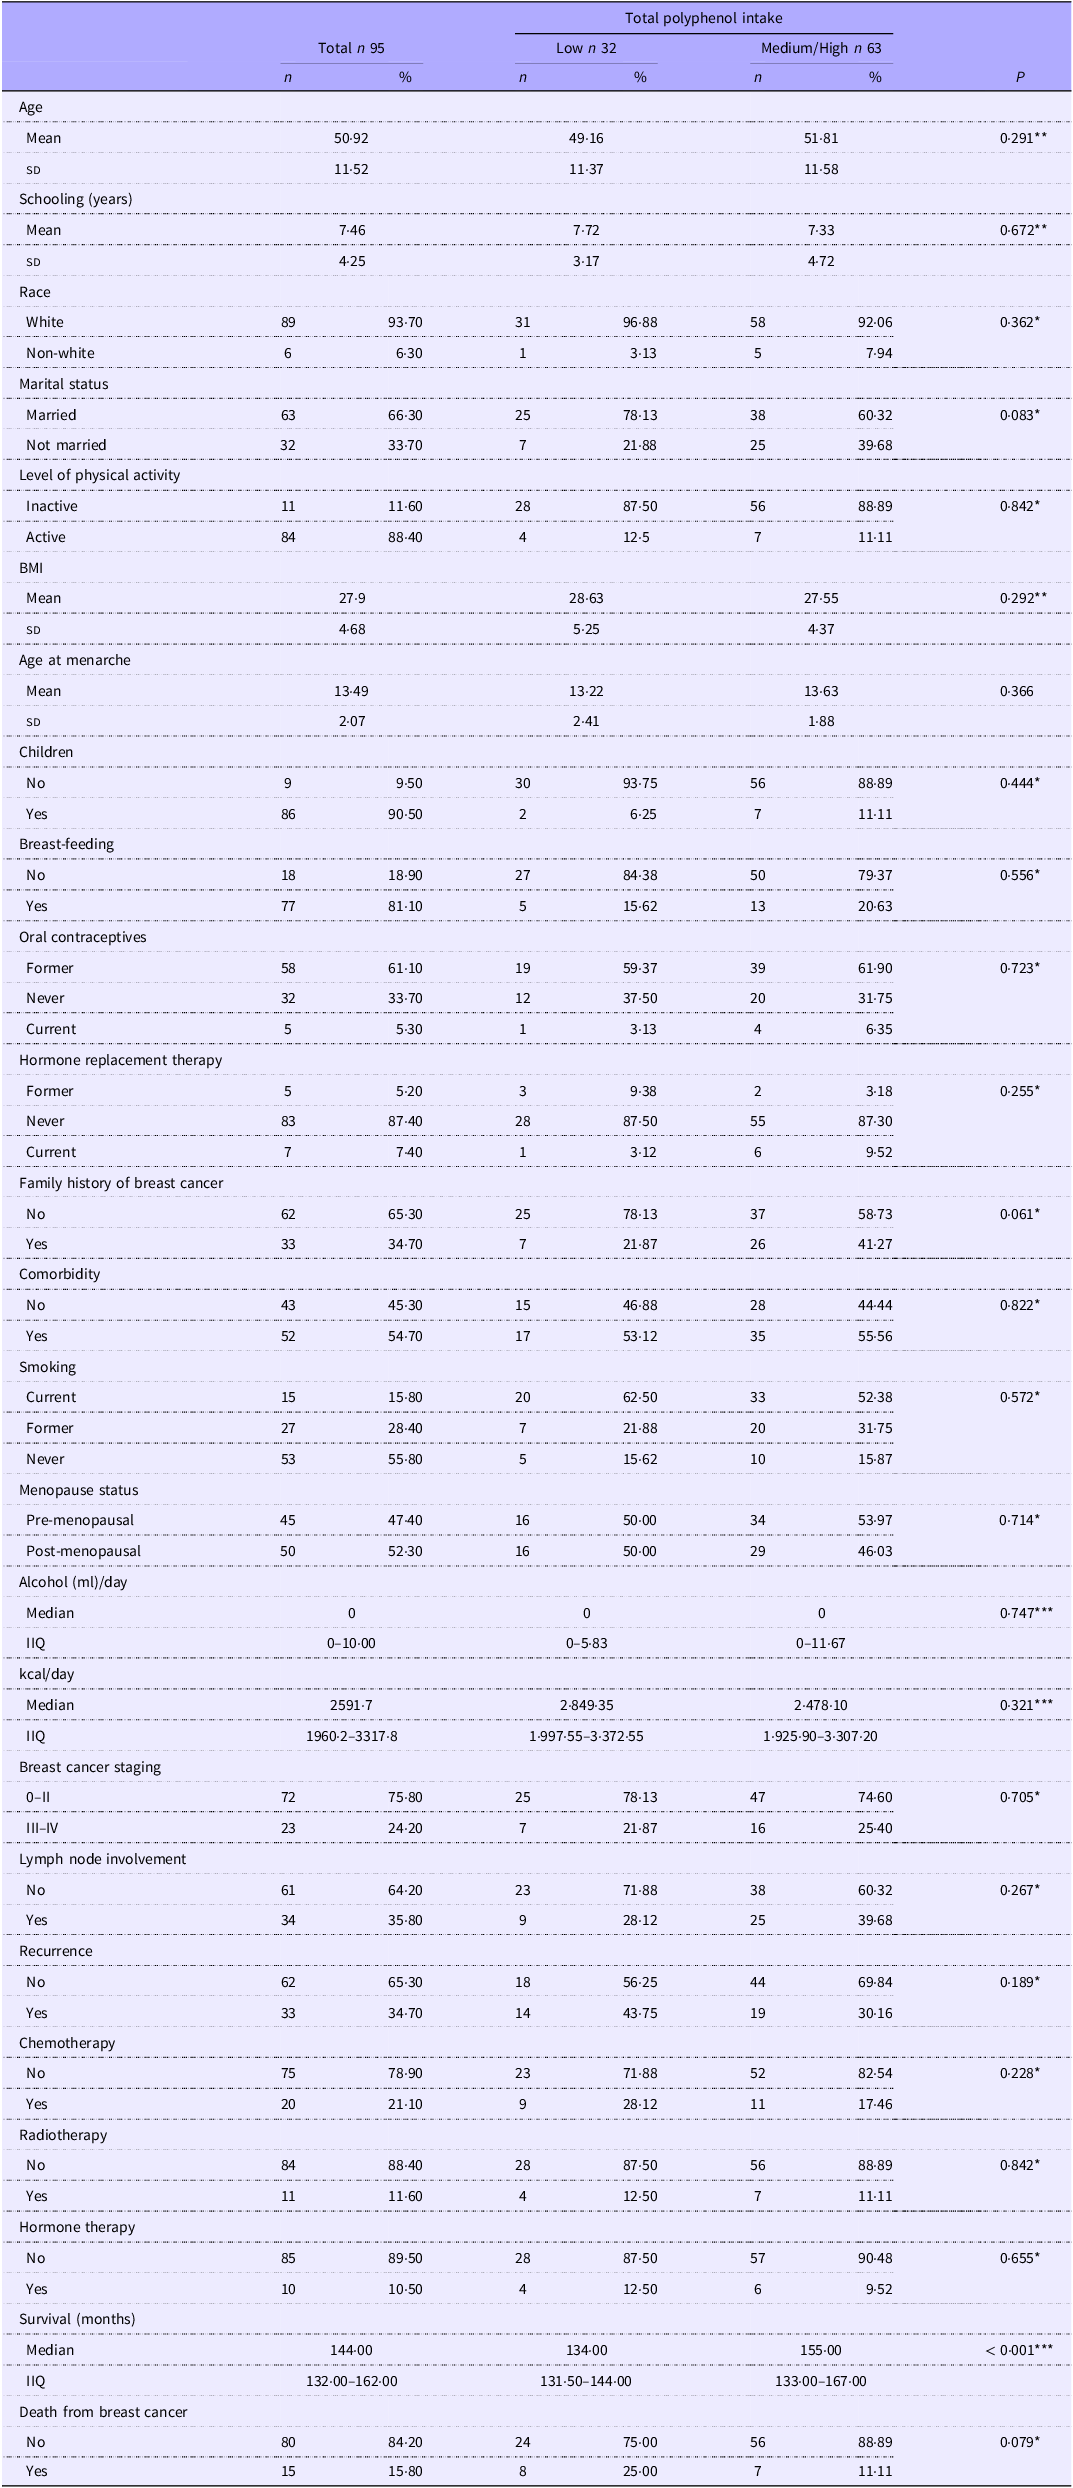
After selecting the sample, ninety-five women were followed up from the date of diagnosis until the date of death or end date of the study, for an average of 11·5 years. On baseline, the mean age of the women in the study was 50·9 years, and the median intake of total polyphenols was 179·1 mg per day. During the follow-up period, fifteen women (15·8 %) died from breast cancer-specific causes and thirty-three had a recurrence of the disease (33·4 %).
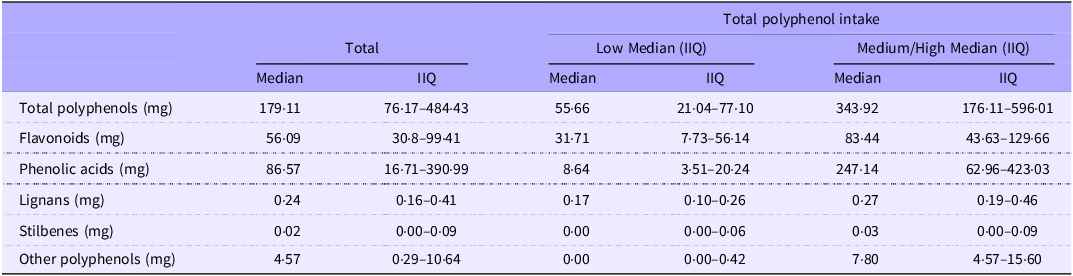
Table 1 shows the socio-demographic and clinical characteristics of the women in the study according to their intake of total polyphenols, which showed no significant differences between groups, except for survival time. In the sample, 52·3 % of the participants were post-menopausal, 54·7 % had some associated comorbidity and 34·7 % had a family history of breast cancer. Table 2 shows the median intakes of total polyphenols and their respective classes. In the low intake group, the median intake of total polyphenols was 55·7 (21·0–77·1) mg, while in the medium/high intake group, the median value was 343·9 (176·1–576·0) mg (P < 0·001). Except for the Stilbenes polyphenol class (P = 0·0070), in all the other classes, the median value of the medium/high intake group was significantly higher than that of the low intake group.
Socio-demographic and clinical characteristics of the participants according to total polyphenol intake (continued)

Table 1. Long description
The table presents socio-demographic and clinical characteristics of women in a study, categorized by their intake of total polyphenols. It includes data on age, schooling, race, marital status, level of physical activity, age at menarche, number of children, breastfeeding history, oral contraceptive use, hormone replacement therapy, family history of breast cancer, comorbidity, smoking status, menopause status, alcohol intake, IQOL, breast cancer staging, lymph node involvement, recurrence, chemotherapy, radiotherapy, hormone therapy, and survival time. The table is divided into columns for total sample, low polyphenol intake, and medium/high polyphenol intake, with corresponding percentages and p-values indicating statistical significance. Each row provides specific data points for the categories mentioned.
*χ 2; **t test; *** Mann–Whitney; n, absolute frequency; %, relative frequency; Low intake = Tercile 1/High and medium intake = Tercile 2 and Tercile 3/IIQ, interquartile range = Percentile25–Percentile75.
Characterization of polyphenol classes and subclasses in the total sample and according to total polyphenol intake groups

Table 2. Long description
A table comparing polyphenol intake across different groups. The table has 6 rows and 6 columns. The columns are labeled Total, Low Median (IIQ), and Medium/High Median (IIQ), each with Median and IIQ sub-columns. The rows are labeled Total polyphenols (mg), Flavonoids (mg), Phenolic acids (mg), Lignans (mg), Stilbenes (mg), and Other polyphenols (mg). Each row provides median and IIQ values for total polyphenol intake, flavonoids, phenolic acids, lignans, stilbenes, and other polyphenols across the different intake groups.
Low intake = Tercile 1/High and medium intake = Tercile 2 and Tercile 3/IIQ = Percentile25–Percentile75.
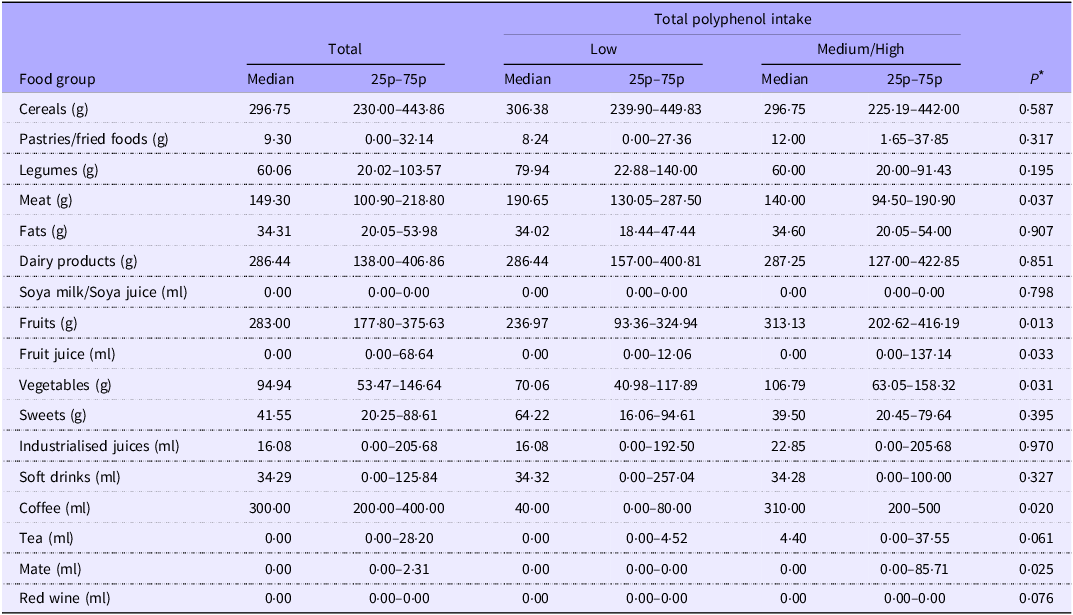
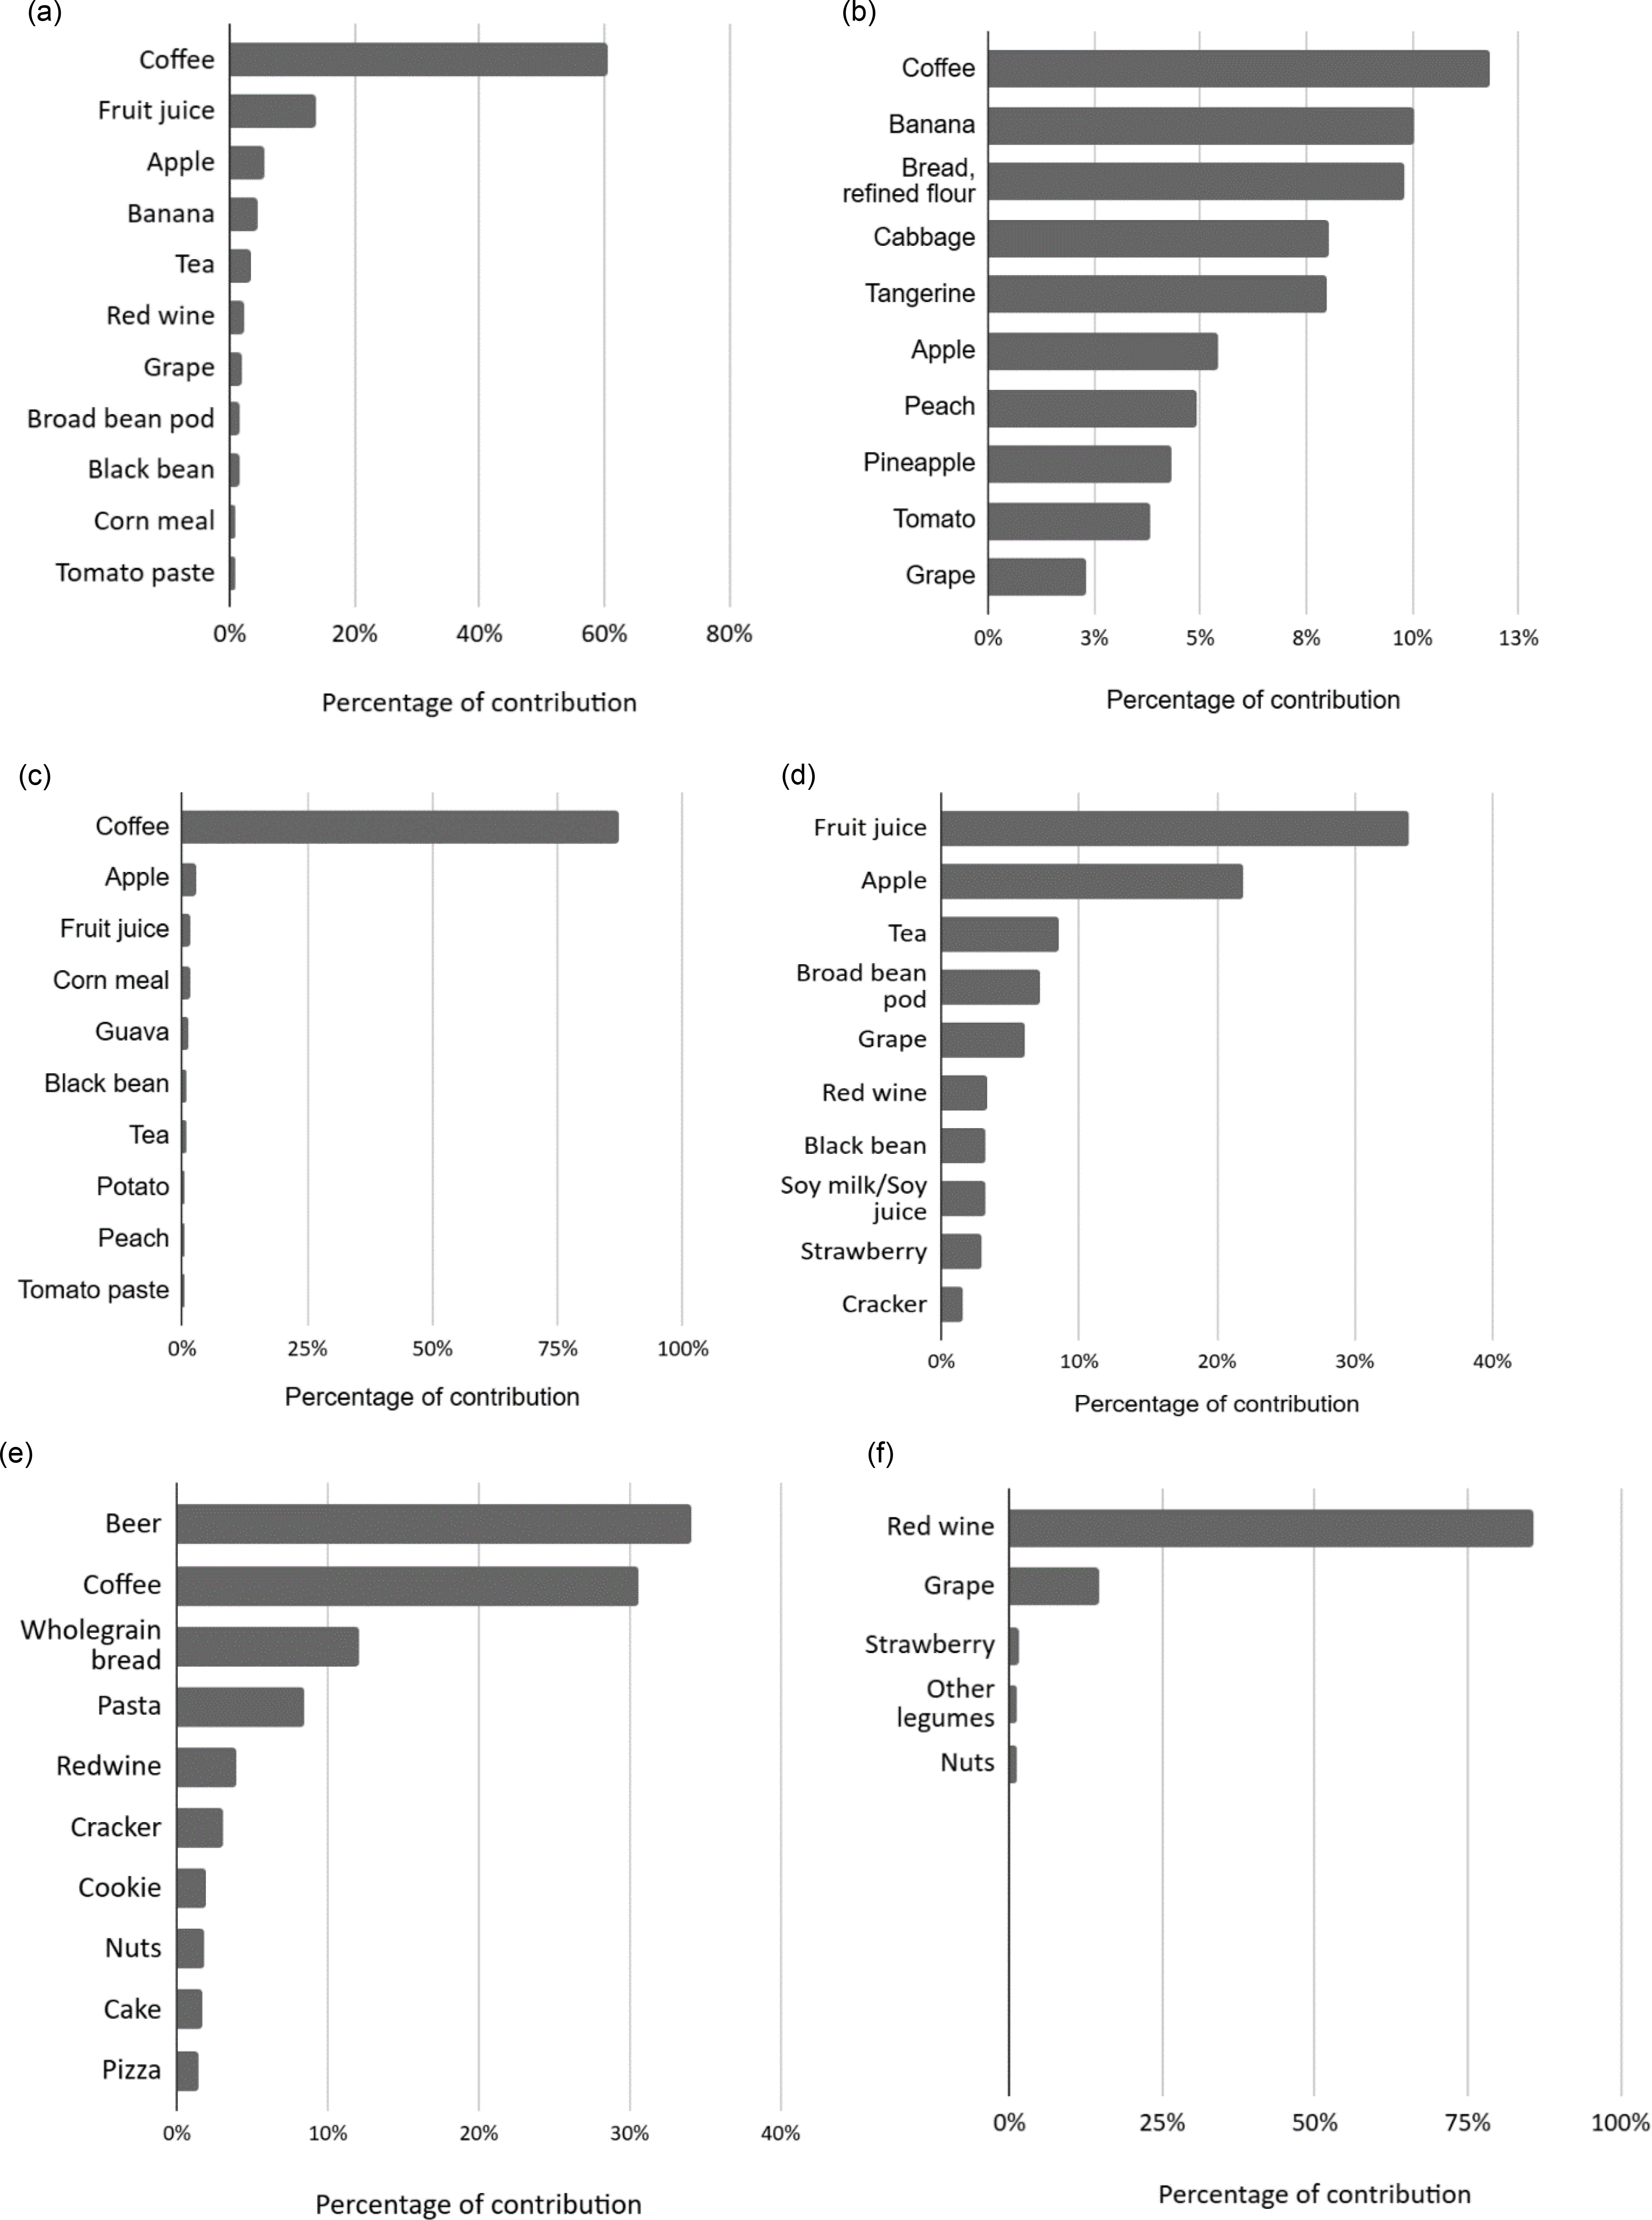
The class that contributed most to the intake of total polyphenols by the women in the study was phenolic acids, followed by flavonoids, other polyphenols, lignans and stilbenes (Table 2). Table 3 details the consumption of each food group, in grams, according to total polyphenol intake. It was observed that women with a higher intake of total polyphenols had a higher intake of fruit, fruit juices, vegetables, coffee and mate, as well as a lower intake of meat. Figure 2 shows the foods that contributed the most to the study participant’s intake of polyphenols, highlighting those that were the main sources of each class. Coffee was the food that contributed most to total polyphenol intake, followed by fruit juice, apples, bananas, tea and red wine.
Daily intake of food groups in the total sample and according to total polyphenol intake groups

Table 3. Long description
The table presents the daily intake of various food groups categorized by total polyphenol intake levels. It includes data for total intake, low intake, and medium/high intake groups. The table has 18 rows and 7 columns. Column headers are Food group, Total Median, Total 25p-75p, Low Median, Low 25p-75p, Medium/High Median, Medium/High 25p-75p, and P value. Row labels include different food groups such as Cereals, Pastries/fried foods, Legumes, Meat, Fats, Dairy products, Soya milk/Soya juice, Fruits, Fruit juice, Vegetables, Sweets, Industrialised juices, Soft drinks, Coffee, Tea, Mate, and Red wine. Each row provides median and 25th-75th percentile values for the daily intake of each food group in grams or milliliters, depending on the food type. The table also includes P values to indicate statistical significance.
* Mann–Whitney.
Foods with the highest contribution to polyphenol intake. Panel A: Total polyphenols. Panel B: Lignans. Panel C: Phenolic acids. Panel D: Flavonoids. Panel E: Others polyphenols. Panel F: Stilbenes.

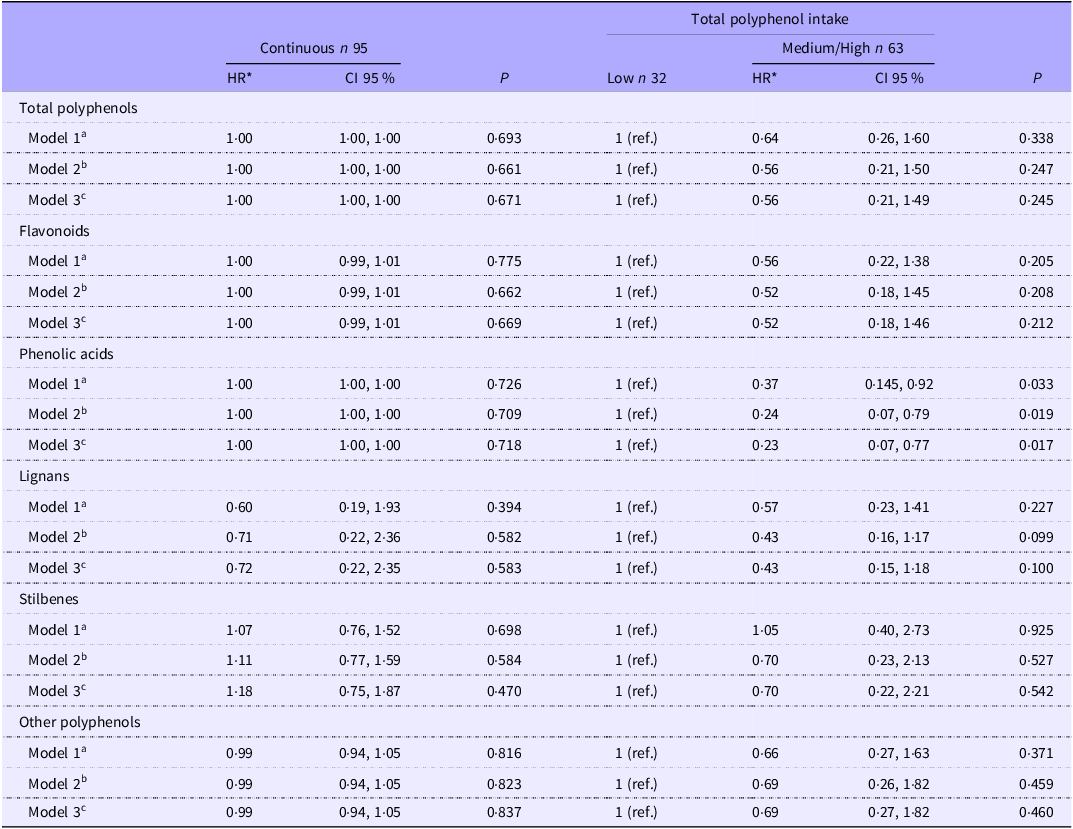
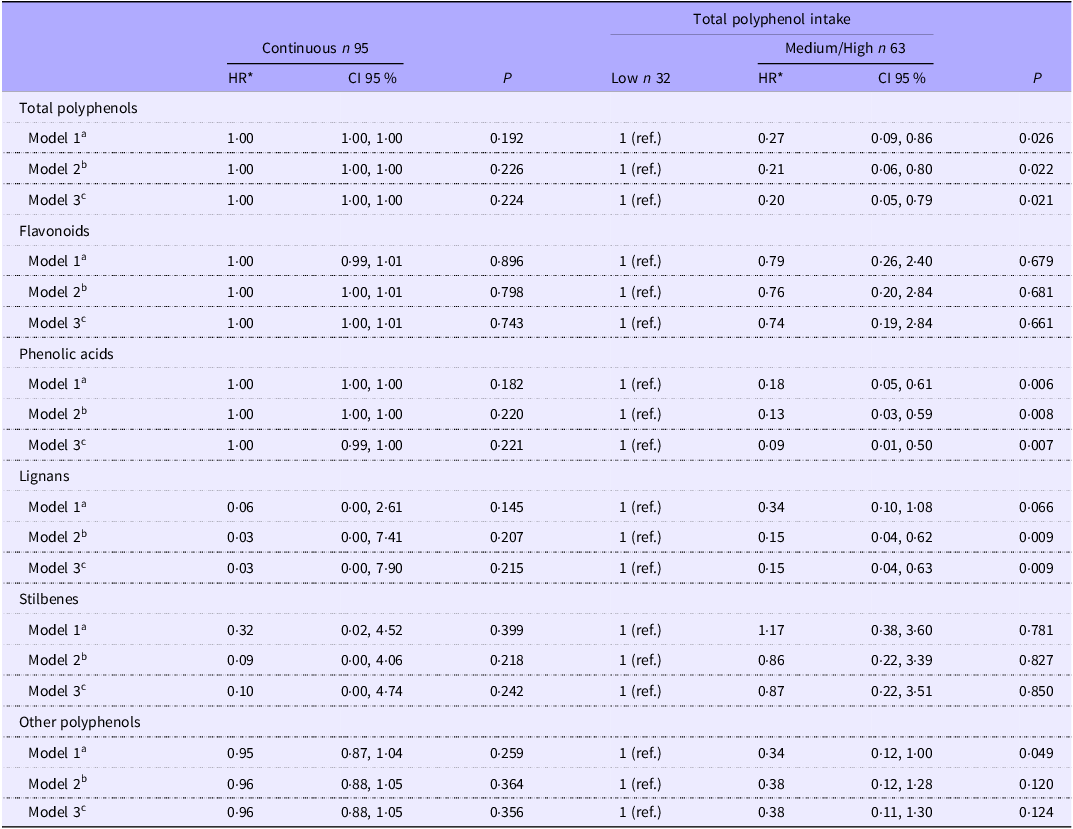
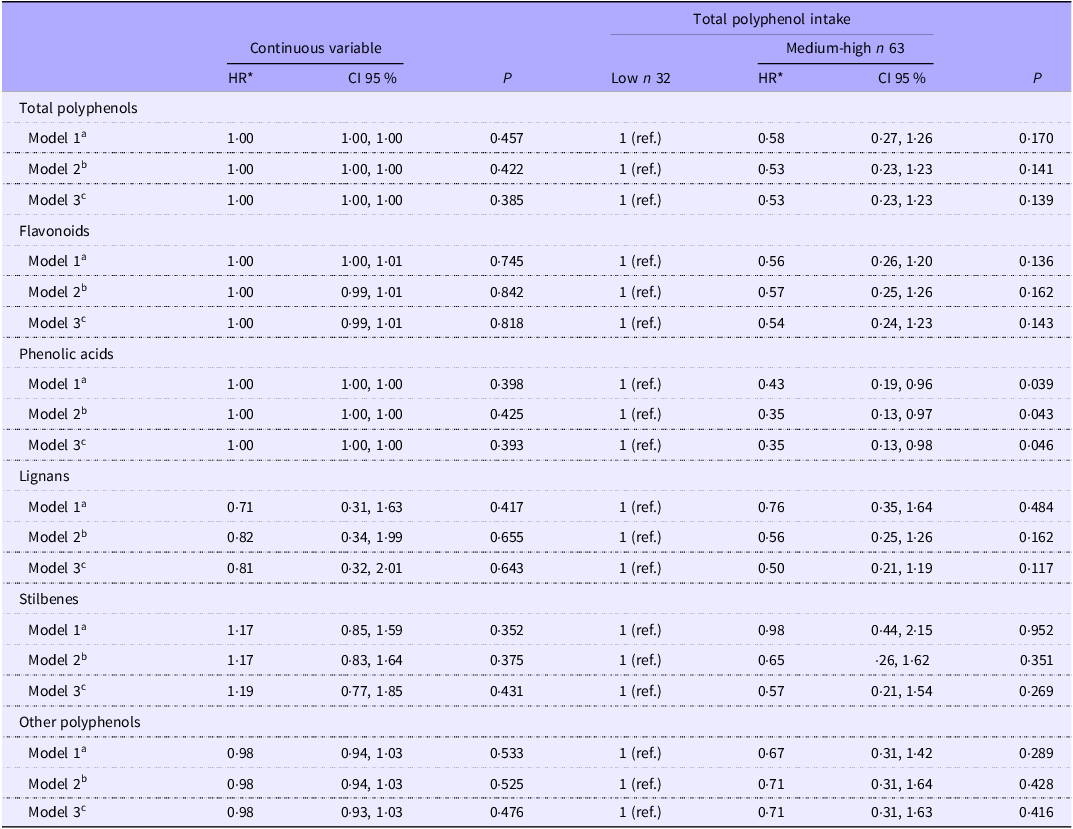
Tables 4 and 5 show the HR values for the associations between total polyphenols intake and its classes with all-cause mortality and breast cancer-specific mortality. A significantly inverse association was found between total polyphenol intake and the risk of breast cancer-specific mortality (HR = 0·20, 95 % CI (0·05, 0·80)). When the polyphenol classes were analyzed, inverse associations were observed between the intake of phenolic acids and lignans and breast cancer-specific mortality (HR = 0·09, 95 % CI (0·01, 0·50); HR = 0·15, 95 % CI (0·04, 0·63)). Therefore, the consumption of phenolic acids showed an inverse association for breast cancer recurrence (HR = 0·35, 95 % CI (0·13, 0·98)) and all-cause mortality (HR = 0·23, 95 % CI (0·07, 0·77)) (Table 6).
Associations between all-cause mortality and intake of total polyphenols and their classes

Table 4. Long description
The table presents hazard ratios (HR) and confidence intervals (CI) for the associations between total polyphenol intake and its classes with all-cause mortality and breast cancer-specific mortality. It includes data for continuous intake and low versus medium/high intake categories. The table is divided into sections for total polyphenols, flavonoids, phenolic acids, lignans, stilbenes, and other polyphenols. Each section includes three models with different adjustments. The table has 95 rows and 12 columns. Column headers include Continuous n 95, HR, CI 95 percent, P, Low n 32, Medium/High n 63, HR, CI 95 percent, and P. Row labels include Total polyphenols, Flavonoids, Phenolic acids, Lignans, Stilbenes, and Other polyphenols, each with three models (Model 1, Model 2, Model 3). The values in the table represent hazard ratios and confidence intervals for different models and intake categories.
*Hazard ratio; aCox regression adjusted for age, marital status, smoking, level of physical activity, years of schooling, presence of comorbidities; bCox regression with all the adjustments in model 1 and additional adjustment for contraceptive use, tumour stage, menopause status, age at first menarche, BMI, calorie intake; cCox regression with all the adjustments in model 2 and additional adjustment for alcohol intake.
Low intake = Tercile 1/High and medium intake = Tercile 2 and Tercile 3.
Associations between breast cancer mortality and intake of total polyphenols and their classes

Table 5. Long description
The table presents data on the associations between breast cancer mortality and the intake of total polyphenols and their classes. It is divided into two main sections: Continuous intake and Medium/High intake. Each section is further divided into models 1, 2, and 3 for different polyphenol classes: Total polyphenols, Flavonoids, Phenolic acids, Lignans, Stilbenes, and Other polyphenols. The table includes columns for Hazard Ratio (HR), Confidence Interval (CI) 95 percent, and P-value. Each row provides specific HR values, CI ranges, and P-values for the different models and polyphenol classes. Notable trends include significant inverse associations between total polyphenol intake and breast cancer-specific mortality, as well as inverse associations for phenolic acids and lignans with breast cancer-specific mortality.
*Hazard Ratio; aCox regression adjusted for age, marital status, smoking, level of physical activity, years of schooling, presence of comorbidities; bCox regression with all the adjustments in model 1 and additional adjustment for contraceptive use, tumour stage, menopause status, age at first menarche, BMI, calorie intake; cCox regression with all the adjustments in model 2 and additional adjustment for alcohol intake.
Low intake = Tercile 1/High and medium intake = Tercile 2 and Tercile 3.
Associations between breast cancer recurrence and intake of total polyphenols and their classes

Table 6. Long description
The table presents hazard ratios (HR) and 95% confidence intervals (CI) for the associations between total polyphenol intake and its classes with all-cause mortality and breast cancer-specific mortality. It includes data for continuous variables and categorized intake levels (Low and Medium-high). The table is divided into sections for Total polyphenols, Flavonoids, Phenolic acids, Lignans, Stilbenes, and Other polyphenols. Each section contains three models (Model 1, Model 2, Model 3) with corresponding HR, CI 95%, and P-values. The table has 6 rows and 12 columns. Row 1: Total polyphenols, Model 1, HR 1.00, CI 95% 1.00, 1.00, P 0.457, Low n 32, HR 1 (ref.), Medium-high n 63, HR 0.58, CI 95% 0.27, 1.26, P 0.170. Row 2: Total polyphenols, Model 2, HR 1.00, CI 95% 1.00, 1.00, P 0.422, Low n 32, HR 1 (ref.), Medium-high n 63, HR 0.53, CI 95% 0.23, 1.23, P 0.141. Row 3: Total polyphenols, Model 3, HR 1.00, CI 95% 1.00, 1.00, P 0.385, Low n 32, HR 1 (ref.), Medium-high n 63, HR 0.53, CI 95% 0.23, 1.23, P 0.139. Row 4: Flavonoids, Model 1, HR 1.00, CI 95% 1.00, 1.01, P 0.745, Low n 32, HR 1 (ref.), Medium-high n 63, HR 0.56, CI 95% 0.26, 1.20, P 0.136. Row 5: Flavonoids, Model 2, HR 1.00, CI 95% 0.99, 1.01, P 0.842, Low n 32, HR 1 (ref.), Medium-high n 63, HR 0.57, CI 95% 0.25, 1.26, P 0.162. Row 6: Flavonoids, Model 3, HR 1.00, CI 95% 0.99, 1.01, P 0.818, Low n 32, HR 1 (ref.), Medium-high n 63, HR 0.54, CI 95% 0.24, 1.23, P 0.143. Row 7: Phenolic acids, Model 1, HR 1.00, CI 95% 1.00, 1.00, P 0.398, Low n 32, HR 1 (ref.), Medium-high n 63, HR 0.43, CI 95% 0.19, 0.96, P 0.039. Row 8: Phenolic acids, Model 2, HR 1.00, CI 95% 1.00, 1.00, P 0.425, Low n 32, HR 1 (ref.), Medium-high n 63, HR 0.35, CI 95% 0.13, 0.97, P 0.043. Row 9: Phenolic acids, Model 3, HR 1.00, CI 95% 1.00, 1.00, P 0.393, Low n 32, HR 1 (ref.), Medium-high n 63, HR 0.35, CI 95% 0.13, 0.98, P 0.046. Row 10: Lignans, Model 1, HR 0.71, CI 95% 0.31, 1.63, P 0.417, Low n 32, HR 1 (ref.), Medium-high n 63, HR 0.76, CI 95% 0.35, 1.64, P 0.484. Row 11: Lignans, Model 2, HR 0.82, CI 95% 0.34, 1.99, P 0.655, Low n 32, HR 1 (ref.), Medium-high n 63, HR 0.56, CI 95% 0.25, 1.26, P 0.162. Row 12: Lignans, Model 3, HR 0.81, CI 95% 0.32, 2.01, P 0.643, Low n 32, HR 1 (ref.), Medium-high n 63, HR 0.50, CI 95% 0.21, 1.19, P 0.117. Row 13: Stilbenes, Model 1, HR 1.17, CI 95% 0.85, 1.59, P 0.352, Low n 32, HR 1 (ref.), Medium-high n 63, HR 0.98, CI 95% 0.44, 2.15, P 0.952. Row 14: Stilbenes, Model 2, HR 1.17, CI 95% 0.83, 1.64, P 0.375, Low n 32, HR 1 (ref.), Medium-high n 63, HR 0.65, CI 95% -26, 1.62, P 0.351. Row 15: Stilbenes, Model 3, HR 1.19, CI 95% 0.77, 1.85, P 0.431, Low n 32, HR 1 (ref.), Medium-high n 63, HR 0.57, CI 95% 0.21, 1.54, P 0.269. Row 16: Other polyphenols, Model 1, HR 0.98, CI 95% 0.94, 1.03, P 0.533, Low n 32, HR 1 (ref.), Medium-high n 63, HR 0.67, CI 95% 0.31, 1.42, P 0.289. Row 17: Other polyphenols, Model 2, HR 0.98, CI 95% 0.94, 1.03, P 0.525, Low n 32, HR 1 (ref.), Medium-high n 63, HR 0.71, CI 95% 0.31, 1.64, P 0.428. Row 18: Other polyphenols, Model 3, HR 0.98, CI 95% 0.93, 1.03, P 0.476, Low n 32, HR 1 (ref.), Medium-high n 63, HR 0.71, CI 95% 0.31, 1.63, P 0.416.
*Hazard ratio; aCox regression adjusted for age, marital status, smoking, level of physical activity, years of schooling and presence of comorbidities; bCox regression with all the adjustments in model 1 and additional adjustment for contraceptive use, tumour stage, menopause status, age at first menarche, BMI, calorie intake; cCox regression with all the adjustments in model 2 and additional adjustment for alcohol intake.
Low intake = Tercile 1/High and medium intake = Tercile 2 and Tercile 3.
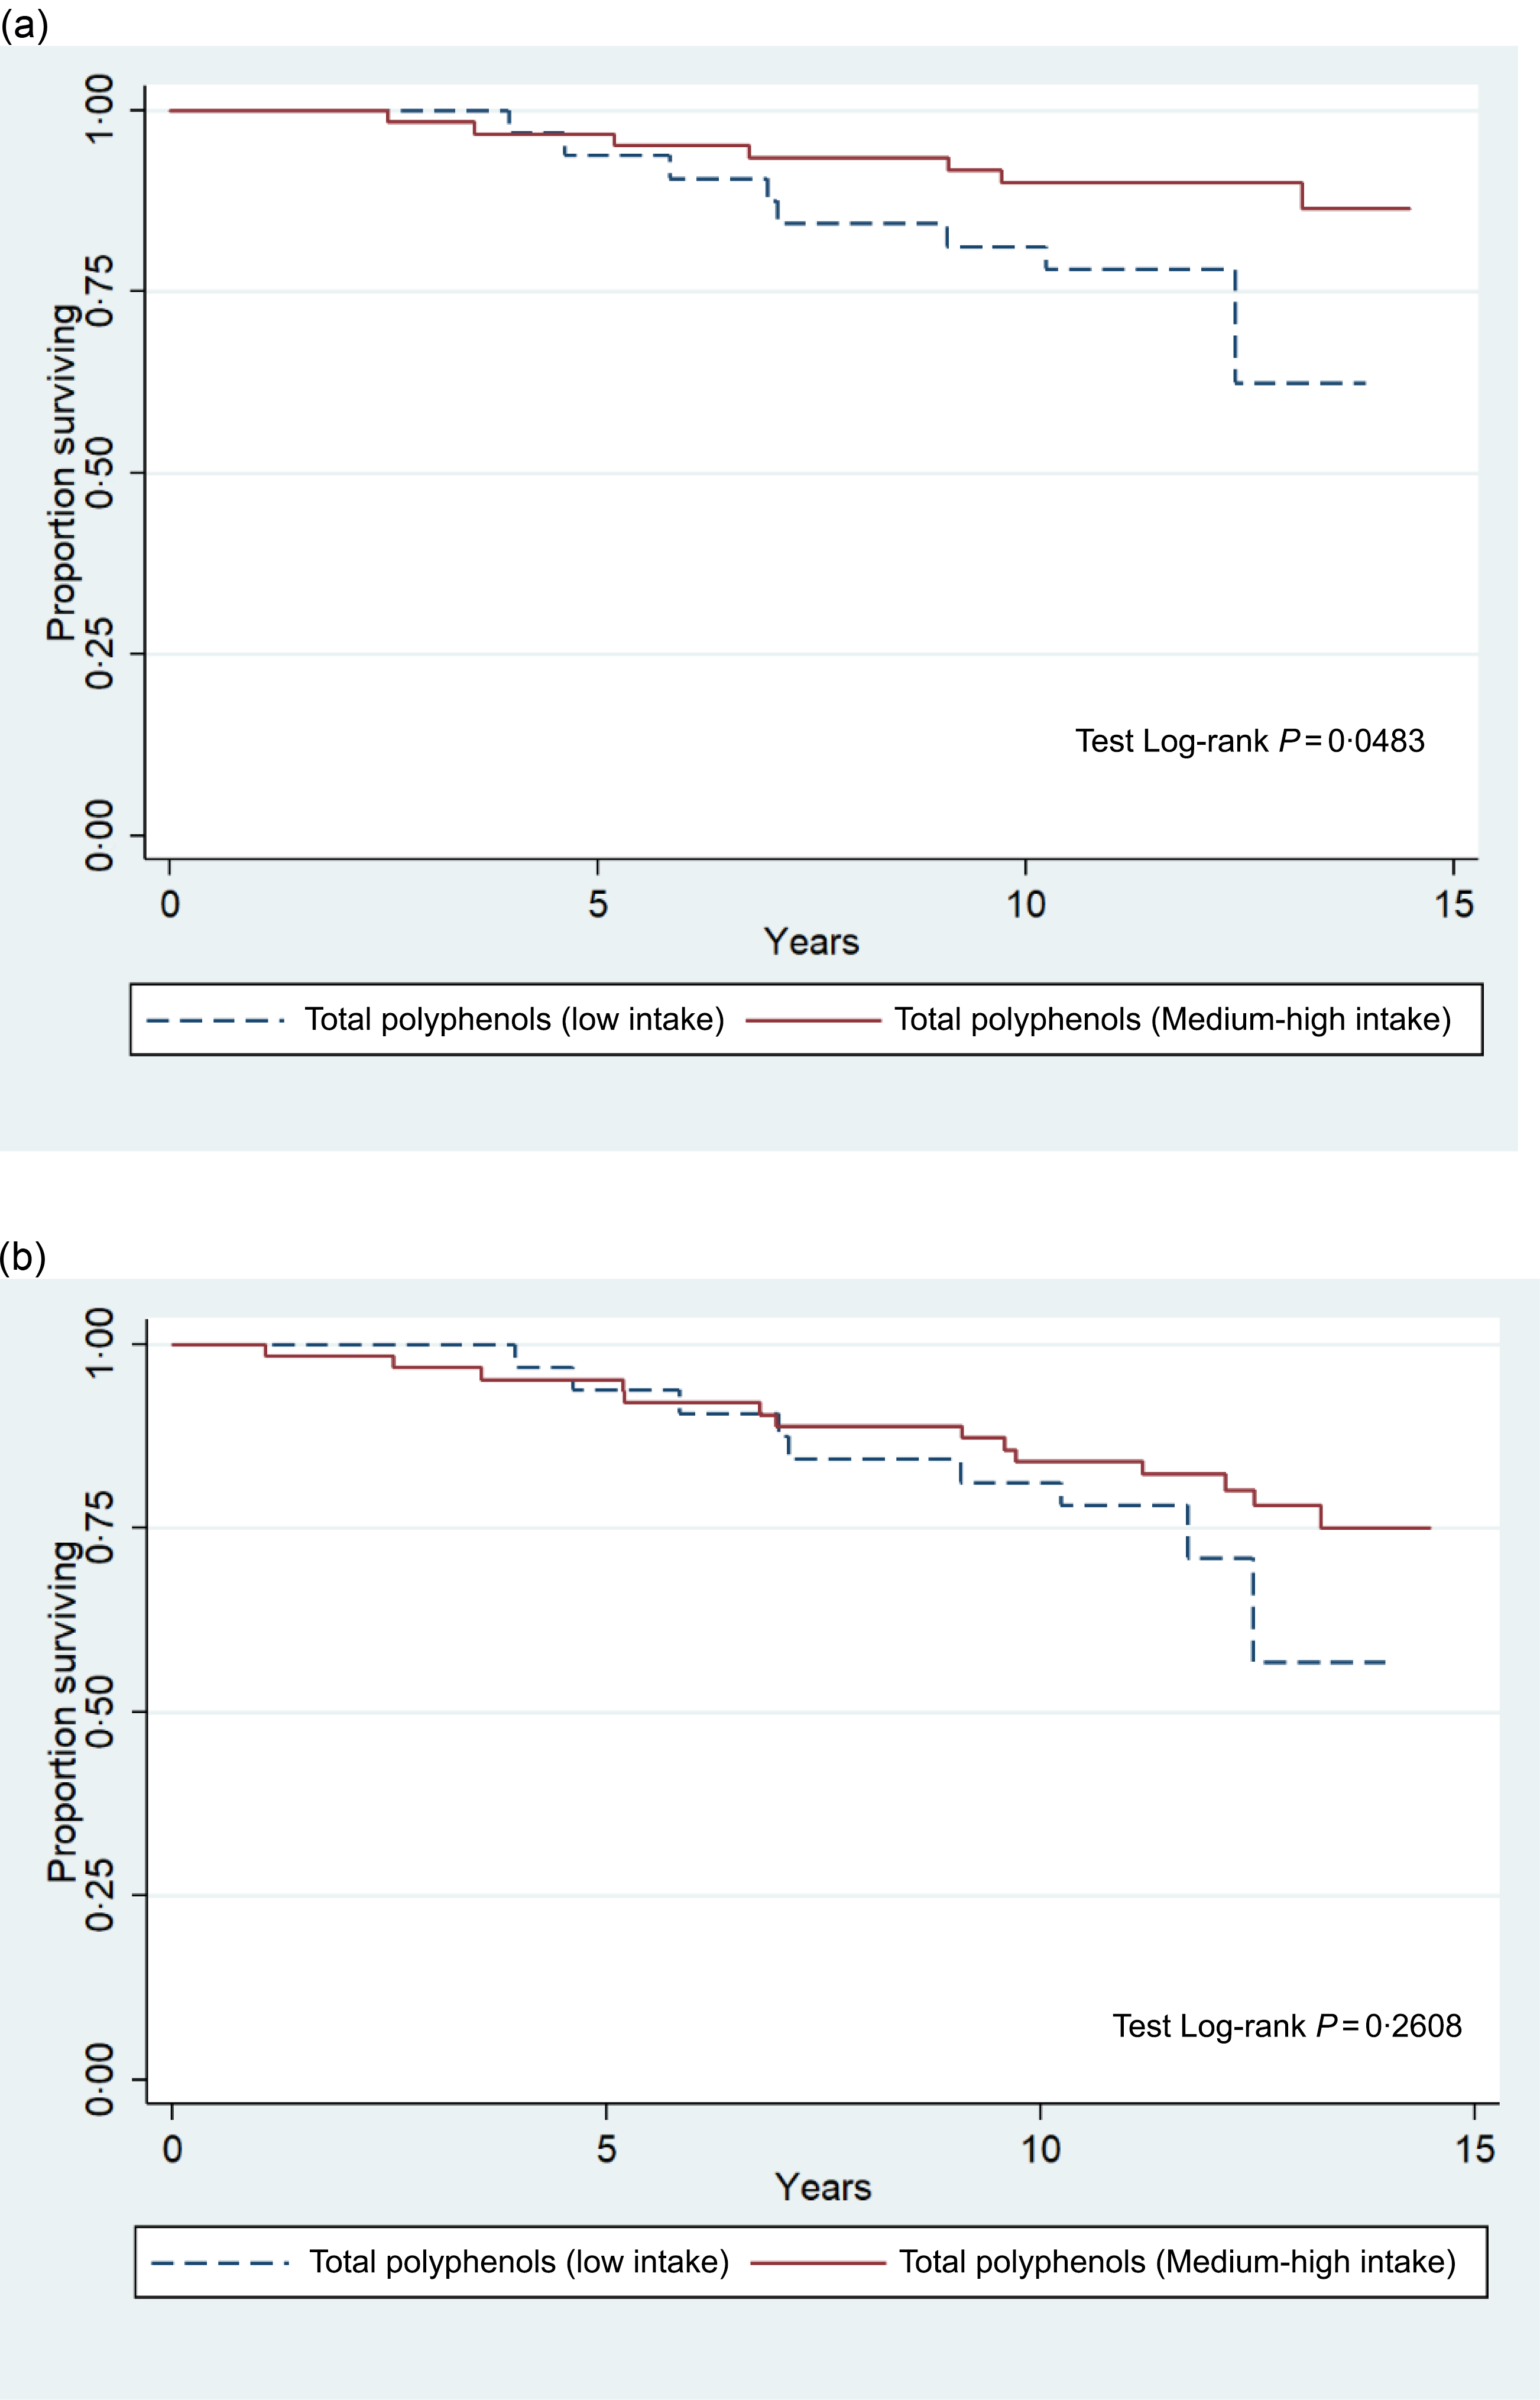
Figure 3 shows that consumption of total polyphenols was associated with greater survival when breast cancer-specific mortality was assessed (P = 0·048). However, when all-cause mortality was considered, the association was not significant (P = 0·261).
Survival (months) according to total polyphenol intake. Panel A: Breast cancer-specific mortality. Panel B: All-cause mortality.

Figure 3. Long description
Panel A: A Kaplan-Meier survival curve shows breast cancer-specific mortality over 15 years. The y-axis represents the proportion surviving, ranging from 0.00 to 1.00, and the x-axis represents years, ranging from 0 to 15. The graph includes two lines: a dashed blue line for low polyphenol intake and a solid red line for medium-high polyphenol intake. The solid red line generally shows higher survival rates compared to the dashed blue line. The log-rank test P-value is 0.0483. Panel B: Another Kaplan-Meier survival curve shows all-cause mortality over 15 years. The y-axis represents the proportion surviving, ranging from 0.00 to 1.00, and the x-axis represents years, ranging from 0 to 15. This graph also includes two lines: a dashed blue line for low polyphenol intake and a solid red line for medium-high polyphenol intake. The survival rates for both lines are more similar compared to Panel A. The log-rank test P-value is 0.2608.
Discussion
This study found that higher intakes of total polyphenols, phenolic acids and lignans were inversely associated with breast cancer-specific mortality. In addition, higher phenolic acid intake was associated with lower breast cancer recurrence and all-cause mortality. Participants with higher total polyphenol intake also showed longer survival when breast cancer-specific mortality was considered.
These associations may be related to the biological effects of polyphenols, including the regulation of antioxidant genes and proteins, the inhibition of proinflammatory cytokine synthesis, as well as their action on protein kinases that control the growth and programmed death of cancer cells(Reference Braakhuis, Campion and Bishop7,Reference El-Saadony, Yang and Saad29) . Polyphenols have also been shown to inhibit the expression of matrix metalloproteinases, which are involved in the formation of tumor metastases(Reference Avtanski and Poretsky30). Kyro et al. (Reference Kyrø, Zamora-Ros and Scalbert31), when evaluating 11 782 post-menopausal European women with breast cancer for an average of 6 years, found an inverse association between lignan consumption and breast cancer mortality in post-menopausal women. Although the study found associations with the lignan subclass, the associations were not statistically significant with the phenolic acid subclass.
Our study is the first to show the relationship between phenolic acids and a reduction in breast cancer mortality. Previous studies have shown an association between these compounds and the risk of developing breast cancer, in which phenolic acids have been shown to prevent the onset of the disease(Reference Vitelli-Storelli, Zamora-Ros and Molina32,Reference Romanos-Nonclares, Sánchez-Quesada and Gardeazábal33) , but to date, no study has found significant results with mortality. In the sample of women evaluated in this study, most phenolic acids were consumed through coffee. Previous studies have shown a possible protective role of coffee intake in breast cancer mortality. Farvid et al. (Reference Farvid, Spence and Rosner34) evaluated 8900 women with breast cancer for a median of 11·5 years, with up to 30 years of follow-up and found that those who consumed more than three cups of coffee/day had a 25 % reduced risk of breast cancer mortality and 26 % for all-cause mortality compared to non-drinkers.
Rosendahl et al. (Reference Rosendahl, Perks and Zeng35) suggest that coffee has properties that suppress the growth of breast tumor cells, especially those with a positive estrogen receptor, demonstrating a protective factor for mortality and for breast cancer recurrence. The anti-tumour action of phenolic acids can be attributed mainly to their antioxidant activity, eliminating metal-chelating radicals and modifying endogenous antioxidant defense mechanisms. In addition, these compounds have been shown to inhibit cell proliferation and oncogenic signalling cascades(Reference Abotaleb, Liskova and Kubatka36).
Despite the relevant findings of this study, some limitations should be acknowledged. First, the relatively small sample size may have reduced the precision of the estimates. Although the sample size was calculated a priori and considered adequate for the original study objectives, some associations presented wide 95 % CI, suggesting limited precision and possible statistical instability. Therefore, the magnitude of the observed associations should be interpreted with caution, and the findings should be considered exploratory. To minimise potential bias arising from small group comparisons, the medium and high intake tertiles were combined, resulting in two polyphenol intake groups and their respective classes.
Regarding other classes of polyphenols, no association was found in the present study, although flavonoids have previously been associated with breast cancer mortality and recurrence in other studies(Reference Bondonno, Dalgaard and Kyrø37–Reference Pounis, Costanzo and Bonaccio40). Further research with larger and more diverse samples is needed to better clarify the associations between different classes of polyphenols and clinical outcomes in women with breast cancer. Moreover, although the models were adjusted for energy intake, other dietary factors, such as overall diet quality, may also have influenced the results.
In addition, participants had a lower polyphenol intake compared with other studies on the same subject, which reported values ranging from approximately 300 to 1200 mg(Reference Taguchi, Kishimoto and Fukushima9,Reference Gardeazabal, Romanos-Nanclares and Martínez-González16,Reference Kyrø, Zamora-Ros and Scalbert31,Reference Vitelli-Storelli, Zamora-Ros and Molina32,Reference Bahrami, Makiabadi and Jalali41) . Furthermore, in a study carried out in the same country to characterise the population’s polyphenol intake, the median intake was 364 mg(Reference Carnaúba, Hassimotto and Lajolo42), a higher value than the median observed in this study.
Another limitation of this study was the reliance on dietary information obtained through an FFQ. This method has its drawbacks, including the potential for memory bias, a pre-defined list of foods and the quantification of consumption through portion sizes, which may not accurately reflect the exact quantities consumed. Furthermore, although the FFQ has been validated for assessing usual dietary intake in the Brazilian adult population, there is currently no FFQ specifically validated for estimating polyphenol intake in Brazilian populations. However, the FFQ is a cost-effective tool that captures participants’ habitual consumption over an extended period, making it suitable for epidemiological studies(Reference Willett43). To address possible biases associated with this method, our interviewers received specialised training to standardise the administration of the FFQ.
Moreover, it is important to highlight that the FFQ used in this study was adapted to the typical consumption patterns of a community in the same region as our sample. This adaptation ensured that foods commonly consumed by the women assessed were included. Lastly, we utilized the Phenol Explorer database to quantify polyphenols in foods and supplemented this information with specific articles, thereby enhancing the accuracy of polyphenol quantification.
In conclusion, the results of this study suggest inverse associations between phenolic acid intake and all-cause mortality, breast cancer-specific mortality and breast cancer recurrence. In addition, higher intake of total polyphenols and lignans was also associated with lower breast cancer-specific mortality. However, these findings should be interpreted with caution due to the relatively small sample size and wide confidence intervals. Although these results contribute to the growing evidence on the potential role of dietary polyphenols in breast cancer prognosis, further studies with larger samples are needed to confirm these associations.
Acknowledgements
We would like to express our gratitude to the Postgraduate Program in Nutrition at the Federal University of Santa Catarina and to the National Council for Scientific and Technological Development (CNPq/MCT) for the financial support provided for the development of this research, as well as to the Coordination for the Improvement of Higher Education Personnel (CAPES) for the master’s scholarship offered to the main researcher. We would also like to thank the teams of the Carmela Dutra Maternity Hospital and CEPON for providing offices to carry out this work, as well as all the women who took part in the research. This study is part of the master’s dissertation presented to the Postgraduate Program in Nutrition at the Federal University of Santa Catarina.
This study was funded by the CNPq Process No. 306209/2022-5 – CNPq Call for Proposals No. 09/2022 – Research Productivity Grants. Collaborators had no involvement in the preparation, analysis or writing of this article. The researcher, Elisa Rodrigues Silva, was awarded a master’s scholarship from CAPES, obtained through the selection process of the Postgraduate Program in Nutrition.
E. R. S.: Conceptualization-Lead, Investigation-Lead, Methodology-Lead, Project administration-Lead, Writing – original draft-Lead; N. K.: Methodology-Supporting, Supervision-Supporting, Writing – review & editing-Supporting; L. C. V.: Methodology-Supporting, Writing – review & editing-Supporting; J. S. D. S.: Methodology-Supporting, Writing – review & editing-Supporting; C. L. K. C.: Writing – review & editing-Supporting; L. K. R.: Writing – review & editing-Supporting; F. K. V.: Writing – review & editing-Supporting; P. F. D. P.: Methodology-Supporting, Project administration-Supporting, Supervision-Lead, Writing – review & editing-Supporting. All authors read and approved the final version of the manuscript.
There are no conflicts of interest.