Introduction
Passive radar or passive coherent location systems have been a popular topic all over the world. A passive radar system does not have a dedicated transmitter, but it uses broadcast transmitters as illuminators of opportunity to locate and track the targets [Reference Xie, Yi, Shen and Wan1–Reference Yi, Wan, YI and Cao9]. In the past 20 years, the signals used in the development of passive radar systems have been expanded rapidly. The signals could be analog signals such as frequency-modulated broadcasting [Reference Xie, Yi, Shen and Wan1, Reference Schüpbach, Paine and O'Hagan2], or digital signals such as digital video broadcasting [Reference Płotka, Malanowski, Samczyński, Kulpa and Abratkiewicz3, Reference Vorobev, Veremyev and Tulenkov4], digital audio broadcasting [Reference Kulpa, Osiński, Gromek, Samczyński, Malanowski and Bączyk5, Reference Schüpbach, Patry, Maasdorp, Böniger and Wellig6], WLAN signals [Reference Yamada and Ogawa7], LTE signals [Reference Rong, Liu, Liu and Long8], and China Mobile Multimedia Broadcasting [Reference Yi, Wan, YI and Cao9–Reference Yi, Wan, Li and Leung11].
Passive radar systems usually have two types of channels. One is used to receive echo signals of targets called the surveillance channel. The other that receives direct path signals of radio-frequency sources called the reference channel. The surveillance channel contains the low-power reflection echo signals from the targets, high-power direct path signals, and strong reflection echo signals from ground, buildings, and so on. The signal transmitted by an external radio-frequency source usually adopts two polarized modes, namely vertical (V) polarization or horizontal (H) polarization. Conventional passive radar systems use a single-polarized antenna to receive signals. Dual-polarization passive radar (DPPR) systems use two orthogonal-channel polarization antennas to receive signals. In most cases, even in the same transmitting polarization mode, both clutter and target have different receiving polarization states in DPPR systems.
Research studies about polarization diversity in passive radar systems have been reported in recent years. Some studies focused on the frequency modulation signals [Reference Filippini and Colone12–Reference Filippini and Colone16], and the others on digital television broadcasting signals [Reference Conti, Moscardini and Capria17–Reference Wojaczek, Cristallini, Schell, O'Hagan and Summers20]. These advantages have been demonstrated against different operative geometries as well as exploiting different sources of opportunities. In passive radar systems based on polarization diversity technology, the interference signal strength is much greater than the target signal, and scholars are willing to concentrate more on interference suppression. However, with the continuous improvement in interference suppression algorithms in time domain and spatial domain, in the relatively simple electromagnetic propagation environment, such as the suburban plains, the effect of adding polarization filtering to improve the signal-to-noise ratio (SNR) of the target is no longer obvious. Through experimental research, we found that the polarization amplitude ratio (PAR) of the complex structure target fluctuates drastically [Reference Yi, Wan, Yi and Cao21]. Thus, polarization technology is of great significance for the study of target characteristics. Particularly, exploiting the polarization diversity of the target in non-cooperative illuminations is an interesting topic. Therefore, it is necessary to study the polarization-scattering characteristics of the target and propose the corresponding signal fusion schemes.
The first attempt toward this direction is presented by a simple non-coherent integration (NCI) of range-Doppler (RD) maps obtained at multi-polarized surveillance channels. The polarization NCI (P-NCI) strategy aims at increasing the SNR of the target echo. However, it does not fully consider the influence of the noise signal integration of different polarization channels on the SNR of the fused signal. In this paper, we present a new signal fusion method, specifically devised for DPPR systems. In detail, the polarization-scattering characteristics of the target are analyzed and the detection performance of the radar system under different strategies is compared. These modifications enable an extensive validation to be carried out using both simulated and real data. For the experimental validation, we exploit a dataset collected by DPPR systems based on the China Mobile Multimedia Broadcasting (CMMB) signal, which is equipped with three orthogonal-polarized surveillance antennas and one linearly polarized reference antenna. We demonstrate the benefits of the proposed solution with respect to the conventional passive radar processing performed at the single-polarization channel as well as with respect to P-NCI approaches.
The paper is organized as follows. Section “Signal model” addresses the signal model of DPPR. Section “Electromagnetic simulation” describes the polarization-scattering characteristics of the target, and carries out a statistical analysis on the radar cross-section (RCS) of the target. Section “Polarization signal fusion” proposes the scheme of adaptive weighting-based signal polarization fusion. In Section “Monte Carlo simulation,” the simulation analyses prove that the scheme of adaptive weighting-based signal polarization fusion is effective. Section “Experimental research” shows the experimental results. Section “Conclusion” draws conclusions based on the experimental results and analysis in the previous sections.
Signal model
Passive radar is a special form of bi-static/multi-static radar system. The received signal contains direct path signals, strong clutters, and target echoes. Thus, the measurement of polarization state in echo signals becomes complicated. The composite clutter signal presents partially polarized wave characteristic.
In this paper, the bold letters represent vector and the italic represent scalar. Assume that the received signal noise is Gaussian white noise. Combined with the signal model of passive radar and polarization diversity technology, the echo signals are expressed as Jones vector form:

where d(t) is the transmitted signal. Edh, Enh, and Emh represent the H polarization component of the direct path signal, clutters, and targets, respectively. Edv, Env, and Emv represent the V polarization component of the direct path signal, clutters, and targets, respectively. wh and wv represent the Gaussian white noise of the H channel and V channel, respectively. c 1, cn, and αm represent the amplitude of the direct path signal, clutters, and targets, respectively. τn and τm represent the delay with respect to the direct path signal. $f_m^D$ represents the Doppler frequency of the m-th target. Mc and Mt represent the number of clutters and targets, respectively.
EH and EV can be represented in (2) and (3), respectively:


where ah(t) and av(t) represent the amplitude of signal model in the H channel and V channel. ϕh and ϕv represent the phase of signal model in the H channel and V channel.
Electromagnetic simulation
RCS of Boeing 737
Boeing 737 is the main aircraft type of China Airlines, and it is also one of the aircraft types that can often be observed in detection experiments of passive radar. Therefore, in order to study the target bi-static polarization-scattering characteristics of the digital television broadcasting band, this section will use this aircraft type to establish an electromagnetic calculation model. The target electromagnetic calculation coordinate is shown in Fig. 1.
Electromagnetic calculation coordinate.

In Fig. 1, the angle between the clockwise direction of the incident electromagnetic wave and the z-axis is defined as the incident pitch angle θTM, and the value is 0–180°. The angle between the projection of the incident electromagnetic wave in the XOY plane in the clockwise direction and the x-axis is defined as the incident azimuth angle φTM, and the value is 0–360°. Similarly, we define the pitch angle and azimuth angle of the scattered electromagnetic wave. Taking CMMB signal as an example, the center frequency is set as 714 MHz. The calculation software used is High Frequency Structure Simulator (HFSS). The simulation results can guide the experimental research of DPPR system target detection based on the cyclic prefix-orthogonal frequency division multiplexing (CP-OFDM) signal.
Assuming that the target is located in the far-field area, and the polarization components of the incident electromagnetic wave and the scattered electromagnetic wave satisfy a linear relationship, then the polarization-scattering matrix can be used to describe the polarization characteristics of the target [Reference Ai, Zeng, Gao, Wang and Wang22]. The Jones vector is used to describe the incident electromagnetic wave as, ET = [ETH ETV]T, the scattering electromagnetic wave as, ER = [ERH ERV]T. The polarization-scattering matrix of target can be defined as:

and

where S VH represents the V component of the scattered electromagnetic wave when the H-polarized electromagnetic wave illuminates the target. Under the conditions of known incident electromagnetic wave frequency and target attitude, the bi-static RCS can be expressed as:

where i, j = H, V, f represents incident electromagnetic wave frequency.
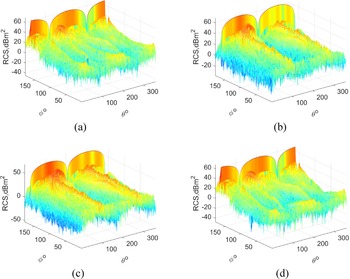
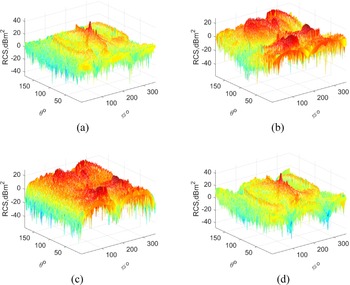
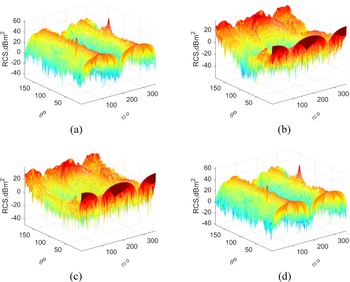
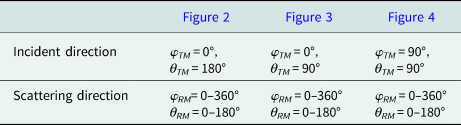
Assuming that the electromagnetic waves are incident from the abdomen, nose, and left side of Boeing 737, the scattering RCS are shown in Figs 2–4. The specific parameters are shown in Table 1.
Electromagnetic simulation results of HFSS incident on the abdomen of Boeing 737: (a) HH polarization, (b) VH polarization, (c) HV polarization, and (d) VV polarization.

Electromagnetic simulation results of HFSS incident on the nose of Boeing 737: (a) HH polarization, (b) VH polarization, (c) HV polarization, and (d) VV polarization.

Electromagnetic simulation results of HFSS incident on the left side of Boeing 737: (a) HH polarization, (b) VH polarization, (c) HV polarization and (d) VV polarization.

Incident and scattering direction description

It can be observed from Figs 2–4, irrespective of the direction the incident electromagnetic wave illuminates the aircraft, the target bi-static RCS of different polarizations changes dramatically with the pitch angle and azimuth angle of the scattered electromagnetic wave. The RCS of the four polarization receiving and transmitting modes presents a symmetrical distribution. When the target is located in the forward scattering area, the RCS of orthogonal polarization scattering is much smaller than the RCS of co-polarization scattering. In Fig. 3, by comparing the two modes of VH polarization and HV polarization, we find that the VH polarization mode will form a depression near θ = 90°, which indicates that Boeing 737 has better cross-polarization-scattering RCS for the V polarized incident wave.
Statistical analysis
Common statistical parameters, such as mean, standard deviation, maximum, minimum, range, etc., can be used to describe the fluctuation characteristics of target RCS more intuitively. When the frequency of the incident electromagnetic wave is constant, the characteristics of various parameters of the target within different bi-static angle ranges are calculated, and the length of each segment of statistical data is M, then the mean can be defined as the average value of the data D:

The standard deviation of the data D can be expressed as:

The maximum value of the data D can be expressed as:

The minimum value of the data D is:

The range is defined as the difference between the maximum and minimum:

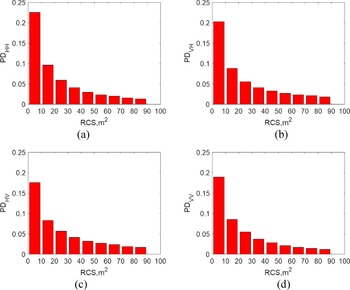
Taking the incident electromagnetic wave in the abdomen model as an example, after the simulation data are normalized, the bi-static RCS approximate probability density (PD) histogram can be obtained through statistical analysis (Fig. 5).
Bistatic RCS PD statistics results: (a) HH polarization, (b) VH polarization, (c) HV polarization and (d) VV polarization.

According to the coordinate system shown in Fig. 1, the bi-static angle of passive radar can be expressed as:

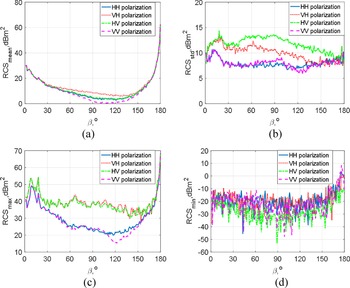
When the electromagnetic wave incident angle is (φTM, θTM), the relationship between the bi-static angle and the electromagnetic wave scattering angle (φRM, θRM) can be obtained from (12). Also, when θTM = 180°, and the statistical results of the mean, standard deviation, maximum and minimum of the target bi-static RCS are shown in Fig. 6.
Bistatic RCS statistical results: (a) mean of bistatic RCS, (b) standard deviation of bi-static RCS, (c) maximum of bistatic RCS, and (d) minimum of bistatic RCS.

In Fig. 6(a), the trend of the bi-static RCS mean is basically the same. When the bi-static angle is 0°, the mean of the target RCS is not the maximum. When the bi-static angle is 180°, the mean of the target RCS is the largest. When the bi-static angle is between 50 and 150°, the mean of the RCS in different polarization modes satisfies RCSm_VH > RCSm_HV > RCSm_HH > RCSm_VV. In Fig. 6(b), the trend of fluctuation in the bi-static RCS standard deviation is lower than the mean, and the variation trend of the RCS standard deviation in HH polarization and VV polarization are similar, the same as VH polarization and HV polarization. But, the RCS standard deviation in VH polarization and HV polarization are significantly largest than the ones in HH polarization and VV polarization which show that the RCS fluctuates obviously in the VH polarization and HV polarization, and it indicates that in the two polarization modes the target SNR fluctuates sharply. In Fig. 6(c), when the bi-static angle β = 180°, the maximum is the largest. The difference in the maximum of RCS between the two co-polarization modes and the two cross-polarization modes is obvious. As show in Fig. 6(d), the RCS minimum fluctuates greatly with each change of the bi-static angle. The overall observation shows that, except for the smaller RCS minimum in the HV polarization mode, the difference in the RCS of the other three polarization transmission and reception modes is not obvious. The statistical analysis presented in Figs 6(c) and 6(d) shows that the RCS fluctuation of the orthogonal polarization mode is more severe, which is the same as the analysis conclusion from Fig. 6(b).
Polarization amplitude ratio
Polarization ratio is a very important electromagnetic wave polarization descriptor [Reference Ren, Shi and Wang23], assuming that the incident electromagnetic wave is vertically polarized, it is defined as follows:

where EV and EH represent the electric field components of the horizontal channel and the vertical channel of the receiving antenna, respectively; and ϕHV represents the phase difference between the horizontal and vertical channel.
In the US Patent “Polarized radar system for providing target identification and discrimination” [Reference Nagy and Mich24] (number 4035797), the author proposes that for simple targets, the ratio of the co-polarization and cross-polarization signal amplitudes is a constant, while for complex targets, the ratio changes with different detection distances. The formula to calculate the PAR is:

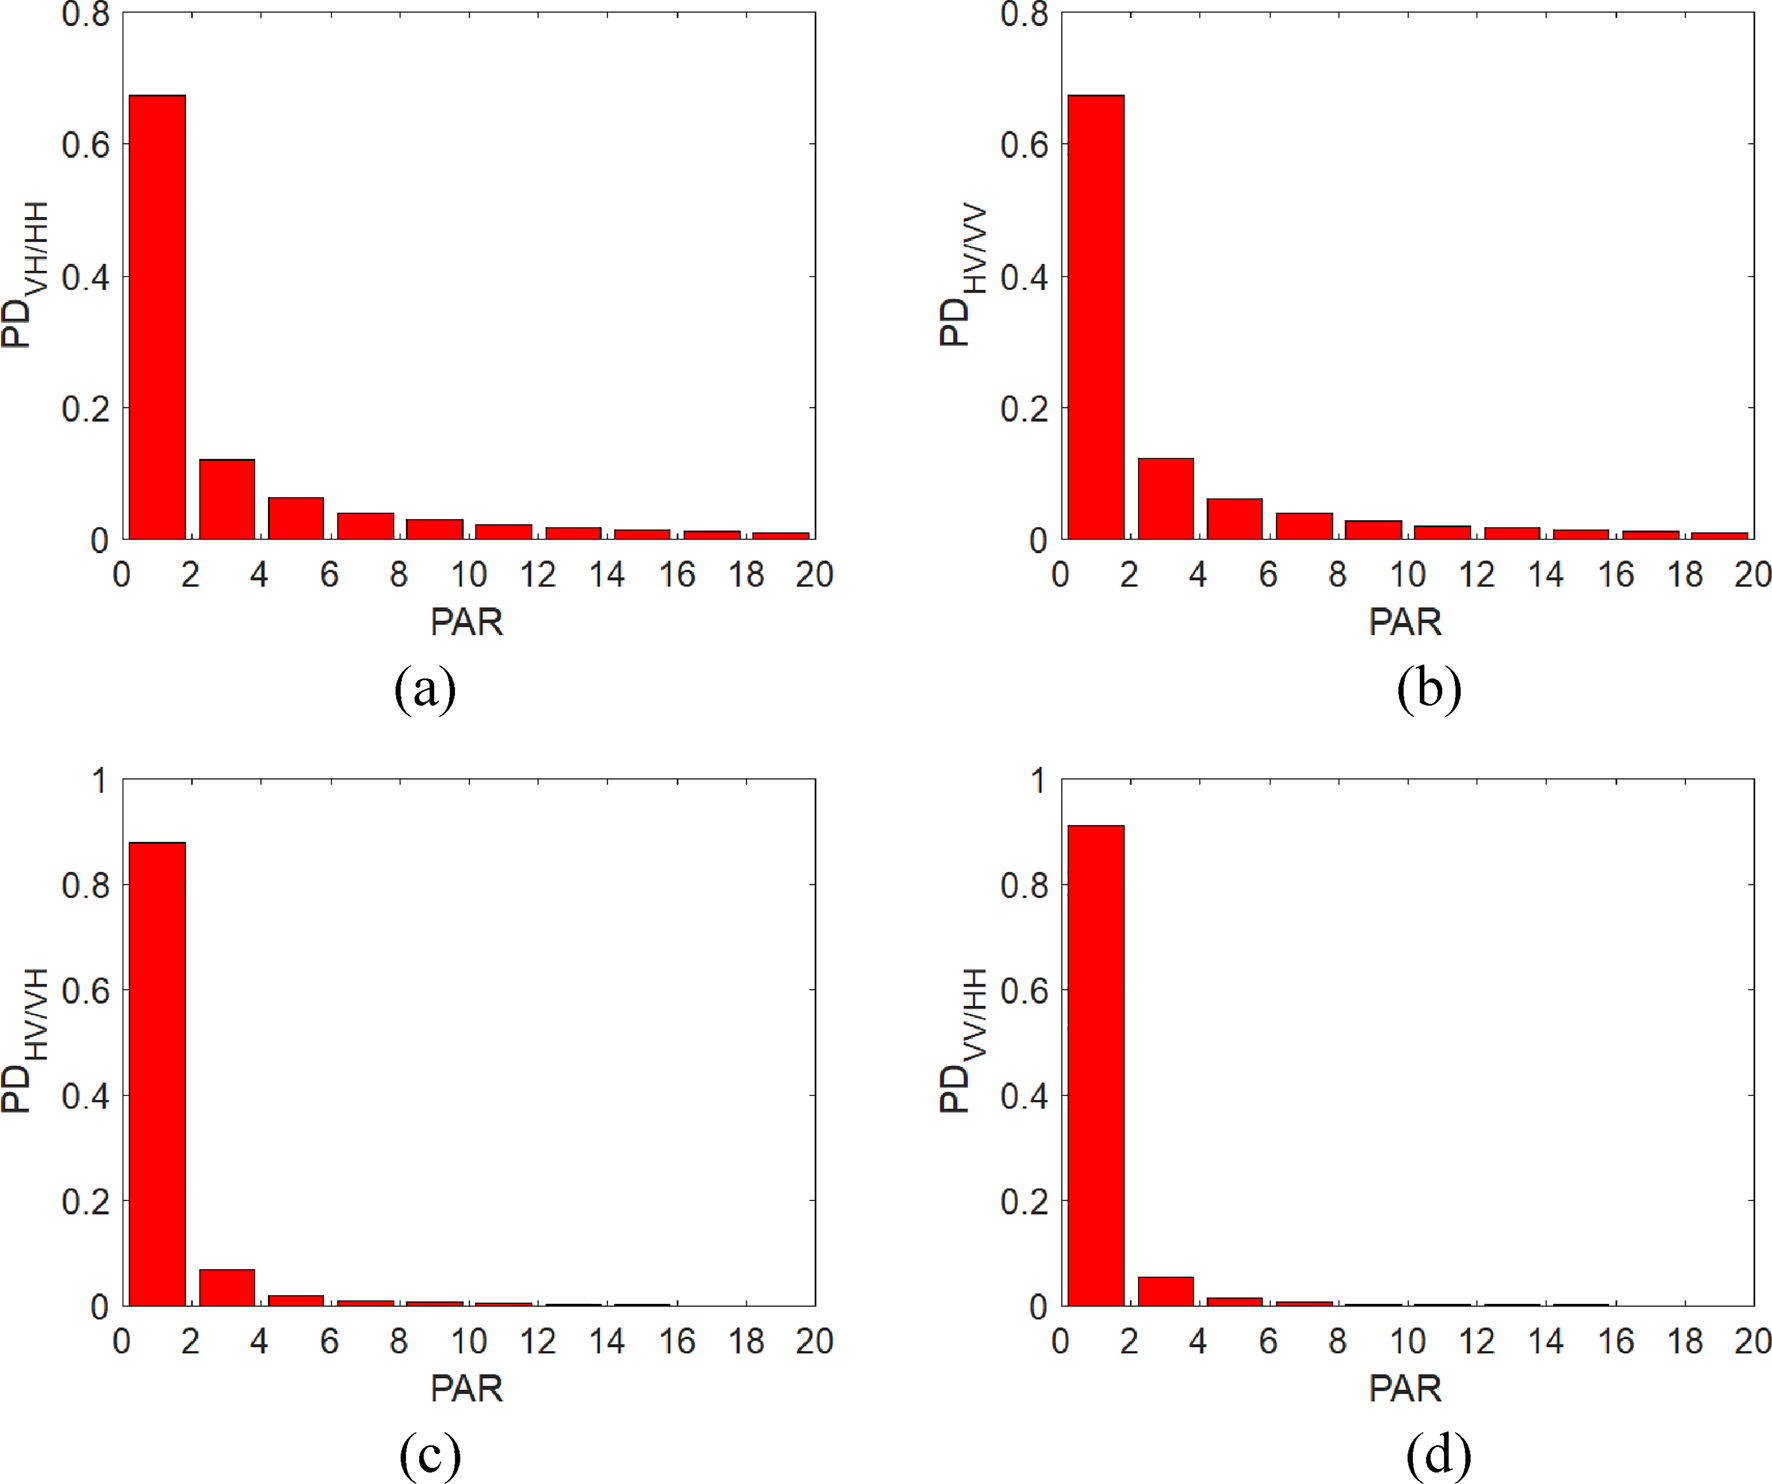
A statistical analysis was performed on the characteristics of the target PAR using HFSS, and the resulting histogram is shown in Fig. 7.
PAR statistics histogram: (a) VH/HH, (b) HV/VV, (c) HV/VH and (d) VV/HH.

It can be observed from the four statistical histograms that the PD values of the PAR are concentrated around 1. Calculate the proportion of PARVH/HH, PARHV/VV, PARHV/VH and PARVV/HH values less than or equal to 1 respectively, and the results are shown in Table 2.
Statistical result

The PARVH/HH represents the amplitude ratio of the V component and the H component of the scattered electromagnetic wave when the incident electromagnetic wave is H polarized. The PARHV/VV represents the amplitude ratio of the H component and the V component of the scattered electromagnetic wave when the incident electromagnetic wave is V polarized. PARHV/VH and PARVV/HH are defined similarly. In Table 2, when the polarization mode of the incident electromagnetic wave is fixed (H or V), the PD value of the cross-polarization component is weaker than the co-polarization component in the scattered echo and is close to 0.5. It is shown that the cross-polarization component is as important as the co-polarization component. It is possible to improve the detection performance of a radar system by using polarization diversity technology.
Target dynamic analysis
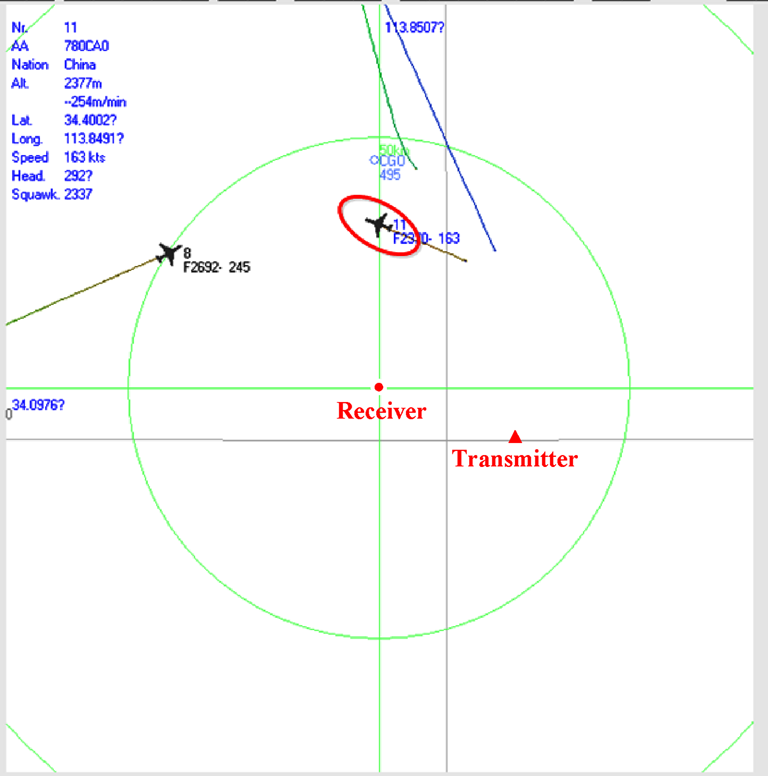
In the earlier research, the analysis of the polarization-scattering characteristics of the target was based on the reasonable design of the pitch angle θTM, the azimuth angle φTM of the incident electromagnetic wave, and the pitch angle θRM and the azimuth angle φ RM of the scattered electromagnetic wave. This cannot fully reflect the changes in the scattering characteristics of the target during a flight. In order to obtain more realistic simulation result, we use decoding and interpolation methods to extract the longitude, latitude, altitude, and other information of the target at all times form the automatic dependent surveillance-broadcast (ADS-B) signal of the actual route, and the location and altitude information of the transmitter and DPPR system are known. Therefore, we can calculate the electromagnetic wave incident angle from the transmitter to the target and the electromagnetic wave scattering angle from the target to the radar antennas. Regardless of various attenuation factors, using electromagnetic simulation data, the fluctuation state of the target RCS and PAR can be obtained closer to the real scene. The screenshot of the target in the ADS-B system is shown in Fig. 8. The relative positions of the transmitter, receiver, and target are indicated in Fig. 8.
Screenshot of ADS-B system.

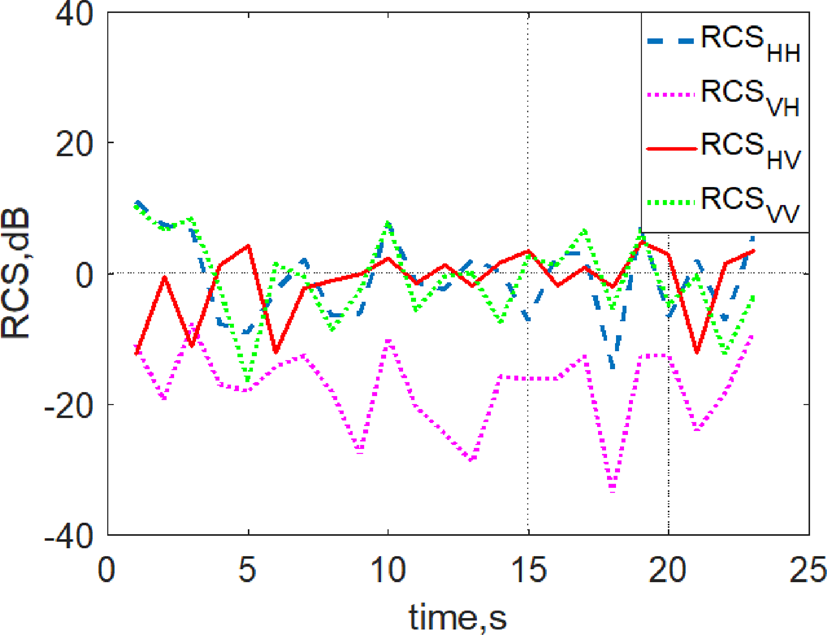
As shown in Fig. 9, when the incident electromagnetic wave is in H polarization, the cross-polarization component of the target RCS is smaller than the one of co-polarization components; when the incident electromagnetic wave is in V polarization, the RCS of target in the cross-polarization component is larger than the one of co-polarization components at certain moments.
RCS simulation results in real scenarios.

Figure 10 shows the PAR of the target in different polarization modes of the incident electromagnetic wave. When the incident electromagnetic wave is in V polarization, the target PAR fluctuates around 0 dB.
PAR simulation results in real scenarios.

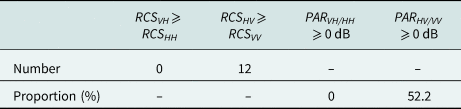
The ADS-B system provides information on the position of the target at 23 different times. The relationship between the cross-polarization and co-polarization components in RCS and PAR of scattered echo is shown in Table 3. In Table 3, number represents the number of times when the cross-polarization component of RCS is greater than or equal to the co-polarization component in the 23 times. The proportion indicates the proportion of the PAR greater than or equal to 0 dB when the incident electromagnetic wave is in H or V polarization. When the incident electromagnetic wave is in V polarization, both RCS and PAR indicate that the cross-polarization component is slightly stronger than the co-polarization component of scattered echo.
Statistical analysis

In China, most broadcast and television signals are transmitted in V polarization. Therefore, the use of target polarization fusion will likely improve the performance of the DPPR system.
Polarization signal fusion
Polarization non-coherent integration
In the research of passive radar based on polarization diversity technology, most of the research results are concentrated in the use of polarization diversity to suppress interference and clutter [Reference Yi, Wan, YI and Cao9, Reference You, Wan, Fu and Fang14, Reference Yi, Wan, Yi and Cao21]. However, the flicker of the target RCS will seriously affect the detection performance of the conventional single-polarization passive radar. Using the polarization fusion technology, the purpose of improving the performance of the signal of the passive radar can be achieved [Reference Conti, Moscardini and Capria17]. The advantage of DPPR over conventional single-polarization passive radar depends on the improvement of the SNR brought by target signal polarization fusion. We can set-up a simple simulation scenario: assume that there is a group of target polarization-scattering echo data; the SNR of each echo signal before coherent accumulation is −45 dB, the coherent accumulation time is 0.1 s; the bandwidth of the signal is 8 MHz, and the polarization angle of each echo signal follows the uniform distribution U(0°, 90°). The cell-average constant false-alarm rate (CA-CFAR) method is adopted, and the false-alarm rate is 10−6.
Assume that the RD maps of K polarization surveillance channels are denoted as RD k(τ, v) (k = 1,…,K). If the cell under test is located in the distance cell τ 0 and the Doppler cell v 0, the cell under test in the K channels form a complex vector x0 = [RD 1(τ 0, v 0)KRDk(τ 0, v 0)]T. The noise of each polarization channel satisfies the condition of independent and identical distribution, and x 0 satisfies a normal distribution with zero mean under the assumption of H 0. In the assumption of H 1 (target and noise), xt = [RD 1(τt, vt)…RDk(τt, vt)]T, where τt and vt represent the distance cell and the Doppler cell of target, respectively. The authors in [Reference Conti, Moscardini and Capria17] and [Reference Bongioanni, Colone, Martelli, Angeli and Lombardo25] studied the effect of P-NCI fusion method on the performance of a PDPR system based on digital video broadcasting-terrestrial (DVB-T) and frequency modulated (FM) signals. When the cell under test of RD map in the k polarization channels is processed by square-law detection and NCI, the result is:

and the q-th reference cell can be represented as

The decision criterion of the CA-CFAR detector based on the P-NCI fusion method is:

The threshold factor T can be obtained by setting the theoretical false-alarm probability as in (18) [Reference Bongioanni, Colone and Lombardo26]:

where M is the number of secondary cells and T is the CFAR threshold.
As shown in Fig. 11, the detection effect of CA-CFAR detector based on P-NCI is improved compared to the every single-polarization channel. But, there are still some trace points that cannot be detected. This is caused by the difference in the SNR of the echo signal between different polarization channels. However, the received signal of the V polarization channel is represented as SV = sv + nv and the signal of the H polarization channel as SH = sh + nh. Assuming that SNRV = sv/nv > SNRH = sh/nh, then the SNR of fusion signal satisfies SNRV > SNRf > SNRH. This may cause the detection result of the fusion signal to be inferior to that of the V polarization channel.
Detection result of CA-CFAR based on P-NCI.

Taking the H and V polarization channels as example, assuming that the average noise floor of the two channels is equal, when the SNR of H channel decreases gradually, SNRH ⩽ SNRV = 20 dB, that is, the difference between the H polarization channel and V polarization channel increases gradually; the change in the SNR after subjected to P-NCI is shown in Fig. 12.
Influence of SNR difference of each polarization channel on signal fusion based on P-NCI.

Figure 12 shows that the difference in SNR between V and H polarized channel will result in a decrease in SNR of P-NCI.
Signal fusion in polarization weighted
This section will attempt to address the problem raised above by using polarization signal fusion based on adaptive weighted (AW-PSF). Taking a digital television signal based on CP-OFDM as an example, the CP is usually assumed to be greater than or equal to the channel delay extension so as to avoid inter-symbol interferences and assure inter-carrier orthogonal. When this assumption is satisfied, the benefits related to CP for communication purpose could also be derived as advantages for passive radar application. The processing flow is shown in Fig. 13.
Signal processing flow of subcarrier-based polarization filtering method.

It is necessary to pre-process the signal of each polarization channel before signal fusion. The signal of opportunistic illumination source is received by the reference antenna, and we need to perform signal reconstruction to obtain a pure reference signal [Reference Griffiths and Baker27]. In order to ensure the consistency of the amplitude and phase between the surveillance antennas of polarization array, it is necessary to calibrate the antennas first. Then, it is necessary to perform CPs cutting on the echo signal of each channel. The CP cutting is shown in Fig. 14. τc represents the clutter delay. There are two identical synchronous signals at the beginning of each time slot. The content of synchronous signal transmission is known in advance. The starting point of each time slot of the receiving signal can be determined by synchronous signals. According to the CP-OFDM signal structure, the window function can effectively intercept useful symbols. Next, we need to filter the signals in each polarization surveillance channel to remove the interference and clutter signals. Finally, we need to use the reference signal and the surveillance signal to perform matched-filtering processing to obtain the RD maps.
CPs cutting.

After obtaining RD maps of each polarization channel signal, we need to carry out signal fusion processing. After interference suppression and matched filtering, the data on the RD map of the k-th polarization channel is assumed to be RDk(τ,v). After the square-law detection processing, the k-th channel and the m-th cell to be detected is RDk(τm,vm), and the output signal of AW-PSF is defined as:

where

where $\overline {{\vert {n_{l, m}} \vert }^2}$ represents the average value of the reference cell samples of the l-th channel and the m-th cell to be detected after the square-law detection.
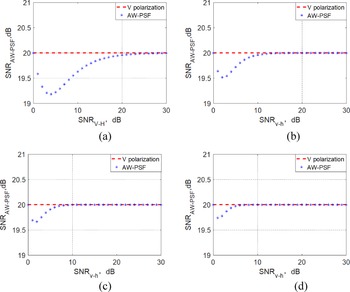
With the same simulation condition as in Fig. 11, and in view of the different values of n in w, the influence of the difference in the SNR of the signal of each polarization channel on the AW-PSF method is evaluated, as shown in Fig. 15.
Influence of different values of n on the AW-PSF method: (a) n = 1, (b) n = 2, (c) n = 3, and (d) n = 4.

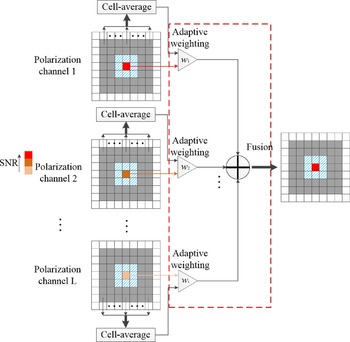
It can be observed from Fig. 15 that regardless of the value of n, the difference in the SNR between H polarization and V polarization channels has less impact on AW-PSF compared to P-NCI. In different polarization channels, the greater the SNRAW-PSF difference, the better the SNRAW-PSF convergence (SNRV > SNRH), and the more stable it is. The value of n affects the convergence rate of SNRAW-PSF. The larger the value of n is, the faster the convergence rate is. The AW-PSF method when n = 1 is compared with P-NCI in subsequent simulation and experimental analysis. The principle of AW-PSF is shown in Fig. 16.
AW-PSF realization principle diagram.

Monte Carlo simulation
In order to compare the detection performance of AW-PSF and P-NCI methods, we will conduct Monte Carlo simulation experiment. The simulation conditions are shown in Table 4.
Simulation condition

The false-alarm rate is 10−6, and the threshold factor T can be obtained from (18). After performing 500 Monte Carlo simulation experiments, the relationship between the SNR and detection probability is shown in Fig. 17.
Relationship between SNR and detection probability.

In Fig. 17, the abscissa is the SNR of signal after matched filtering, and the ordinate is the detection probability of the signal. The AW-PSF method overcomes the adverse effect of SNR difference in different polarization channels on signal fusion, and has better robustness.
Experimental research
Experimental system
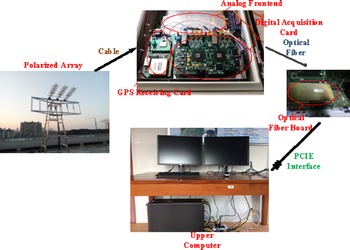
DPPR is a special form of a bi-static/multi-static radar system. The illuminators of opportunity are given priority to cover urban area, the received signal contains direct path signals, strong clutters, and target echoes. The experimental system is composed of a polarized antenna array, a receiver, an optical fiber board, and an upper computer. The radar system is shown in Fig. 18.
Polarization diversity passive radar system.

The antenna array is composed of three pairs of orthogonal polarization antennas. Each pair of polarized antenna requires two receiving channels. The polarization isolation reaches 20 dB between the frequency band 710 and 718 MHz, and the gain of each antenna is about 10 dB [Reference Cao, Gong, Yi and Wang28]. The receiver is composed of GPS receiving card, analog frontend, and digital acquisition. The optical fiber card converts electrical signals into optical signals and realizes high-speed data transmission.
Experimental result
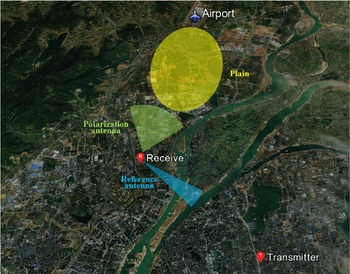
AW-PSF is a signal fusion method based on adaptive weighting. After array calibration, interference suppression, and matched filtering, the data of H and V channels are adaptively weighted and fused, and the fused signal is detected with a constant false-alarm rate. The detection method is CA-CFAR, and the false-alarm rate is 10−6. The detection target was a Boeing 737 plane which took off from the airport. The experimental scenario during airplane detection is shown in Fig. 19.
Experimental geometry and scenario in Nanchang.

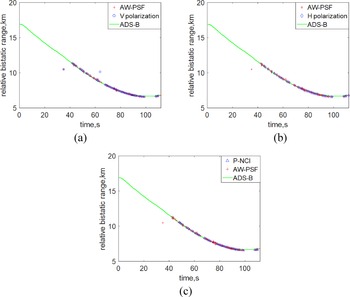
In Fig. 19, the green sector area represents the direction of polarized surveillance antenna beam. The blue sector area represents the direction of reference antenna beam. The yellow elliptical area represents plain. We use time domain and spatial domain interference suppression algorithms to suppress interference and clutter signals [Reference Yi, Wan, Li and Leung11]. Then, we use different polarization signal fusion methods to fuse the target signal. We collected 112 frames of data. The data in one frame contain 40 timeslots, and the duration is 1 s. A timeslot contains 53 OFDM blocks. Each OFDM block contains a CP and a useful symbol portion. The useful symbol duration is 409.6 μs. When the transmit mode of the opportunistic illumination source is V polarization, we compare the detection results after using single V or H polarization reception, using the P-NCI and AW-PSF as shown in Fig. 20.
Comparison of detection results: (a) V polarization and AW-PSF, (b) H polarization and AW-PSF, and (c) P-NCI and AW-PSF.

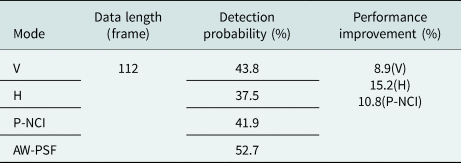
It can be observed from the comparison results in Fig. 20 that the detection performance of the DPPR system is the best when the AW-PSF is adopted. The results of specific experimental analysis are shown in Table 5.
Comparison of experimental results

In this experiment, the total length of data to be detected is 112 frames. When the AW-PSF method is adopted, the target can be detected in 59 frames of data, and the detection probability is 52.7%. The detection probability of AW-PSF is 8.9 and 15.2% higher than that of the single V polarization and H polarization modes, respectively, and 10.8% higher than that of the P-NCI method.
Conclusion
In this paper, we propose an adaptive weighting-based polarization signal fusion method. We compare the target detection performances of different polarization signal fusion methods. The proposed AW-PSF outperforms the single-polarization mode and the signal fusion P-NCI method.
The RCS and PAR characteristic of target has also been studied in this paper. The RCS and PAR characteristic of Boeing 737 fluctuates dramatically. This means that not only the polarization filtering technology, but also the polarization fusion technology based on the polarization-scattering characteristics of the target can effectively improve the detection performance of DPPR systems.
Acknowledgement
The authors acknowledge Wuhan University for supporting the work of this paper. This study was supported by the National Nature Science Foundation of China (61967007 and 61963016), the Key Research and Development Program of Jiangxi Province (20202BBEL53014 and 20201BBF61012), the Natural Science Foundation of Jiangxi Province (20212BAB202005), the Research Project of National Defence Science and Technology Key Laboratory Foundation (6142113180101), and the Jiangxi Province Department of Education Science and Technology Research Key Project (GJJ200667, GJJ170360, and GJJ200667).
 Yucheng Yi was born in Hunan, China, in 1985. He received his Ph.D. degree from the School of Electronic Information, Wuhan University. He is now a lecturer at the School of Information Engineering, East China Jiaotong University. His main research interests include radar signal processing and polarization array signal processing.
 Lu Zhu was born in Jiangxi, China, in 1976. He received his Ph.D. degree from the Huazhong University of Science and Technology. He is now a professor and Master supervisor at the School of Information Engineering, East China Jiaotong University. In recent years, he has hosted and participated in more than 10 national research projects.
 Xiaomao Cao was born in Hunan, China, in 1991. He is currently working toward his Ph.D. degree at the School of Electronic Information, Wuhan University. His main research interests include radar signal processing, antenna design, and array calibration.