1. Introduction
The landscape evolution of Asia has greatly influenced regional climate processes over the continent through the Cenozoic. Aridification of the Asian interior and the subsequent formation of the Asian Deserts was likely influenced by uplift of the Tibetan Plateau and the Himalaya (Raymo & Ruddiman, Reference Raymo and Ruddiman1992; An et al. Reference An, Kutzbach, Prell and Porter2001; Wang et al. Reference Wang, Zhao, Liu, Lippert, Graham, Coe, Yi, Zhu, Liu and Li2008; Tada et al. Reference Tada, Zheng and Clift2016). Asian aridification potentially began as early as the late Oligocene (28–23 Ma) (Guo et al. Reference Guo, Ruddiman, Hao, Wu, Qiao, Zhu, Peng, Wei, Yuan and Liu2002). The onset of the Asian Monsoon system may have occurred in the Late Oligocene to Early Miocene (26–23 Ma) (An et al. Reference An, Kutzbach, Prell and Porter2001; Tada et al. Reference Tada, Zheng and Clift2016) and possibly even in the Eocene (e.g. Licht et al. Reference Licht, van Cappelle, Abels, Ladant, Trabucho-Alexandre, France-Lanord, Donnadieu, Vandenberghe, Rigaudier, Lécuyer, Terry, Adriaens, Boura and Guo2014). Additionally, global cooling events in the Middle Miocene (16–13 Ma) and Late Miocene (7.5–5.4 Ma) are likely to have influenced the jet stream path and intensity of the monsoon (Raymo & Ruddiman, Reference Raymo and Ruddiman1992; Zachos et al. Reference Zachos, Pagani, Sloan, Thomas and Billups2001). Tectonics and global climate cooling likely worked in tandem to influence the regional monsoon system, as well as the creation and sustenance of interior Asian deserts. Understanding past variability in the East Asian Monsoon is of great importance to better predict potential changes to hydrologic and biogeochemical cycles due to climate change in one of the most densely populated regions on Earth.
The present scientific consensus highlights variability in the intensity and position of the East Asian Monsoon system since its development. Key unknowns still remain, for example, regarding the precise latitudinal and intensity shifts of the Westerly Jet, Meiyu-Baiu-associated storm fronts (Irino & Tada, Reference Irino and Tada2000; Nagashima et al. Reference Nagashima, Tada, Matsui, Irino, Tani and Toyoda2007; Molnar et al. Reference Molnar, Boos and Battisti2010; Chiang et al. Reference Chiang, Fung, Wu, Cai, Edman, Liu, Day, Bhattacharya, Mondal and Labrousse2015; Zhang et al. Reference Zhang, Griffiths, Chiang, Kong, Wu, Atwood, Huang, Cheng, Ning and Xie2018a), and the timing of increased dust flux periods (Rea et al. Reference Rea, Snoeckx and Joseph1998; Ziegler et al. Reference Ziegler, Murray, Hovan and Rea2007; Zhang et al. Reference Zhang, Chen, Ji and Li2016). Variation in source region, mobilization and transport of dust under changing climate conditions may significantly influence biogeochemical cycling in the Japan Sea and North Pacific, and may have implications on radiative forcing in the future. The loess, palaeosol and desert deposits of central Asia are mobilized via aeolian and fluvial processes related to the intensity and path of the monsoon system and ultimately deposited in marine sediment, resulting in important terrigenous sediment archives in the surrounding Asian marginal seas.
We reconstruct the temporal variation over the past 12 Ma in the source and flux of the aluminosilicate terrigenous component(s) to the sediment in the Ulleung Basin at Site U1430 in the Japan Sea recovered during Integrated Ocean Drilling Program (IODP) Expedition 346. These sediments reflect material transported by prevailing wind systems over the Asian continent (Irino & Tada, Reference Irino and Tada2002; Nagashima et al. Reference Nagashima, Tada, Matsui, Irino, Tani and Toyoda2007), but also likely include volcanic ash (e.g. Scudder et al. Reference Scudder, Murray, Schindlbeck, Kutterolf, Hauff, Underwood, Gwizd, Lauzon and McKinley2016, Reference Scudder, Murray, Kutterolf, Schindlbeck, Underwood and Wang2018), and minimal fluvial material (Shen et al. Reference Shen, Wan, France-Lanord, Clift, Tada, Révillon, Shi, Zhao, Liu, Yin, Song and Li2017). To determine changes in terrigenous sources through time, we modelled an expansive geochemical compositional dataset of bulk sediment chemical analyses using multivariate statistical techniques. With the model results, we identify probable end-member components, quantify their fluxes and discuss the linkages between these end-members and variability in the East Asian Monsoon as driven by regional and global forcings. We untangle the sedimentary record to identify three sources from the Asian interior (Taklimakan, Gobi and Chinese Loess Plateau), a fourth component consisting of Korean Peninsula sourced material, and determine their fluxes. Combined with previous studies from the North Pacific, we discuss large-scale, regional evolution of aeolian material transported from the Asian interior to the ocean over the last 12 Ma.
2. Site setting, sample selection and stratigraphy
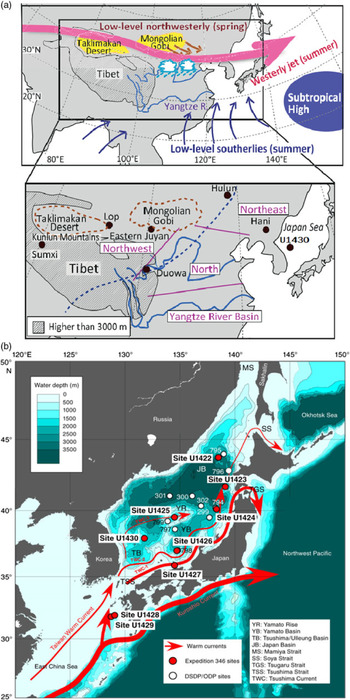
The Japan Sea (Fig. 1; also known as the East Sea) is a semi-enclosed marginal sea connected to the East China Sea to the south, and the North Pacific Ocean and Okhotsk Sea to the north, via four shallow and narrow straits (Tsugaru, Tsushima, Soya and Mamiya). This marginal sea consists of the deep Japan, Yamato and Ulleung Basins. Tectonic rifting during the Late Oligocene to Early Miocene initiated the formation of the Japan Sea; a deep and wide marginal sea may have existed by c. 20 Ma (Tada, Reference Tada1994). Rapid subsidence formed the early Ulleung Basin during the Early Miocene, prior to the back-arc closing stages in Japan Sea formation in the Mid-Miocene (Yoon et al. Reference Yoon, Sohn and Chough2014).
(a) Spring and summer atmospheric circulation and monsoon-related rainband (clouds). The enlarged map indicates the locations of the Taklimakan and Gobi Deserts. The dashed line represents the limit of the modern summer monsoon. Adapted from Nagashima et al. (Reference Nagashima, Tada and Toyoda2013). (b) Bathymetric map of sites from IODP Expedition 346 (red circles), Deep Sea Drilling Project / Ocean Drilling Project (DSDP/ODP) sites (white circles) and modern surface currents (red arrows). This study focuses on Site U1430 in the Ulleung Basin, western Japan Sea. From Tada et al. (Reference Tada, Murray and Alvarez Zarikian2013).

Site U1430 is located in the Ulleung Basin at 37° 54.16′ N, 131° 32.25′ E and 1072 m water depth (Fig. 1). Under present conditions, the Ulleung Basin is influenced by the second branch of the Tsushima Warm Current as well as by its third branch that also forms the Subpolar Front. The relatively central location of this site provides an opportunity to reconstruct East Asian Monsoon influenced aeolian provenance and flux with minimal terrigenous supply from the Korean Peninsula or the Japanese Archipelago itself (Shen et al. Reference Shen, Wan, France-Lanord, Clift, Tada, Révillon, Shi, Zhao, Liu, Yin, Song and Li2017).
The sediment at Site U1430 is defined by three lithologic units (Tada et al. Reference Tada, Murray and Alvarez Zarikian2013). Unit III extends from the middle to upper Miocene (250 mbsf (metres below the seafloor) to 100 mbsf) and is divided into three subunits. Subunit IIIC is composed of dark-grey, glauconite-rich quartz/feldspar-dominated sandstone and light-grey glauconite-rich dolomite-dominated sandstone. Subunit IIIB contains dark-grey siliceous silty clay and claystone. Subunit IIIA contains alternating layers of diatom ooze, clayey diatom ooze and diatom-rich silty clay. The next shallower unit, lithologic Unit II, extends from the upper Miocene to upper Pliocene (100 mbsf to 55 mbsf), and is marked by an increase in diatom content with decreasing age. This unit is divided into two subunits, transitioning from dark-grey diatom ooze (IIB) to diatom-bearing silty clays (IIA). The youngest, Unit I, extends from the upper Pliocene to Holocene (55 mbsf to 0 mbsf), and consists of clayey silt, silty clay and nannofossil ooze, and diatom-rich silty clay. In this shallowly buried lithologic unit, CaCO3 comprises up to c. 30 wt % of the sediment. Alternating organic-rich, grey and organic-poor, greenish-grey silty clay intervals comprise Unit I, and a decrease in calcareous microfossils downhole divides this unit into Subunits IA and IB. Discrete tephra layers (volcanic ash, pumice) occur at higher frequency in the upper 50 m of the site, but volcanic material is a minor component to the sediment section as a whole (Tada et al. Reference Tada, Murray and Alvarez Zarikian2013).
We integrate several age models for Site U1430 (Kamikuri et al. Reference Kamikuri, Itaki, Motoyama and Matsuzaki2017; Matsuzaki et al. Reference Matsuzaki, Itaki, Tada and Kamikuri2018; Kurokawa et al. Reference Kurokawa, Tada, Matsuzaki, Irino and Lofi2019) that are of similar sampling resolution and cover the same age range as our study. We therefore use these models rather than, for example, a higher-resolution age model for only the youngest 1 Ma (Tada et al. Reference Tada, Irino, Ikehara, Karasuda, Sugisaki, Xuan, Sagawa, Itaki, Kubota, Lu, Seki, Murray, Alvarez-Zarikian and Anderson2018). Matsuzaki et al. (Reference Matsuzaki, Itaki, Tada and Kamikuri2018) identified a hiatus between c. 4 Ma and 7.3 Ma. Bulk accumulation rates (BAR; g cm−2 ka−1) for individual samples were calculated from the dry bulk density and linear sedimentation rates. Dry bulk densities (DBD; g cm−3) were measured during the expedition (Tada et al. Reference Tada, Murray and Alvarez Zarikian2013), and linear sedimentation rates (LSR; cm ka−1) were determined from the integrated age model. Additional discussion about accumulation rate calculations can be found in the online Supplementary Material (available at https://doi.org/10.1017/S001675681900013X).
3. Analytical geochemistry and multivariate statistical methods
3.a. Geochemical methods
A total of 80 bulk sediment samples from Site U1430 were used for this research. Twenty-three of these samples were collected at the time of drilling, are evenly spaced by depth and consist of 5 cm-long whole round samples squeezed for shipboard pore-water analyses. An additional 57 discrete samples were collected during shore-based sampling to fill temporal gaps due to variation in sedimentation rate determined after the conclusion of the expedition.
Sample preparation and analysis was conducted in the Analytical Geochemistry Facility at Boston University. Homogenized representative subsamples were freeze-dried and hand powdered with an agate mortar and pestle for each discrete sample prior to digestion. Samples were dissolved using flux fusion and acid digestion, and were analysed for a total of 50 elements as described most recently by Anderson et al. (Reference Anderson, Murray, Dunlea, Giosan, Kinsley, McGee and Tada2018).
Precision and accuracy are well constrained. Analytical batches included separate digestions of a homogenized, natural in-house sediment reference from Expedition 346 in triplicate. Analysis of replicates indicates that the data are precise within c. 2 % of the measured value for each element. Additionally, the international Standard Reference Material BHVO-2 was analysed as an unknown within each analysis run, and compared to the accepted element concentrations. Measured BHVO-2 concentrations were consistently accurate within precision for all elements (Ireland et al. Reference Ireland, Scudder, Dunlea, Anderson and Murray2014).
3.b. Multivariate statistical methods
To untangle the aluminosilicate fraction of these samples, a subset of seven elements were used in the multivariate statistical MATLABTM algorithms from Pisias et al. (Reference Pisias, Murray and Scudder2013) and Dunlea & Murray (Reference Dunlea and Murray2015) to directly target the composition of the aluminosilicate fraction(s) and avoid the chemical influence of any biogenic, oxide or other non-aluminosilicate components. These methods follow a multi-step statistical approach optimized for sediment geochemistry using Q-mode factor analysis (QFA) and constrained least squares multiple linear regression (CLS). The implementation and interpretation of these techniques are guided by downhole profiles of elemental ratios and ternary plots to ensure the statistical results are consistent with the basic geochemical characteristics of the dataset. These statistical techniques have been used in a variety of marine settings by our research group and are discussed at length in Anderson et al. (Reference Anderson, Murray, Dunlea, Giosan, Kinsley, McGee and Tada2018) and references therein.
QFA determines the minimum number of components necessary to explain a given fraction of total variance in a dataset by identifying groups, or ‘factors’, of co-varying elements (Pisias et al. Reference Pisias, Murray and Scudder2013). Factors undergo a VARIMAX rotation to maintain orthogonal relationships while maximizing the variance explained by each factor. This approach is based on the assumptions that (1) each VARIMAX-rotated factor represents a unique sediment source, and (2) the elements co-varying within each factor are basic indicators of that factor’s representation of a sediment source. The strength of element covariance is indicated by high absolute values of the VARIMAX factor scores, and the importance of each factor in a given sample is the VARIMAX factor loading value. This loading value indicates variation in the importance of a factor throughout the dataset, which in our case means through a sedimentary sequence and thus through time. Only factors that explained greater than 2 % of variance in the dataset were accepted, to avoid the use of insignificant factors unconstrained by analytical precision.
Following the QFA, we use CLS methods to better define the number and general characteristics of bulk sediment factors identified from the QFA. The number of significant factors identified in QFA corresponds to the total number of end-members to be modelled in subsequent CLS iterations. We apply an iterative algorithm to create hundreds of thousands of CLS multiple linear regression models to identify and quantify the best-fit proportion of each potential end-member in each discrete sample (Dunlea & Murray, Reference Dunlea and Murray2015). The CLS code calculates multi-dimensional mixing models to minimize the sum of the squared statistical residuals between a given model and the sample dataset, optimizes the proportions of each end-member in each sample, and tests all possible end-member combinations.
A collection of geologically reasonable source rock geochemical compositions, in the context of the Japan Sea, from a range of literature and reference materials, were compiled to serve as the potential end-member inputs that could ideally correspond to the resulting QFA-defined factors. This collection was developed based on the QFA results as well as characterization from the literature of the palaeoceanographic and geological system of the region. For this study, our end-member collection contains continental material from different areas of the Asian interior, including the Mongolian Gobi Desert (Seir and Olzit Ranges), Chinese Gobi Desert (Gansu Province), Chinese Loess Plateau, Taklimakan Desert (Xinjiang Province, Tarim Basin), recycled Archaean and Palaeozoic crustal material, and volcanic material from the Japanese Arc. Specific end-members and modelling outcomes are discussed in Section 5.2.
Multiple tests were conducted to check the statistical stability of the modelling and to ensure that the identification and composition of the factors were not overly sensitive to the statistical parameterizations, including minor changes in the chemical element menu. As will be described in later sections, we take an approach that groups together equally well-fit end-member outcomes to create compositional ‘families’ to represent regionally sourced materials.
4. Geochemical trends
In this section, we explore the geochemical trends through a first-order assessment of the bulk sediment using graphical partitioning techniques applied to geochemical compositions. In all subsequent geochemical explorations in this section, we use a collection of well-constrained crustal compositions as reference values. Geochemical compositions of post-Archaean Australian Shale (PAAS; Taylor & McLennan, Reference Taylor and McLennan1985), Upper Continental Crust (UCC; Taylor & McLennan, Reference Taylor and McLennan1985), Mid-Ocean Ridge Basalt (MORB; Gale et al. Reference Gale, Dalton, Langmuir, Su and Schilling2013) and Chinese Loess (CL; Jahn et al. Reference Jahn, Gallet and Han2001) are used as comparison compositions to help constrain the overall end-member geochemistry in terms of widely used representative compositions of general continental and oceanic crustal materials. Although these comparison values themselves are geochemically discrete, we do not interpret compositional similarities of the bulk sediment to be exactly these comparison materials. Additionally, we do not interpret compositional similarities between these comparison materials to prescribe source region (e.g. Australian sourcing of PAAS), or define transport mechanism implied by the naming of the material (e.g. aeolian transport of ‘Chinese Loess’, which could also be transported from terrestrial deposits in the Asian interior to the sea by rivers).
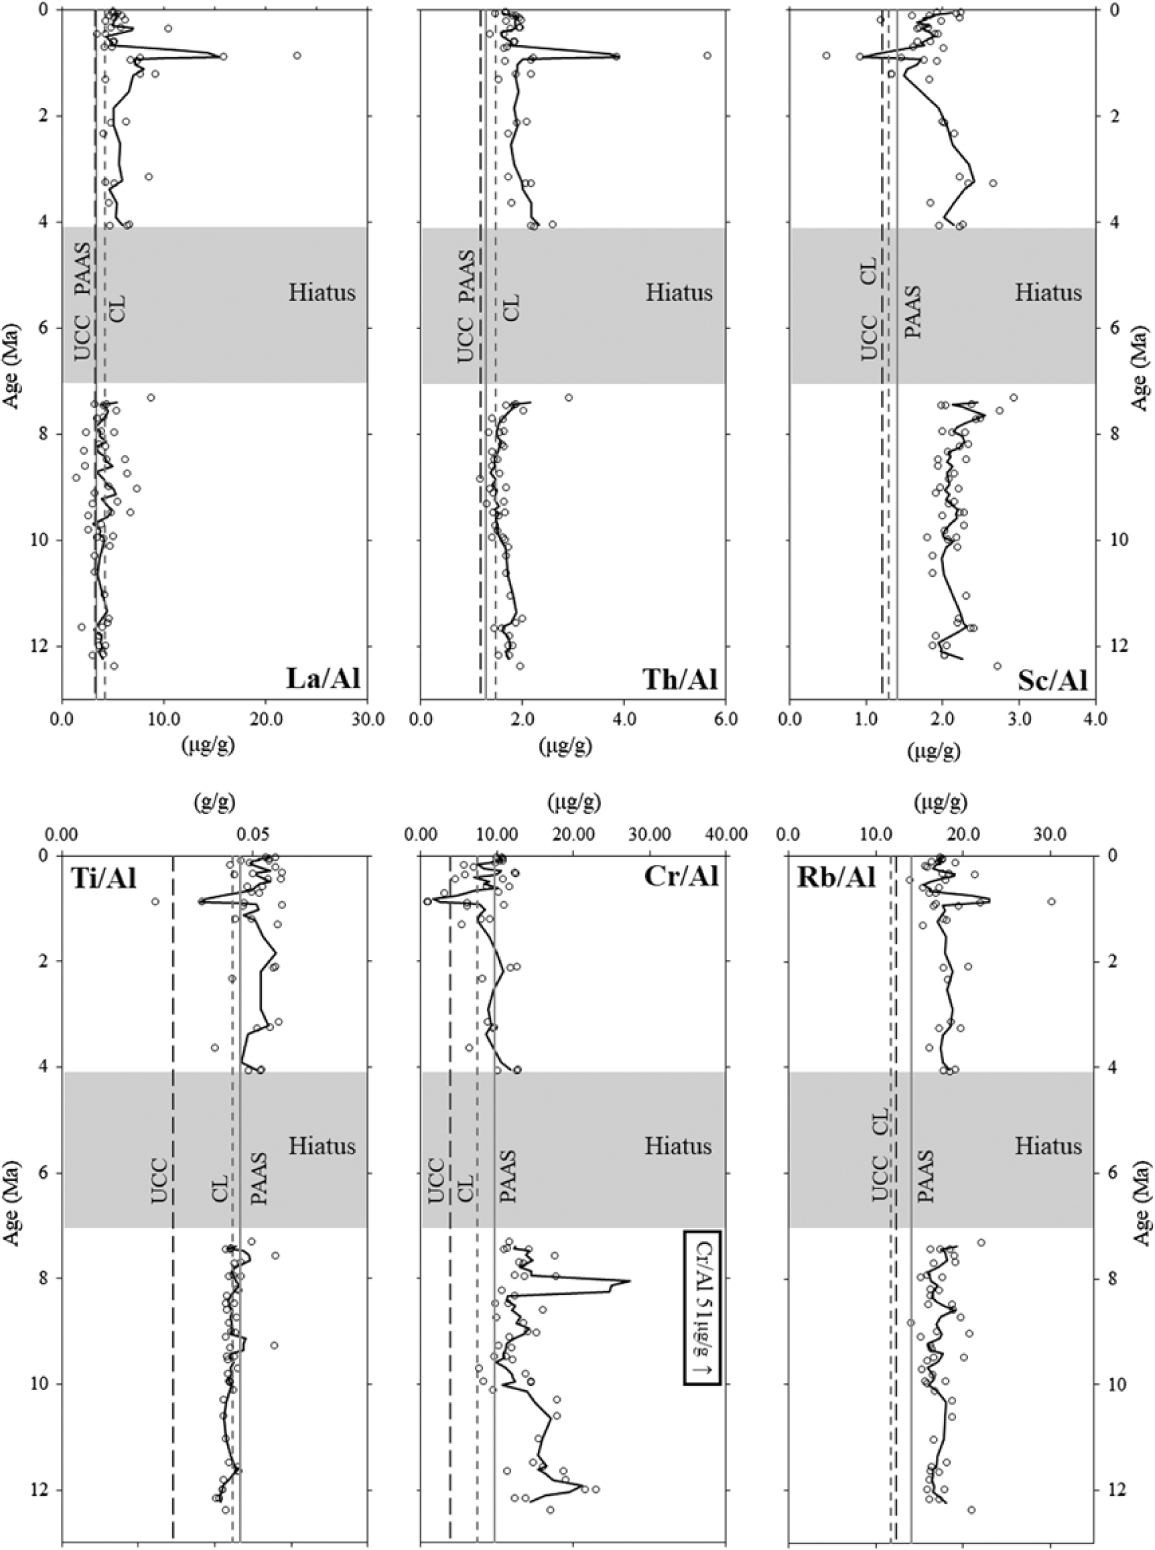
Downhole geochemical profiles indicate that the aluminosilicate component of the bulk sediment at Site U1430 is a mixture of several sources throughout the c. 12 Ma record. The downhole profiles indicate two age-constrained populations, splitting the data into Miocene and Plio-Pleistocene clusters (Fig. 2). Throughout the record the bulk sediment exhibits mixing between compositions broadly similar to the three continental crust comparison materials of PAAS, UCC and CL. Plio-Pleistocene bulk sediment generally plots as CL-type (Th/Al, La/Al) and PAAS-type compositions (e.g. Ti/Al, Sc/Al, Rb/Al), punctuated with periods of the addition of a UCC-type material (e.g. Ti/Al, Sc/Al, Cr/Al). Miocene sediment records a complex mixing history, as some element ratios plot within a single comparison composition field such as PAAS (e.g. Sc/Al, Rb/Al), or CL (e.g. Ti/Al), mixing between PAAS and CL (Cr/Al), or a mixture of all three (e.g. Th/Al, La/Al). The intricate mixing histories between these three representative comparison materials indicate complexity in the system outside of generalized two-component mixing through time. Thus, additional partitioning techniques are required to describe the mixing in a more meaningful way.
Element ratio (g g−1 and μg g−1) age profiles. Comparison values (vertical lines) indicate average values from upper continental crust (UCC), Chinese Loess (CL) and post-Archaean Australian average shale (PAAS) (Taylor & McLennan, Reference Taylor and McLennan1985; Jahn et al. Reference Jahn, Gallet and Han2001). Ratios are presented as discrete samples (open circles) and a three-point moving average of the data (solid line). The arrow pointing to the right in the Cr/Al profile indicates a data point that falls outside of the graphed range, and is included for completeness.

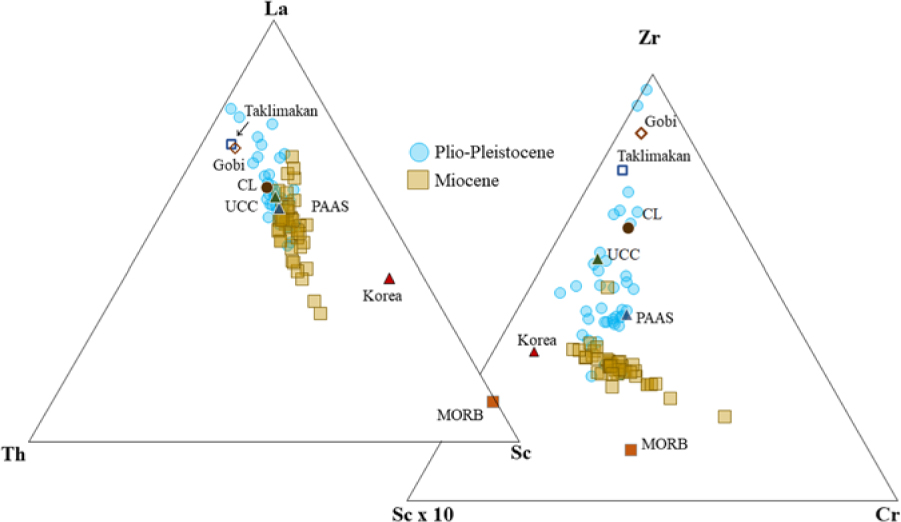
Patterns in ternary space also indicate mixing between a series of aluminosilicates (Fig. 3). In each ternary diagram, the Miocene and Plio-Pleistocene age populations exhibit differences in their trends along mixing lines. For example, Miocene-aged samples trend toward Th and Sc in La–Th–Sc space, while Plio-Pleistocene samples tend toward Th and La, and Miocene-aged samples are offset from the typical felsic–mafic mixing line (e.g. UCC–MORB) observed worldwide in many sedimentary systems, but may reflect the presence of recycled older, more primitive crust(s). Other ternary combinations (e.g. Zr–Rb–Cr, Zr–La–Cr) notably separate Plio-Pleistocene data into multiple clusters, which are also distinct from the Miocene samples (see online Supplementary Material available at https://doi.org/10.1017/S001675681900013X). In Zr–Sc–Cr space, Plio-Pleistocene samples contain a higher proportion of Zr than Miocene samples, and cluster near CL, PAAS, Taklimakan and Gobi material, while Miocene samples form an array between Korean Peninsula material and more mafic compositions (when compared to MORB). Zr–Rb–Cr exhibits a ‘J-shape’ mixing scheme, with Plio-Pleistocene data falling into two populations mixing between a cluster of CL, UCC, Taklimakan and Gobi materials and toward PAAS in compositional space. Miocene samples form a mixing arc between PAAS and MORB. The variety of arrays in these ternary diagrams also indicate multiple complex mixing relationships, yet also clearly identify that these two age populations require several dust compositions to capture variability in the dataset, and the importance of a more mafic end-member. These results provide an important precursor to, and help constrain, the multivariate statistical treatments we apply to the dataset, as described in Section 5.
Bulk sediment samples plotted on ternary diagrams with end-member compositions. La–Th–Sc diagram indicates an offset in the bulk sediment from mixing between mafic and felsic end-members. Zr–Sc–Cr has three population clusters, with Plio-Pliestocene data separated into two clusters, and Miocene data skewed toward Cr.

5. Provenance assessment via multivariate statistics
5.a. QFA results
To target the aluminosilicate fraction of the sediment from Site U1430, we utilized a suite of seven elements. As a matter of principle, elements included in the suite must show high variability within the dataset to be useful discriminants, and must also be present in potential sources (i.e. measured values of the given element exist in the literature). The element menu included Al, Ti, Sc, Cr, Rb, Th and La to avoid biogenic, oxide and non-aluminosilicate sediment sources and also to minimize the influence of redox processes on our models. This element suite has proved useful in other NW Pacific studies to discriminate between terrigenous and volcanic sources (e.g. Ziegler et al. Reference Ziegler, Murray, Hovan and Rea2007; Scudder et al. Reference Scudder, Murray and Plank2009, Reference Scudder, Murray, Schindlbeck, Kutterolf, Hauff and Mckinley2014; Dunlea et al. Reference Dunlea, Murray, Sauvage, Spivack, Harris and D’Hondt2015; Anderson et al. Reference Anderson, Murray, Dunlea, Giosan, Kinsley, McGee and Tada2018), and our use of them here also facilitates comparison to these other relevant studies. Other refractory elements (e.g. Zr, Hf) did not contribute to the capture of the most variability in the dataset and thus are not included. For example, although Zr shows informative patterns in the relevant ternary diagrams, it was not included in the statistical treatments because it did not constrain variability and was not diagnostic during analysis of the dataset. Several iterations of the QFA with this final element suite were conducted, namely with all samples from the record, age population tests (as Plio-Pleistocene and Miocene age populations before and after the hiatus), and subsampled throughout the record. These are discussed in the Supplementary Material available at https://doi.org/10.1017/S001675681900013X.
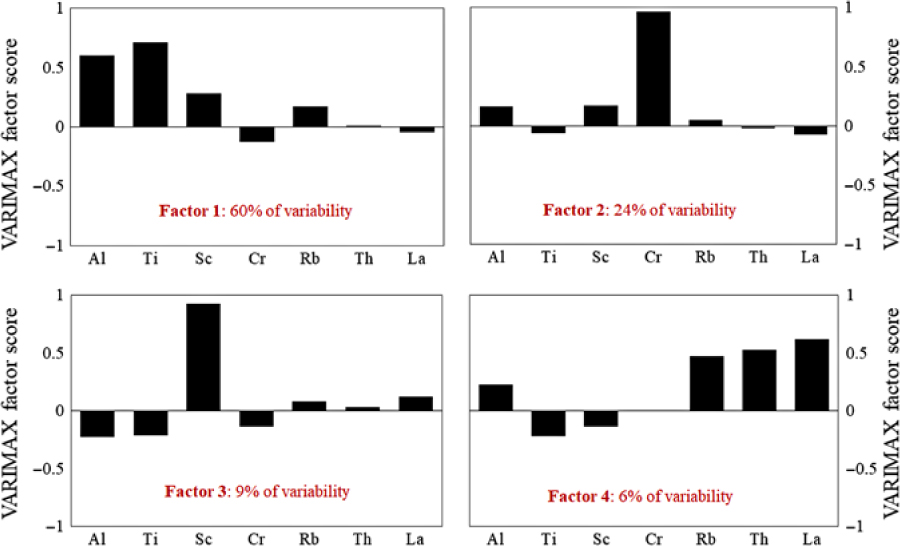
The QFA of the complete dataset resulted in four factors that are required to describe 99 % of the variability in the dataset (Fig. 4). Models with three factors described less than 98 % of the variability, and those with five factors resulted in a fifth factor that described an insignificant amount of variability (i.e. less than 2 %) when the record was considered as a whole. For the four-factor model, Factor 1 emphasizes Al and Ti while explaining 60 % of the variability. The second factor emphasizes Cr and explains 24 % of the data variability. Factor 3 captures Sc and explains 9 % of the variability while the final factor, Factor 4, groups Rb, Th and La, and explains 6 % of the variability in the dataset. Generally, all four factors are broadly similar, indicating the presence of aluminosilicates from several upper continental crust materials with slightly different compositions that mix and dominate the bulk sediment composition. To capture the full range of compositions, however, it is also clear that a more mafic component is required, an important outcome that is also seen in the ternary diagrams (Fig. 3).
VARIMAX-rotated factor scores from QFA statistical analyses. Factors 1, 2, 3 and 4 from QFA statistical analysis are indicative of aluminosilicate provenance. The variability of the dataset explained by each factor is shown in each factor plot. Cumulatively, these four factors explain 99 % of the variability of the dataset. VARIMAX-rotated factor scores for each element are represented by the absolute height of each bar within each factor. The larger the bar (either positive or negative), the more strongly the elements co-vary within each factor.

5.b. CLS results
The four factors identified in the QFA for the whole dataset were used to inform the subsequent CLS multiple linear regressions. We first identified an initial set of c. 200 potential end-members from the literature and the GEOROC database (http://georoc.mpch-mainz.gwdg.de/georoc/). These potential end-members fit the broad geochemical requirements indicated by the QFA and are geographically consistent with the current understanding of atmospheric circulation and potential terrigenous material supply in the region. A full list of tested end-members and their compositions is included in the Supplementary Material (available at https://doi.org/10.1017/S001675681900013X). Then, using the iterative CLS codes of Dunlea & Murray (Reference Dunlea and Murray2015), c. 4 million four-end-member combinations from the 200 potential end-member list were modelled and ranked. We emphasized potential end-members of upper continental material informed by (and including) the PAAS, UCC and Chinese Upper Continental Crust comparison materials, as well as many specific Chinese loesses and regional averages from the Chinese Loess Plateau, Mongolian Gobi, Chinese Gobi, Taklimakan Desert and Japanese and Korean Peninsula crustal components. Additionally, tested materials include mafic sources, such as (generic) MORB, andesites from the Asian interior, geographically possible Japanese regional averages and temporally significant Japanese volcanic material (e.g. Aira, Aso and other tephras). Although successful CLS modelling depends on having well-characterized and appropriate input compositions and we cannot include sources that are not chemically established, we have at the very least included a wide applicable suite of likely representative sources.
Goodness-of-fit parameters were recorded for each CLS model iteration, and the models that had the highest coefficients of determination throughout the elemental suite were identified. By using every possible combination of four end-members, we are able to statistically identify the combinations of potential sources that best fit the data and remove possible source selection bias. Model iterations resulted in several hundreds of best-performing combinations. Of the top 500 models, the best were ranked based on their sum of coefficients of determination (i.e. of each element, being sure to not allow one element’s fit, if an outlier, to overly influence the importance of total).
From the top 50 models, groups of similar end-members were considered as composite end-member families. In the top-performing models, the end-members consistently included Taklimakan Desert, Chinese Loess, Gobi Desert and Korean Peninsula materials. Each of these end-members, or materials from these regions, was present in the top models in all tests, and these were thus selected as being the best representation of the bulk sediment. We acknowledge that sediments in these regions represent many different patterns in surficial weathering, local catchments, changing drainage basins and other factors, and materials from some basins may better represent average compositions from these regions as a whole. Care was taken to ensure that materials in models are as representative as possible of the possible source regions. Additional details can be found in the Supplementary Material (available at https://doi.org/10.1017/S001675681900013X).
5.b.1. Taklimakan Desert end-member
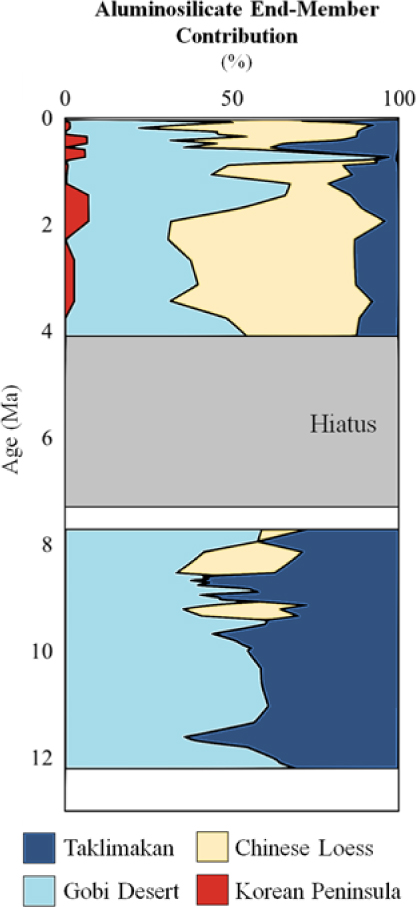
Models with Taklimakan Desert materials in the end-member menu consistently produced model outcomes with the highest goodness-of-fit. This end-member is composed of a collection of 17 granitic and plutonic materials from Xinjiang Province, China, including the Tarim and Junggar Basins (Supplementary Material available at https://doi.org/10.1017/S001675681900013X). The Taklimakan end-member exhibits variability in its contribution over the entire record at Site U1430 (Fig. 5). From c. 12 Ma until 7 Ma, the Taklimakan end-member contributes 28–65 wt % of the relative aluminosilicate contribution, with notable decreases in contribution between 11.5 and 10 Ma, at 9 Ma and at 8 Ma. The relative contribution of the Taklimakan component decreases in contribution from 4.5 Ma towards the present, with local maxima/minima throughout the overall decrease.
Aluminosilicate contribution (wt % of aluminosilicate inventory) at Site U1430 through time. The end-member contributions are plotted as the total sum, with each colour representing the sum of the specific end-member plus the end-members to the left. The shaded region denotes a hiatus, and the following box notes a period in which we did not over-interpret our data to fill the temporal gap between the end of the hiatus and the start of our Miocene-aged samples.

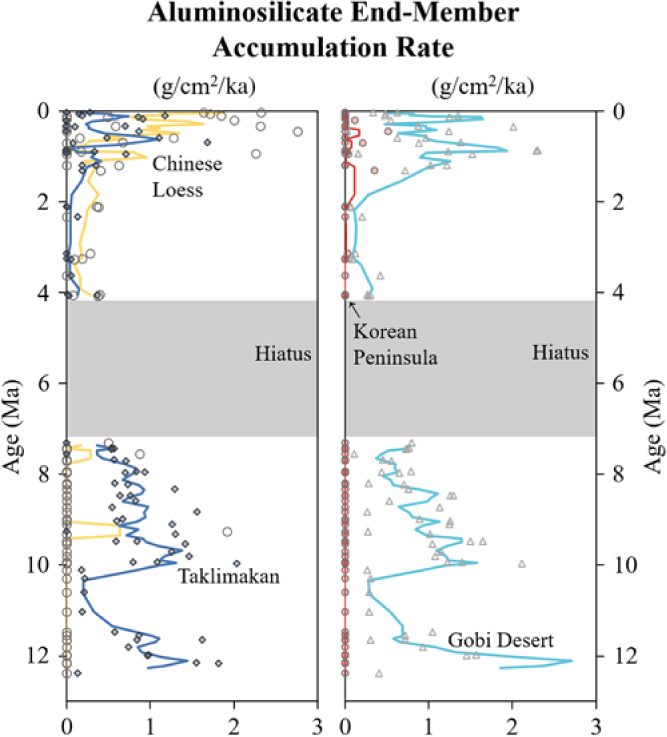
The Taklimakan component accumulation exhibits several periods of increased flux (Fig. 6). During the Miocene, the Taklimakan component reaches maximum accumulation rates of 1.0–1.4 g cm−2 ka−1, occurring at 11.6 and 9.7 Ma respectively, before decreasing to 0.4 g cm−2 ka−1 by 7.3 Ma. The Taklimakan component flux decreases to 0.13 g cm−2 ka−1 following the hiatus, before increasing to a local maximum of 0.4 g cm−2 ka−1 by 1.1 Ma. By 0.6 Ma, the Taklimakan component increases again to 1.1 g cm−2 ka−1, and exhibits variable accumulation rates towards the present.
Aluminosilicate mass accumulation rates (MAR) of the four end-members identified by CLS models of aluminosilicate sediment provenance (Taklimakan, dark blue; Chinese Loess, yellow; Gobi, light blue; Korean Peninsula, red). End-member MARs are plotted as three-point moving averages (lines) and discrete sample accumulation rates (points). The shaded region denotes a hiatus.

5.b.2. Gobi Desert end-member
A Gobi Desert end-member is also ubiquitous in all the best-performing models. The Gobi Desert end-member consists of 33 broadly granitic materials sourced from Gansu Province, China, and the Mongolian interior (Supplementary Material available at https://doi.org/10.1017/S001675681900013X). During the Miocene, the Gobi component contributes 35–70 % of the aluminosilicate fraction, and decreases in contribution from 10 Ma to the hiatus at 7.3 Ma. Following the hiatus, the contribution of the Gobi end-member varies toward the present, and reaches its maximum contribution at 0.7 Ma as the dust component is mixed into a pumice layer and is coincident with a section of high sedimentation rate due to this ash fall. During the Miocene, the Gobi component exhibits fluxes between 0.1 and 2.1 g cm−2 ka−1, and decreases toward 7.3 Ma.
5.b.3. Chinese Loess
The third component is represented by the composition of generic Chinese Loess established by Jahn et al. (Reference Jahn, Gallet and Han2001). This component is low in contribution and flux during the Miocene, but increases in the Pleistocene. This end-member is often not present during the Miocene, except for at c. 9.4 Ma and 8.3 Ma when brief pulses of CL reach c. 30 % contribution. Chinese Loess increases in contribution following the hiatus from 4.5 Ma toward the present. Contribution by the Chinese Loess end-member is highly variable in the Pleistocene, contributing 4–75 % of the aluminosilicate fraction when present. During the Pliocene, Chinese Loess contributes c. 23–60 % of aluminosilicates. The Chinese Loess accumulation rate ranges between 0.06 g cm−2 ka−1 and its maximum value of 1.9 g cm−2 ka−1 during the Pleistocene. During the Miocene, this component exhibits local maxima in accumulation rate of 0.6 g cm−2 ka−1 at c. 9.4 Ma, and 0.3 g cm−2 ka−1 at 8.3 Ma.
5.b.4. Korean Peninsula
The final end-member, a Korean Peninsula material composite, is necessary to best-fit a model of the entire dataset despite its low contribution. This composite consists of a collection of 23 materials from the Korean Peninsula, including more mafic materials from the Okcheon Volcanic Belt and other volcanic fields, South Korean basalts and andesitic basalts, and fulfils the geochemically prescribed mafic component mentioned earlier (Supplementary Material available at https://doi.org/10.1017/S001675681900013X). The contribution of the Korean Peninsula end-member increases toward the present, is small in contribution and presents low accumulation rates, but is unmistakably present during the Plio-Pleistocene. During the Miocene, this end-member is not present. During the Plio-Pleistocene, the maximum accumulation rate fluctuates between 0.04 g cm−2 ka−1 (3 Ma) and a maximum of 0.5 g cm−2 ka−1, which occurs at c. 400 ka.
6. Provenance history of the Ulleung Basin
Global cooling, uplift and formation of the Himalaya and Tibetan Plateau, and evolution of the Japan Sea and its associated depositional basins may each in part contribute to variability in the composition and flux of the aluminosilicate components at Site U1430. Each of these mechanisms may impart feedbacks on the others, and they may not be mutually exclusive influences on the creation, transport and final deposition of aeolian material to marine sediment archives. From this dataset alone, it is challenging to separate the influence of just one mechanism on the changes in dust provenance and flux, as climate and tectonic processes were likely operating in concert, although on different scales, throughout the last 12 Ma.
Nonetheless, our data clearly indicate that four aluminosilicate sources contribute material to the bulk sediment at Site U1430. All four of these components are generally similar in geochemical composition, as three capture different aluminosilicate sources while one is relatively more mafic, but we reiterate that four distinct components are statistically required by the QFA and CLS approaches. These four components are Taklimakan Desert (28–65 % of total aluminosilicates), Gobi Desert (35–75 % of aluminosilciates), Chinese Loess (23–60 % of aluminosilicates) and Korean Peninsula material (6–7% of aluminosilicates).
Of these four end-members, to reach the Ulleung Basin from the central Asian desert regions, aeolian transport is the most probable mechanism for three of them (that is, Taklimakan, Gobi and generic Chinese Loess). We reiterate, however, that our statistical methods themselves do not differentiate depositional pathway as direct aeolian deposition or, alternatively, as fluvial delivery (or remobilization from initial deposition elsewhere) of loess, volcanic material or other aluminosilicates. We therefore emphasize that specifying a uniquely aeolian pathway for those three end-members is an interpretation based (only) on the most likely transportation mechanism. We discuss ambiguities or constraints in this interpretation where appropriate in the following discussions, and suggest that further study in this region could address potential differences in transport processes.
6.a. Miocene provenance
During the late Miocene, our models suggest that the majority of aluminosilicates at Site U1430 were sourced from the Taklimakan, but were punctuated by a few periods of increased contribution and flux from other sources. From the beginning of the record at c. 12 Ma, the Taklimakan and Gobi Deserts together supplied c. 50–60 % of aluminosilicates during the Miocene. The formation of the Taklimakan Desert may have initiated in the late Oligocene, and continued to expand and form dust as mountain-building events and global cooling continued (An et al. Reference An, Kutzbach, Prell and Porter2001; Zheng et al. Reference Zheng, Wei, Tada, Clift, Wang, Jourdan, Wang and He2015). The start of the Site U1430 record is coincident with a period when Tibetan Uplift and global cooling likely worked in tandem, increasing aridification in central Asia at c. 11.8 Ma (Shen et al. Reference Shen, Wan, France-Lanord, Clift, Tada, Révillon, Shi, Zhao, Liu, Yin, Song and Li2017). Assuming an aeolian transport of this Taklimakan and Gobi material, the presence of Taklimakan material is consistent with terrestrial Chinese Loess Plateau provenance studies that have indicated that the Taklimakan has been a major dust source to the plateau since the Late Miocene (Sun, Reference Sun2002; Ma et al. Reference Ma, Sun, Tada, Yan, Chen, Lin and Nagashima2015), and to the sediment of the Japan Sea into the Quaternary (Irino & Tada, Reference Irino and Tada2002; Nagashima et al. Reference Nagashima, Tada, Matsui, Irino, Tani and Toyoda2007). Other stony desert regions may have served as potential short-term reservoirs for Taklimakan material as dusts were transported step-wise from the western extent of the Asian interior out to sea (Sun, Reference Sun2002).
The first, albeit relatively short-lived, provenance shifts at Site U1430 occurred at c. 8 and 9 Ma. Increases in the Chinese Loess contribution occur during a time when the total aluminosilicate flux is still relatively high (1.3–2.0 g cm−2 ka−1), but steadily decreasing toward the Pliocene. This increase in Chinese Loess is coincident with a period of rapid drying seen in higher-resolution records in the region at c. 8 Ma, which has been attributed to older uplift events of the Tibetan Plateau (Wang et al. Reference Wang, Clemens, Beaufort, Braconnot, Ganssen, Jian, Kershaw and Sarnthein2005; Shen et al. Reference Shen, Wan, France-Lanord, Clift, Tada, Révillon, Shi, Zhao, Liu, Yin, Song and Li2017), or solely by global cooling and strengthening of the East Asian Winter Monsoon (Zhang et al. Reference Zhang, Lu, Stevens, Feng, Fu, Geng and Wang2018b). Thus, our data clearly indicate that the change(s) in the composition of the inferred aeolian mixture(s) is coincident with change(s) in their flux, and indicates that the generation and transport of aeolian material is highly dynamic, and does not solely represent a geographic change in source or a simple change in regional aridity alone.
6.b. Plio-Pleistocene provenance
The transition from the Miocene into the Plio-Pleistocene marks the most significant provenance shift at Site U1430. Throughout most of the Miocene portion of the record, the Taklimakan component contributed 50–60 % of all aluminosilicates while decreasing in MAR from 1.8 g cm−2 ka−1 to 0.4 g cm−2 ka−1 toward the Pliocene. The Taklimakan component continued to decrease in contribution (between 4 and 35 %) and MAR (between 0.05 g cm−2 ka−1 and 1 g cm−2 ka−1 when present) for the remainder of the Plio-Pleistocene. Following the hiatus, Chinese Loess and Gobi materials increasingly contribute material, collectively contributing 80–90 % of the total aluminosilicate load, resulting in 1.8 g cm−2 ka−1 MAR of Chinese Loess and 1.6 g cm−2 ka−1 MAR of Gobi in the Pleistocene. This increase is strongly coincident with an increase in the illite/smectite ratio at Site U1430 (Shen et al. Reference Shen, Wan, France-Lanord, Clift, Tada, Révillon, Shi, Zhao, Liu, Yin, Song and Li2017), previously interpreted as the intensification of Asian aridification. The increase in aridification as well as the increase in the supply of Chinese Loess and Gobi materials, suggests a link to the continued aridification of Asia, despite the relative warming during the Pliocene.
By 3.4 Ma, Chinese Loess contributed one-half of the absolute amount of aluminosilicate flux, but this occurred during a period of relatively low overall total aluminosilicate flux. During this time, Chinese Loess reached a maximum flux of 0.18 g cm−2 ka−1, out of a total flux of 0.5 g cm−2 ka−1, and increased in contribution to 65 % of total aluminosilicate flux by 2 Ma. At this time the Gobi component was relatively small, before a large increase in contribution and flux from c. 1.5 Ma to its maximum at 0.7 Ma. The increase of the Gobi component occurs during a period in which the total aluminosilicate flux is increasing rapidly from a minimum of 0.25 g cm−2 ka−1 in the Pliocene to increasingly large (2.0–3.1 g cm−2 ka−1), but variable accumulation rates persist through the Pleistocene. The increase in Gobi materials at this time may be attributed to increased drying in the Mongolian steppe region often attributed to enhanced global cooling, as well as increased climate variability and instability in the Quaternary (Shen et al. Reference Shen, Wan, France-Lanord, Clift, Tada, Révillon, Shi, Zhao, Liu, Yin, Song and Li2017; Yan et al. Reference Yan, Ma and Sun2017).
In addition to the inferred dust components in this record, consistent flux of Korean Peninsula material emerged at c. 3 Ma. The low flux and appearance of the Korean Peninsula component may be linked to the opening of the Tsushima Strait at c. 3 Ma (Gallagher et al. Reference Gallagher, Kitamura, Iryu, Itaki, Koizumi and Hoiles2015). At present the Tsushima current branches into several currents that flow northward along the Korean Peninsula and Japanese Archipelago on either side of the Japan Sea (Fig. 1). As the Tsushima Strait opened, the establishment of the Tsushima current may have served as a mechanism for relatively locally derived fluvial material transported from the Korean Peninsula and hindered the contribution of fluvial Japan-derived materials into the Ulleung Basin.
7. Asian dust supply to the Pacific
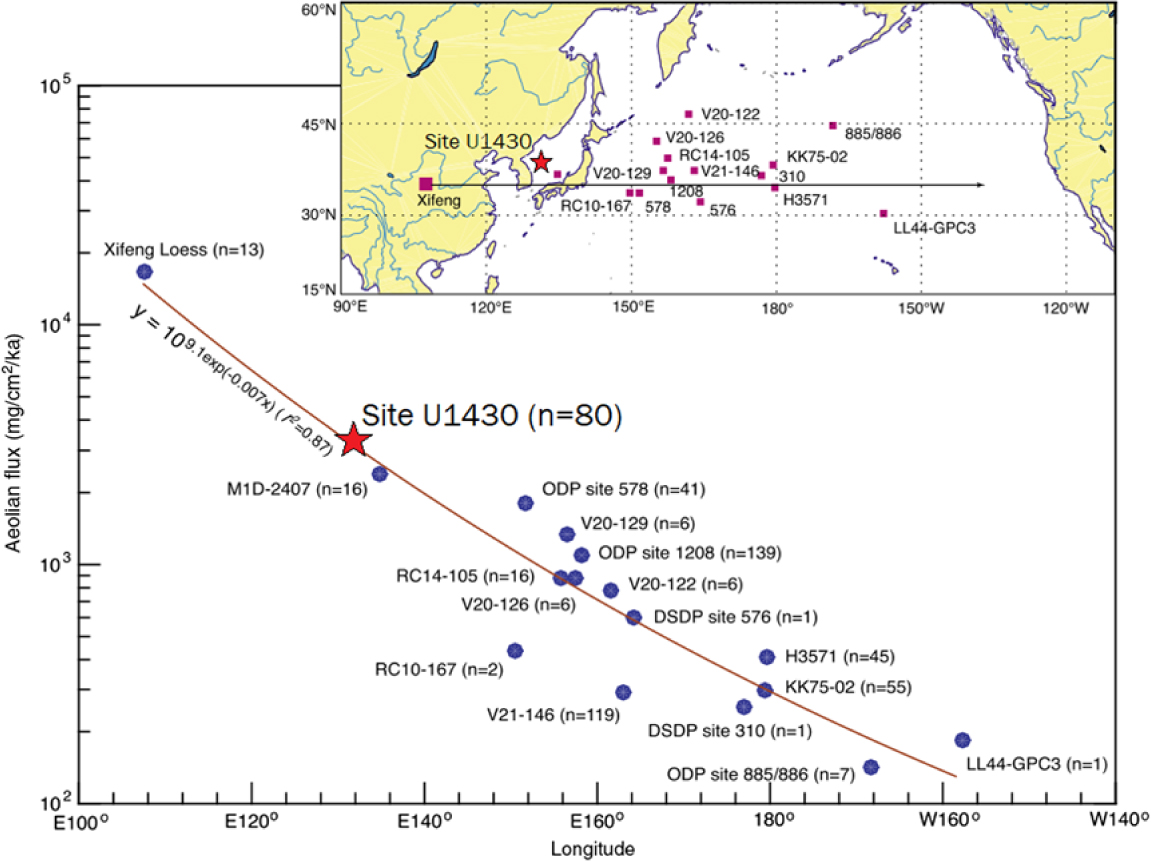
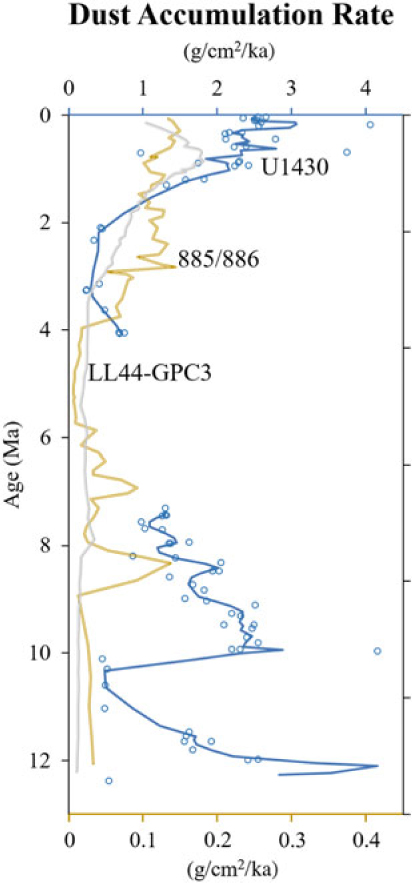
The provenance and flux trends seen at Site U1430 broadly agree with records elsewhere in the North Pacific region, and also provide additional insight into the late Cenozoic evolution of dust inputs from Asia. For example, the record of total dust flux (calculated as the sum of Taklimakan, Gobi and Chinese Loess accumulation rates) at Site U1430 reaches maximum values of 2–3 g cm−2 ka−1 during the Miocene and Pleistocene, respectively (Fig. 8). These fluxes are consistent with those reported in the region during glacial periods (Nagashima et al. Reference Nagashima, Tada, Matsui, Irino, Tani and Toyoda2007) and also fit well into the regional/global understanding of relative dust flux as a function of distance from source. For example, as noted by Zhang et al. (Reference Zhang, Chen, Ji and Li2016), the total flux of dust in the Pacific decreases exponentially with distance from the source regions in central Asia (Fig. 7). When the maximum fluxes from Site U1430 are considered, the Quaternary fluxes of c. 3000 mg cm−2 ka−1 are aligned with predicted values estimated by Zhang et al. (Reference Zhang, Chen, Ji and Li2016) and the eastward decrease in total flux across the Pacific. Zhang et al. (Reference Zhang, Chen, Ji and Li2016) also note that in distal systems, the Taklimakan Desert is a likely source, as fine-grained material is entrained into the Westerly Jet and transported long distances aloft. Our work here further supports that during the early stages of evolution of the East Asian Monsoon, the bulk of the dust supply is derived from the Taklimakan Desert, and it is this source that provides dust to the rest of the Pacific archives as well, as a general signal of central Asian aridification.
Aeolian fluxes in the North Pacific versus distance from Asia (as degrees longitude) in the Quaternary. Site U1430 (this study) is denoted by the red star. Adapted from Zhang et al. (Reference Zhang, Chen, Ji and Li2016).

Aeolian fluxes to the North Pacific through time. Dust accumulation rates from Site U1430 (top axis; blue line denotes a three-point moving average, discrete samples by open circles; this study), Site 885/886 (bottom axis; double gold line; Rea et al. Reference Rea, Snoeckx and Joseph1998) and LL44-GPC3 (bottom axis; grey line; Kyte et al. Reference Kyte, Leinen, Ross Heath and Zhou1993) are plotted to compare trends in dust flux through time across the Pacific.

Being able to differentiate exactly which geographic sub-region of the broadly referenced ‘Asia’ is supplying dust is important, because it allows more precise determination of the location of the Westerly Jet as well as, perhaps, an improved understanding of the hydrology of the Asian interior. Our record is consistent with records of increased Plio-Pleistocene dust flux due to aridification in the distal Pacific, as discussed by Kyte et al. (Reference Kyte, Leinen, Ross Heath and Zhou1993), Rea (Reference Rea1994) and Rea et al. (Reference Rea, Snoeckx and Joseph1998). In the last 4 Ma, distal Pacific records exhibit increased dust flux at c. 3–4 Ma; Site U1430 has a younger large increase in total dust flux around 2 Ma (Fig. 7). The low dust flux in the late Pliocene may be attributed to possible localized winnowing effects, or sediment remobilization during sea-level lowstands specific to this site during this time, as there is a hiatus from 4.1 to 7.3 Ma and similar hiatuses are not seen at other sites from Expedition 346 (Kurokawa et al. Reference Kurokawa, Tada, Matsuzaki, Irino and Lofi2019). Following the hiatus at Site U1430, Pliocene total dust flux is low (c. 0.25–0.75 g cm−2 ka−1), before increasing to 3.1 g cm−2 ka−1 in the Pleistocene during a time of global cooling and drying (Shen et al. Reference Shen, Wan, France-Lanord, Clift, Tada, Révillon, Shi, Zhao, Liu, Yin, Song and Li2017). During the Miocene, both LL44-GPC3 (Kyte et al. Reference Kyte, Leinen, Ross Heath and Zhou1993) and ODP Sites 885/886 (Rea et al. Reference Rea, Snoeckx and Joseph1998) exhibit lower aeolian fluxes of an undefined generic fine-grained continental material, whereas we are able to tease apart discrete source regions such as the Taklimakan and Gobi Deserts. Site U1430 total dust fluxes decrease during the Miocene from c. 3 g cm−2 ka−1 to 1 g cm−2 ka−1 before the hiatus, despite exhibiting earlier increased flux in the Miocene than other records in the Pacific. This difference in the onset of total aluminosilicate flux may be tied to localized sediment remobilization in this marginal sea. Notably, the period of decreased flux at Site 885/886 during the Miocene to Pliocene transition coincides with the hiatus seen at Site U1430 in the Japan Sea.
8. Summary and conclusions
In this study we analysed major, trace and rare earth elements in 80 bulk sediment samples from IODP Site U1430 in the Ulleung Basin, in the Japan Sea. We applied multivariate partitioning analyses to identify and quantify four aluminosilicate sediment source components in these sediments. Our results indicate that Taklimakan and Gobi Deserts, Chinese Loess and Korean Peninsula components comprise the significant end-members contributing material to the Ulleung Basin. Step-wise aridification of the Asian continent driven by Cenozoic global cooling and by periodic uplift of the Tibetan Plateau influenced the source regions and aeolian fluxes to Site U1430. The Taklimakan Desert was the likely dust source to the Pacific during the early stages of East Asian Monsoon development. Continued uplift of the Tibetan Plateau in the Pliocene may have influenced continued aridification and therefore increased flux from the Gobi Desert and Chinese Loess Plateau into the Pleistocene, while the opening of the Tsushima Strait influenced palaeoceanographic currents to capture Korean Peninsula material in the Ulleung Basin since c. 3 Ma.
By utilizing this multi-proxy approach, it is possible to elucidate discrete dust sources from Asia. Through the combination of geochemistry and multivariate statistics, it is possible to differentiate the most probable dust sources to previously published North Pacific dust records (e.g. Hovan et al. Reference Hovan, Rea and Pisias1991; Rea et al. Reference Rea, Snoeckx and Joseph1998; Ziegler et al. Reference Ziegler, Murray, Hovan and Rea2007) to aid interpretation of regional-scale aridification and global-scale cooling. With continued progress in determination of aeolian provenance, we can also improve reconstructions and interpretations of continental margin deposits over shorter time frames (e.g. Anderson et al. Reference Anderson, Murray, Dunlea, Giosan, Kinsley, McGee and Tada2018).
Supplementary material
To view supplementary material for this article, please visit https://doi.org/10.1017/S001675681900013X
Author ORCIDs
CH Anderson, 0000-0003-1141-3559; CW Kinsley, 0000-0002-3185-520X
Acknowledgements
We thank Shiming Wan for valuable conversations about this site and sharing the developments of his own ongoing research. The constructive suggestions from external reviewers also improved the manuscript in several notable aspects. We also express our appreciation to T. Ireland for analytical assistance at Boston University, and to A. Braunthal and E. Shonshine for their help in the lab. This research is based on samples provided by the Integrated Ocean Drilling Program (IODP). Funding for this research was provided by the US National Science Foundation to R.W.M. (NSF-EAR1434175), L.G. (NSF-EAR1433665) and D.M. (NSF-EAR1434138). United States Science Support Program (USSSP) post-cruise support was provided to Expedition 346 shipboard participants R.W.M., A.G.D., L.G., C.W.K. and R.T. Portions of this research were completed while R.W.M. was serving at the National Science Foundation. The data generated and used in this study are included in the supporting materials.
Declaration of interest
None.