Introduction
No-tillage (NT) production systems are recognized as a means of reducing soil erosion, conserving soil water, promoting more efficient use of labor and machinery, and decreasing or eliminating the need for chemical inputs such as pesticidesReference Uri1, Reference Johnson and Hoyt2. Though the majority of acreage currently under NT is in row crop production, studies suggest that NT practices can also be advantageous in vegetable productionReference Abdul-Baki, Morse, Devine and Teasdale3–Reference Hoyt, Monks and Monaco5. Given that consumer demand for organic foods has grown consistently between 15 and 20% annually since 19976, the development of NT organic vegetable production systems will support growers seeking to optimize both biological and economic productivity.
A common feature of NT systems is the incorporation of cover crops. Cover crops have been shown to reduce soil erosionReference Hartwig7, limit runoff and surface water pollutionReference Hall, Hartwig and Hoffman8, improve soil physical propertiesReference Lal, Regnier, Eckert, Edwards, Hammond and Hargrove9, and influence soil fertility by providing a source of N for subsequent cropsReference Hoyt and Hargrove10 and capturing soil mineral N to prevent loss to leachingReference Ranells and Wagger11. Many cover crops also have the capacity to suppress weedsReference Creamer, Bennett, Stinner and Cardina12, Reference Weston and Duke13, disrupt pest and disease cyclesReference Hartwig and Ammon14, and suppress nematode populationsReference McSorley, Dickson, de Brito and Hochmuth15, Reference Mojtahedi, Santo and Ingham16, providing alternative strategies to chemical inputs for pest management in organic systems. A significant impediment to organic NT vegetable production is the effectiveness of mechanical strategies to kill cover crops prior to cash crop production.
In the southeastern United States, summer annual cover crops may be rotated between spring and fall production seasons in NT vegetables. In a study by Abdul-Baki et al.Reference Abdul-Baki, Morse, Devine and Teasdale3, comparable yields of fall broccoli were achieved between a conventional tillage (CT) system and an NT system utilizing mulches of forage soybean and foxtail millet that had been killed by flail mowing. MorseReference Morse17 examined the potential of foxtail millet, soybean and cowpea cover crops in monoculture and grass–legume bi-culture to provide weed suppression and sufficient N for organically grown fall broccoli. This study found that yields were higher under NT cover crop mulch compared to NT bare soil; however, both N and weed management were yield limiting in organic broccoli. The cover crop species were successfully killed by rolling and flail mowing.
Another potential summer cover crop for organic NT vegetable production is sorghum sudangrass (SS). As a cover crop, this species has the potential to produce abundant biomassReference Creamer and Baldwin18, suppress weeds through physical and chemical interferenceReference Creamer and Baldwin18, Reference Weston, Harmon and Mueller19 and decrease soil compactionReference Wolfe, Riggs, Abawi, van Es, Stivers-Young and Pederson20. Creamer and DabneyReference Creamer and Dabney21 reported that SS is difficult to kill using mechanical methods such as mowing, undercutting and rolling, a potential drawback to its inclusion in rotation with NT organic vegetables. As a commonly cultivated forage crop for grazing, hay or silageReference Chamblee, Green, Burns, Chamblee and Green22, the species also presents the opportunity for dual application as both cover crop and hay crop.
Growing consumer demand for organic meat, eggs and dairy products has led to increased demand for organic hay, which typically garners a premium of 10–20%. Incorporating a cover crop such as SS that can be harvested and sold on the organic hay market may provide an economic benefit to growers.
The objectives of this study were:
1. To assess the impact of removing a single cutting of SS biomass for hay on its weed suppressive qualities in CT and NT fall vegetable production.
2. To determine if increasing cutting frequency can improve SS response to mechanical kill by mowing.
3. To examine the production risks introduced by a SS cover crop grown immediately before a cash crop.
Materials and Methods
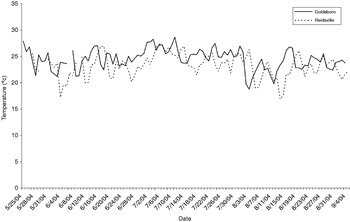
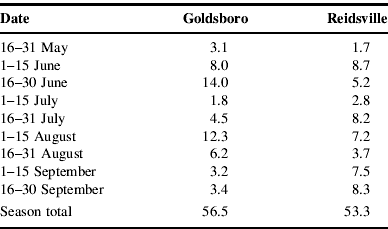
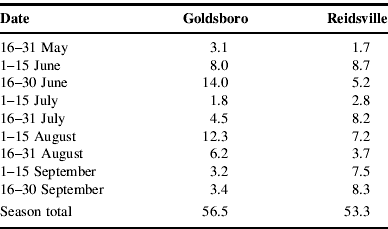
Field experiments were conducted in 2004 at two locations: the Center for Environmental Farming Systems (CEFS) in Goldsboro, North Carolina and the Upper Piedmont Research Station (UPRS) in Reidsville, North Carolina. While it can be viewed as preferable to perform the same experiment during two separate years at the same site to take advantage of weather variability, rainfall and temperature differences between the two experimental locations (Fig. 1 and Table 1) were greater than they may have been at the same site over 2 years. The sites are approximately 240 km apart and located in two distinct ecoregions of North Carolina. At Goldsboro, the experiment was conducted on Wickham loamy sand, a thermic Typic Hapludult, with 0–2% slope (WhA), and in Reidsville, on Vance sandy loam, also a thermic Typic Hapludult, with 0–2% slope (VaB).
Average daily air temperature from 25 May to 7 September 2004, at Goldsboro and Reidsville, NC.

Rainfall totals (cm) from 16 May to 30 September 2004 in Goldsboro and Reidsville, NC.
Experimental design
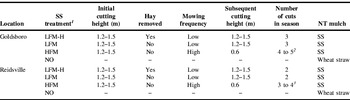
At each location, this experiment employed a split-plot experimental design with whole plots in four replicates in a Latin Square arrangement. SS cover crop management treatments served as the main plots and tillage treatment as the split plots. After an initial mowing operation was performed uniformly in all plots, three SS management treatments were applied: (1) hay biomass removed from the field, subsequent low-frequency mowing (LFM-H); (2) hay biomass left in the field, subsequent low-frequency mowing (LFM); (3) hay biomass left in the field, subsequent high-frequency mowing (HFM). Treatment four was a no cover crop control (NO) (Table 2).
Sorghum sudangrass (SS) management treatments applied at Goldsboro and Reidsville, NC in 2004.

1 LMF-H, low-frequency mowing, hay removed; LFM, low-frequency mowing, hay not removed; HFM, high-frequency mowing, hay not removed; NO, no SS cover crop.
2 In Goldsboro, tilled sub-plots were cut 4 times and NT sub-plots were cut 5 times due to 2-week difference in time of final kill.
3 In Reidsville, tilled sub-plots were cut 3 times and NT sub-plots were cut 4 times due to 2-week difference in time of final kill.
Cover crop management
On 25 and 27 May 2004, 4×6 m (12.75×20 ft) plots were established in Goldsboro and Reidsville, respectively. Prior to planting, 112 kg N ha−1 (100 lb A−1) as soybean meal and 2.2 kg B ha−1 (2 lb A−1) were broadcast and incorporated at each field site. Untreated SS ‘Haychow’ (Hall Seedway, Hall, NY) was seeded at a rate of 35 kg ha−1 (40 lb A−1) using a Sukup drill (Sukup Manufacturing Company, Sheffield, IA) in Goldsboro and Bush Hog® 7690 drill (Bush Hog®, LLC, Selma, AL) in Reidsville. At 36 (Goldsboro) and 40 (Reidsville) days after planting, the crop had reached a height of 1.2–1.5 m, and the first mowing operation was conducted using a flail mower. SS clippings were removed from LFM-H plots using hand rakes to simulate removal of cover crop biomass as hay. The stubble height was 7.5–10.0 cm (3–4 in) for the first cutting operation to encourage re-growth. Stubble height in all subsequent mowing events, also performed with a flail mower, was 2.5–5.0 cm (1–2 in). Additional cutting operations in each plot were conducted each time the crop again reached a height of 1.2–1.5 m in both LFM treatments or a height of 0.6 m in HFM plots (Table 2).
Prior to transplanting fall cabbage, each whole plot was split into two sub-plots: CT and NT. CT sub-plots were mowed for the final time approximately 2 weeks before transplanting fall cabbage and tilled twice with a rototiller before transplanting in order to incorporate SS residues. CT sub-plots in the control treatment were subject to the same tillage regime. Emerged weeds were removed from CT sub-plots immediately prior to the transplanting operation by flame weeding (Goldsboro) or tillage (Reidsville). NT sub-plots were mowed with a flail mower to a stubble height of 2.5–5.0 cm immediately prior to the transplanting operation. In addition, glyphosate (N-phosphonomethyl glycine) was applied to NT sub-plots in the control treatment 2 weeks prior to transplanting in order to eliminate weeds that had emerged during the summer without disturbing the soil prior to the application of wheat straw mulch. This control was designed to differentiate effects of tillage from those of SS residues on weed suppression and was not intended to provide evaluation of organic weed management. For experimental purposes, it was necessary to begin the comparison of tillage and SS residues in sub-plots free of existing summer weeds, and glyphosate was considered an appropriate research tool to achieve these conditions. Wheat straw mulch was applied to the NT control immediately following cabbage transplanting at a rate equal to the total SS biomass produced in LFM treatment plots. Though known to contain allelochemicals, no detrimental effects of wheat straw mulch on transplanted vegetables have been reportedReference Wu, Pratley, Lemerle and Haig23 and in previous studies wheat straw mulch on transplanted tomatoes did not reduce yield when surface appliedReference Monks, Monks, Basden, Selders, Poland and Rayburn24, Reference Drost and Price25.
Cabbage planting
Cabbage (cv. Bravo) transplants were set by hand on 9 August 2004 in Reidsville and using a sub-surface tiller transplanter (S-STT) on 3 September 2004 in Goldsboro. Cabbage was used as a test crop to determine production potential and examine possible negative impacts of SS and tillage management on crop development. Each sub-plot contained a single row of cabbage 6 m in length with an in-row spacing of 35 cm (16 plants plot−1). An Organic Materials Review Institute (OMRI)-reviewed 4-2-4 fertilizer (Fertrell Feed-N-Gro, Bainbridge, PA) was applied at the recommended rate of 2800 kg ha−1 (2500 lb A−1) at transplanting to provide 112 kg N ha−1 (100 lbs N A−1). Stand counts were recorded for each sub-plot at 1 and 2 weeks after transplanting (WAT) cabbage, and missing and dead plants were replaced. Pest management included weekly applications of capsaicin [commercially available as Miller Hot Sauce (Miller Chemical, Hanover, PA)] during the first 5 weeks of growth to deter mammalian pests. Xentari (Bacillus thuringiensis) was applied as needed based on weekly scouting for lepidopteran pests. Four weeks after planting, plants were side-dressed with 22 kg N ha−1 (20 lb A−1) as sodium nitrate (SQM North America, Atlanta, GA). Use of irrigation systems at each location (a drip system in Goldsboro and an overhead system in Reidsville) ensured that plants received adequate moisture at planting and 2.5 cm (1 in) water weekly if rainfall was inadequate. CT sub-plots were cultivated 3 and 6 WAT. NT sub-plots were not mowed or cultivated during the cabbage-growing season.
Cover crop biomass
Prior to each SS mowing event, SS cover crop and weed biomass were sampled in all sub-plots. Using a randomly placed 0.5 m2 quadrat, two samples per plot were cut with hand clippers to the same stubble height as prescribed for the mowing operation and biomass sorted into cover crop, broadleaf weeds and grass/sedge weeds. After drying samples at 70°C for at least 48 h, dry weights were recorded.
Soil moisture, inorganic N and bulk density
All sub-plots were sampled for gravimetric soil moisture and inorganic N on three dates during the cabbage growing season: 2 WAT, 2 weeks after sodium nitrate application (6 WAT) and at harvest. Six 15-cm deep cores were collected from each sub-plot using a 2-cm diameter soil probe and mixed to create a composite sample for each sub-plot on each sample date. To determine the percent moisture on a dry weight basis, a sub-sample was oven dried for 24 h at 105°C. Samples for inorganic N analysis were frozen at <5°C until processing. After air-drying in a greenhouse, soil samples were ground to pass through a 16-mm screen. Five grams of ground soil were extracted with 50 ml 2 M KCl. Using injection flow analysis (Lachat Instruments, Milwaukee, WI), extracts were colormetrically analyzed for NH4- and NO3-N. Reported values for total inorganic N represent the sum of NH4- and NO3-N. Bulk density was measured in CT and NT sub-plots of the LFM treatment at 6 WAT. An Uhland drive tube was used to collect soil samples using a 347.5 cm3 cylinder. Each cylinder with soil was weighed, dried at 105°C for 48 h, and weighed again to calculate bulk density.
Weed biomass in transplanted cabbage
Prior to mechanically weeding CT sub-plots at 3 and 6 WAT and at cabbage harvest (12 WAT), weed and SS re-growth biomass was sampled. Using a 0.25 m2 quadrat two biomass samples were cut with hand clippers from all CT and NT sub-plots. The quadrat was placed randomly along the length of the row and centered on the cabbage. Weed and re-growth biomass was sorted, dried and weighed following the procedure used for cover crop biomass.
Cabbage harvest
Cabbage harvest was performed at ten-day intervals beginning on 1 November and 19 November in Reidsville and Goldsboro, respectively. We attempted to harvest heads weighing 1.0 kg as marketable heads; however, for final classification purposes, marketable heads included all heads weighing 0.5 kg or more. The six outermost heads (three at each row end) in each sub-plot were considered guard plants and not included in harvest statistics; the maximum number of heads that could be harvested from each sub-plot was ten. At harvest, each head and four wrapper leaves were cut and weighed. Thirty days after the first harvest, plants that had not produced a head or which had a head weighing less than 0.5 kg (categorized as ‘culls’) were harvested. Whole plants were cut and weighed to determine the fresh weight. The number of dead plants per sub-plot was determined by subtracting the sum of marketable heads plus culls from 10.
Statistical analysis
Analysis of variance was performed using Proc GLM in SAS26. A combined analysis with data from both sites was carried out, followed by separate analyses for each location due to strong location by treatment interaction. The effect of SS management (treatment) was tested against whole-plot error (obtained after removing block, column and treatment effects). When a significant interaction occurred between whole-plot (SS management) and split-plot (tillage) effects, treatment means were compared at each tillage level. Mean separation was carried out using Fisher's least significant difference (LSD)Reference Younger27. Biomass values were square- or log-transformed before analysis where necessary to reduce variance heterogeneity. Proc Corr26 was used to determine correlations between weed biomass and SS residue biomass and cabbage head weight and SS residue biomass at both locations, and cabbage head weight and SS re-growth biomass at GoldsboroReference Younger27.
Results and Discussion
SS cover crop biomass
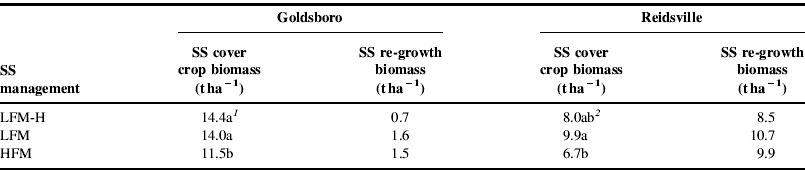
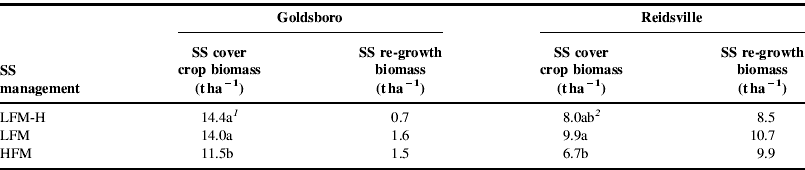
SS cover crop biomass at the first mowing, an estimate of hay yield, was 8.0 t ha−1 in Goldsboro and 5.7 t ha−1 in Reidsville. Low mean daily temperature (Fig. 1) and wide row spacing may have led to lower hay yield in Reidsville. Frequency of mowing impacted SS cover crop biomass production during the summer season (Table 3). In Goldsboro, cumulative SS cover crop biomass was lower under the HFM treatment (11.5 t ha−1) than the LFM treatment [14.4 t ha−1 when hay was removed (LFM-H) and 14.0 t ha−1 when hay was not removed (LFM)]. In Reidsville, SS cover crop biomass was lower in HFM plots (6.7 t ha−1) than in LFM plots (9.9 t ha−1). The inverse relationship observed between cutting frequency and biomass production was previously demonstrated by Beuerlein et al.Reference Beuerlein, Fribourg and Bell28 SS cover crop biomass production was not compared between CT and NT sub-plots because the time of final mowing varied by tillage treatment.
Cumulative biomass of SS cover crop (including biomass removed as hay) produced prior to final mowing (2 September 2004 in Goldsboro and 9 August 2004 in Reidsville) and biomass of SS that re-grew in NT sub-plots during the cabbage season as determined at the time of cabbage harvest (19 November 2004 in Goldsboro and 1 November 2004 in Reidsville) in Goldsboro and Reidsville, NC.
1 Mean separation within columns by Fisher's LSD test at P⩽0.05.
2 Data on accumulated SS biomass in Reidsville were transformed to square root (x) before analysis. Mean separation within columns by Fisher's LSD test at P⩽0.05. Means were back transformed for presentation.
SS re-growth biomass
SS re-growth following cabbage transplanting occurred in NT sub-plots at both locations. In Goldsboro, 0.7–1.6 t ha−1 of SS re-grew during the cabbage season (Table 3). SS re-growth biomass in Reidsville was 5–11 times higher (8.5–10.7 t ha−1) than in Goldsboro (Table 3). SS re-growth was observed to have begun in Reidsville by 3 WAT, but was delayed in Goldsboro. The final cutting and transplanting in Goldsboro occurred on 3 September 2004, following a month of significant rainfall that totaled 18.5 cm (Table 1). Wet field conditions at the time of mowing and transplanting operations may have led to soil compaction by machinery, one possible cause of SS failure to tiller immediately in Goldsboro. The biomass of SS re-growth did not vary by management system (Table 3), indicating that neither residue removal nor mowing frequency influenced re-growth. Because increased mowing frequency was not an effective means of reducing SS re-growth, SS represented a significant competitor with the subsequent cabbage crop under NT management at both locations.
Weed biomass in transplanted cabbage
Weed biomass trends in transplanted cabbage were similar across sampling dates at both locations; results obtained from analysis of variance are presented only for data collected at 6 WAT.
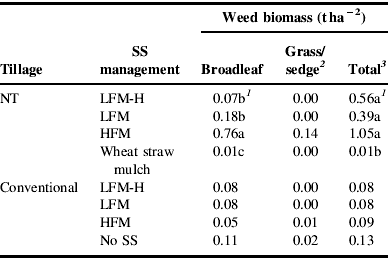
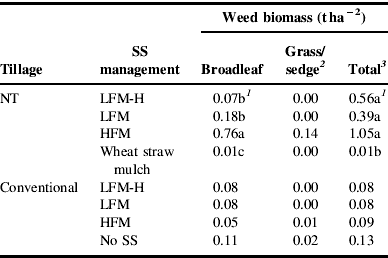
At Goldsboro, cover crop treatment influenced broadleaf weed biomass in NT cabbage (Table 4). Winter annual weeds including henbit (Lamium amplexicaule L.), purslane speedwell (Veronica peregrina L.) and common chickweed [Stellaria media (L.) Vill.] accounted for 70, 10 and 10%, respectively, of the density of broadleaf weeds identified in NT sub-plots at 6 WAT. Broadleaf weed biomass was greater under the HFM treatment (0.76 t ha−2) than the LFM treatment (0.18 t ha−2; Table 4). LFM led to greater SS cover crop biomass (Table 3) and, subsequently, more biomass returned to the soil surface as mulch. Mohler and TeasdaleReference Mohler and Teasdale29 concluded that increasing mulch (cover crop residue) biomass can reduce the emergence of many weed species. In addition, residue particles generated from HFM were younger when cut and had a lower C:N ratio than those generated from LFMReference Finney30. These characteristics can reduce weed suppression by cover crop mulch due to shorter residue longevity and inadequate soil surface coverage. Our results suggest that frequently mowing SS reduces weed suppression by the cover crop mulch.
Effects of SS management and tillage on weed biomass in transplanted cabbage at 6 WAT in Goldsboro, NC in 2004.
1 Data were transformed to log(x+0.00005) before analysis. Mean separation within columns by Fisher's LSD test at P⩽0.05. Means were back transformed for presentation.
2 Data on grass/sedge weed biomass in Goldsboro were not subject to analysis of variance due to a low number of sub-plots that contained grass and sedge weeds.
3 Total weed biomass represents the sum of broadleaf, grass/sedge and SS re-growth.
Under NT conditions at Goldsboro, wheat straw mulch offered the greatest broadleaf weed suppression. Weed suppression was likely improved due to even distribution of the mulch by hand. In addition, the application of glyphosate to the NT control that preceded the final pre-transplant mowing operation eliminated weeds of a size that may have escaped mowing in NT treatment sub-plots.
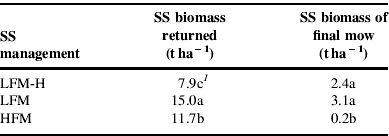
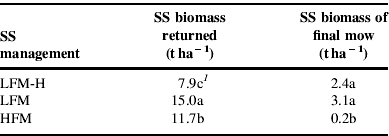
In NT plots at Goldsboro, SS cover crop biomass returned to the soil surface as mulch was lowest when hay was removed (7.9 t h−1; Table 5). The quantity of biomass applied as mulch was derived by subtracting the biomass of hay harvested at the time of the first cutting from the cumulative SS cover crop biomass produced prior to cabbage planting. Despite resulting in a smaller quantity of mulch accumulated prior to cabbage transplanting, hay removal followed by LFM led to broadleaf weed suppression equal to that achieved with LFM alone and better than that achieved with HFM under NT conditions (Table 4). This is attributed to characteristics of the residues generated by HFM previously discussed, specifically smaller size and lower C:N ratio than residues generated from LFM. There was a negative correlation (R=−0.59; P=0.042) between SS biomass at the final mowing event (Table 5) and broadleaf weed biomass at 6 WAT, indicating that as the quantity of residue deposited immediately prior to cabbage transplanting increased, appearance of broadleaf weeds in the cabbage crop decreased. Because hay removal did not impact the quantity of SS cover crop biomass cut at the end of season, removal of SS hay biomass early in the season did not reduce weed suppressive qualities of the SS cover crop. Overall, removal of SS as hay following the first mowing operation did not reduce weed suppressive qualities of the SS cover crop when it was subsequently mowed with low frequency, which allowed the crop to re-grow to 1.2–1.5 m.
Effect of SS management (averaging over tillage methods) on SS biomass returned to soil surface as mulch in NT cabbage and SS biomass cut at the final mowing operation in NT cabbage at Goldsboro, NC in 2004.
1 Mean separation within columns by Fisher's LSD test at P⩽0.05.
The impact of tillage on weed suppression by SS under LFM was assessed for broadleaf weeds in Goldsboro. Analysis of variance indicated that SS cover crop biomass generated under LFM, regardless of hay removal strategy, resulted in the same level of broadleaf weed suppression in CT and NT cabbage (P=0.647). The results of this study suggest that in an organic production system, sufficient levels of NT SS cover crop residue may provide weed control of annual broadleaf weeds comparable to tilled SS residue plus cultivation. Grass and sedge weed populations were too low to analyze at this location.
Results regarding broadleaf and grass/sedge weed suppression in Reidsville are confounded by the high level of SS re-growth in NT cabbage (Table 3). The SS re-growth behaved like a weed and contributed to cabbage crop failure. Grass and sedge weed biomass in CT cabbage (0.03 t ha−2) was significantly (P=0.015) lower than in NT cabbage (0.25 t ha−2), suggesting that the NT system did not provide adequate control of grasses and sedges. We attribute this result to the fact that the perennial species yellow nutsedge (Cyperus esculentus L.) represented an average of 55% of the grass and sedge weed population by number on all three sampling dates in Reidsville. Other species present in the cabbage crop were summer annual grasses including smooth crabgrass (Digitaria ischaemum Schreb. Ex. Muhl.), goosegrass [Eleusine indica (L.) Gaertn.)], fall panicum (Panicum dichotomiflorum Michx.) and broadleaf signal grass [Urochloa platyphylla (Munro ex Wright) R. Webster]. These species had also been present in the growing cover crop. Previous work has concluded that NT systems employing cover crops have the highest weed pressure from perennial speciesReference Putnam, DeFrank and Barnes31. Our results support this conclusion and offer further evidence that mechanical cultivation may provide better control of perennial species and established annual grasses than NT management.
Effects of tillage on cabbage survival, head weight and maturity
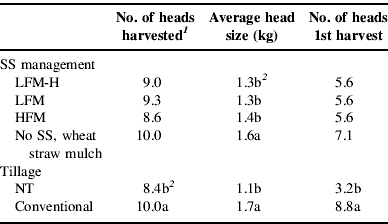
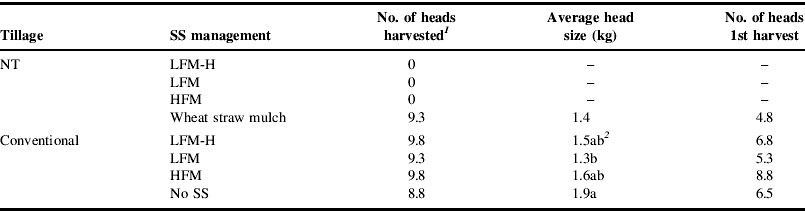
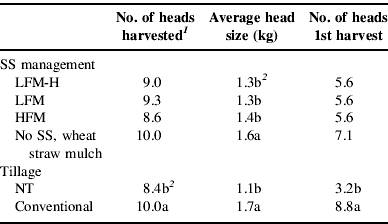
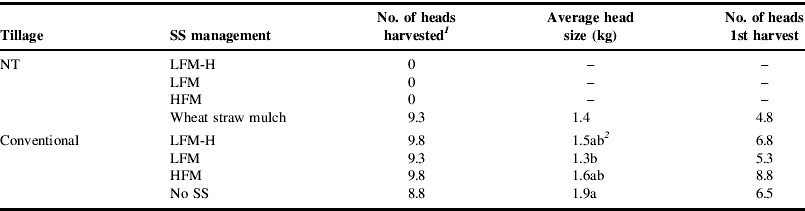
At Goldsboro, cabbage survival, head weight and the number of heads collected on the first harvest date were greater with CT than NT (Table 6). There was a negative correlation between head weight and SS re-growth biomass (R=−0.72; P<0.001), as well as between the number of heads harvested on the first harvest date and re-growth biomass (R=−0.78; P<0.001), suggesting that SS re-growth in NT sub-plots exhibited competition with the cabbage crop. NT production at Reidsville resulted in a crop failure in SS residues (Table 7). Early onset of SS re-growth and biomass production nearly equal to that in the cover crop only system suggest that resource competition with SS contributed to cabbage failure.
Main effects of SS management and tillage on cabbage survival, head size, and maturity at Goldsboro, NC in 2004.
1 Maximum number of heads harvested in each sub-plot equals 10.
2 Mean separation within columns by Fisher's LSD test at P⩽0.05.
Effects of SS management and tillage on cabbage survival, head size and maturity at Reidsville, NC in 2004.
1 Maximum number of heads harvested in each sub-plot equals 10.
2 Mean separation within columns by Fisher's LSD test at P⩽0.05.
Environmental differences between CT and NT sub-plots may have contributed to cabbage growth reduction in NT production in Goldsboro. NT systems typically exhibit higher soil moisture levels than CT systemsReference Johnson and Hoyt2. Though soil moisture was significantly higher in NT soils on all sampling dates (Table 8), it was not likely that this difference was agronomically significant. NT systems also influence soil nutrient availabilityReference Johnson and Hoyt2. The fertilizer application method, rate and timing were intended to eliminate variation in inorganic N availability due to tillage or cover crop management. The concentration of soil inorganic N did not vary between CT and NT sub-plots throughout the season in Goldsboro (Table 8), suggesting that N availability did not limit cabbage growth in NT sub-plots. Soil compaction has also been posited as a yield limiting factor in previous studies in which NT production resulted in lower cabbage yieldReference Bottenberg, Masiunas, Eastman and Eastburn32, Reference Hoyt and Walgenbach33. Field studies have demonstrated that soils artificially compacted to a pentrometer resistance of 2.0 MPa can reduce yields of transplanted cabbage by approximately 29%Reference Wolfe, Topoleski, Gundersheim and Ingall34. In Goldsboro, bulk density measured in LFM plots was significantly higher (P=0.008) in NT sub-plots (1.47 g cm−3) than in CT sub-plots (1.32 g cm−3); however, this greater value would not be considered root restrictiveReference Vepraskas35.
Main effect of tillage on gravimetric soil water and soil inorganic N on three dates in the cabbage growing season in Goldsboro and Reidsville, NC in 2004.

1 Mean separation within columns by Fisher's significant difference test at P⩽0.05.
2 Mean separation not presented for main effect of tillage due to significant treatment by tillage interaction (P=0.001) on this sampling date.
Effects of SS on cabbage head weight
Cabbage head weight in Goldsboro was highest when cabbage was not preceded by SS, regardless of the tillage regime (Table 6). A similar, though less significant, trend was observed in CT cabbage at Reidsville (Table 7; P=0.050). A negative correlation between head weight and accumulated SS cover crop biomass in tilled sub-plots at both locations (Goldsboro: R=−0.72, P=0.008; Reidsville: R=−0.65, P=0.007) suggests that the presence of incorporated SS residues negatively impacted cabbage growth. Because resource competition was not a factor in CT sub-plots, an allelopathic interaction may have been present. The allelopathic potential of SS and its effective exploitation for weed control are well documentedReference Weston and Duke13, Reference Putnam, DeFrank and Barnes31, Reference Putnam and DeFrank36. Although allelopathic effects on transplanted crops have not been thoroughly investigated, incorporated SS residues have led to reduced growth of Eastern redbud transplants in pot cultureReference Geneve and Weston37.
Allelopathy may have also been a contributing factor to head weight reduction in NT cabbage at Goldsboro. Head weight was reduced in NT SS residue mulch compared to wheat straw mulch (Table 6). This finding is consistent with a greenhouse study in which SS surface residues reduced cabbage transplant dry weight compared to transplants grown under wheat strawReference Finney30. However, the potential effects of allelochemical interference on cabbage head weight cannot be separated from the impact of SS re-growth in NT cabbage.
Summary
The results of this study suggest that SS can be managed as a single cutting hay crop without negatively impacting weed suppressive qualities of the cover crop. Cutting frequency following hay harvest is an important aspect of cover crop management for the optimization of weed suppression under NT conditions. Frequent cutting can lead to greater weed biomass in a subsequent cash crop. Cutting less frequently (e.g., each time the crop reaches 1.5 m) will provide residues of sufficient longevity and biomass to provide weed suppression of broadleaf weed species.
Increasing mowing frequency did not improve kill response of SS at either location in this experiment. Repetition of this experiment over multiple years at a single location would provide more conclusive data on kill response and subsequent cabbage growth. SS and other summer cover crops suited to dual application as hay exhibit high tillering and re-growth capacity, characteristics that contribute to poor mow kill response. Further investigation of strategies to enhance control of cover crop re-growth, including mechanical technologies (such as the addition of a crimper to rolling equipment), manipulation of cover crop management to improve kill response and application of herbicides approved for use in organic production, will aid further development of NT vegetable production with dual application cover crops.
In this study, SS introduced several competitive factors that negatively impacted the growth of cabbage in both NT and CT systems, including cover crop re-growth and possible allelopathy. This species may pose similar risks to other transplanted fall vegetables. Because of the potential biological and economic benefits of using this species as both hay and cover crop, future investigations may also seek to evaluate organic NT systems with SS for late- planted fall, over-wintering, or early spring crops that may mitigate the risks observed in this study. Repetition of this experiment for fall-planted vegetables with other cover crop species that could double as high-value organic hay crops but are killed more readily using mechanical means should also be conducted.
Acknowledgements
We thank the Organic Farming Research Foundation, the NC Beautiful Moore Fellowship, the National Fish and Wildlife Foundation and the North Carolina Agricultural Foundation, Inc. for funding this project. We also thank Ken Fager and Robert Walters for technical support, and the staff at the Center for Environmental Farming Systems and the Upper Piedmont Research Station for field support.