Introduction
Winged sea lavender [Limonium lobatum (L.f. Chaz)] is a winter annual dicotyledonous weed of Mediterranean origin that has naturalized inland and some coastal areas of southern Australia (Atlas of Living Australia 2015–2017). This weed from the Plumbaginaceae family is often found in areas of low to moderate rainfall on sandy to loamy, often calcareous sodic soils of neutral to high pH. Limonium lobatum is characterized by erect, broadly winged stems and one-sided clusters of purple and white flowers. This weed was most likely introduced into Australia as a garden ornamental plant; several Limonium spp. are still cultivated for marketable flower stems (Funnell et al. Reference Funnell, Bendall, Fountain and Morgan2003; Whipker and Hammer Reference Whipker and Hammer1994). Long-range dispersal has likely occurred by seed either through contamination of grain crops, on farm machinery, or via movement of livestock. Infestations are more common in pastures, roadsides, and undisturbed habitats; however, more recently, this species has become more prevalent in crops grown after pasture phases (C Taylor, personal communication). Overreliance on glyphosate in reduced-tillage systems has favored L. lobatum, which tends to have a higher tolerance to this herbicide than other weeds present (Taylor and Brown Reference Taylor and Brown2014). In the absence of effective early control, deep-rooted plants with predominantly winter growth can compete for nutrients and moisture, retarding the growth and yield of crops. Limonium lobatum can also cause problems at harvest, with high levels of plant material discoloring and contaminating grain (B Fleet, personal communication).
While L. lobatum is becoming more prevalent in crops across southern Australia, little information is available about its germination, seedling establishment, and seedbank persistence. Such key components of plant biology influence colonization of new habitats and success as a weed in agroecosystems. Persistence of the soil seedbank is an important adaptive feature of weeds (Thompson Reference Thompson2000), and dormancy is considered to be an effective mechanism for seeds to persist in the soil (Chauhan Reference Chauhan2006; Dalling et al. Reference Dalling, Davis, Schutte and Arnold2011). Dormancy helps regulate germination timing and often ensures seedling establishment is synchronized with favorable conditions in the field (Baskin and Baskin Reference Baskin and Baskin1998).
Germination and emergence of plant species in the field are known to be influenced by various environmental factors, including temperature, moisture, light, and soil salinity (Baskin and Baskin Reference Baskin and Baskin1998; Koger et al. Reference Koger, Reddy and Poston2004). Temperature and light have been shown to be particularly important cues for germination by enabling seeds to sense their position in the soil profile and occurrence of soil disturbance (Ngo et al. Reference Ngo, Boutsalis, Preston and Gill2017; Schutte et al. Reference Schutte, Tomasek, Davis, Andersson, Benoit, Cirujeda, Dekker, Forcella, Gonzalez‐Andujar and Graziani2014). Studies have been undertaken on the effects of salinity and temperature on the germination behavior of other Limonium spp. from the coastal areas of Europe and Pakistan (Gimenez et al. Reference Gimenez, Fernandez and Mercado2013; Zia and Khan Reference Zia and Khan2004). Limonium stocksii (Kuntze) was tolerant to high salt levels (200 mM NaCl), showing complete germination (100%), with 5% of seeds germinating at salt concentrations as high as 500 mM (Zia and Khan Reference Zia and Khan2004). However, the effects of both salinity and temperature on germination of L. lobatum are unknown. Given that more than 60% of the 20 million ha of dryland cropping soils in Australia are sodic (Rengasamy Reference Rengasamy2002), L. lobatum’s tolerance to salinity could be an important factor for successful colonization of these soils.
An understanding of seed dormancy is vital for the development of effective management strategies against weeds (Adkins et al. Reference Adkins, Bellairs and Loch2002), because weed species with longer seed dormancy tend to have more persistent seedbanks (Kleemann and Gill Reference Kleemann and Gill2013). Seed dormancy is often regulated by more than one factor (Fenner and Thompson Reference Fenner and Thompson2005). In many weed species, the embryo has the capability to germinate but is prevented by the seed coat. The mechanisms within the seed coat structure may involve permeability (preventing water uptake or gaseous exchange) and mechanical (preventing embryo expansion) and chemical barriers to germination (Adkins et al. Reference Adkins, Bellairs and Loch2002). In many weed species, seed germination is inhibited by the presence of physiological dormancy regulated in the embryo (Baskin and Baskin Reference Baskin and Baskin1998). In other species, seed dormancy can be associated with seed coat and embryo-based mechanisms (Baskin and Baskin Reference Baskin and Baskin2004). At present, there is no available information on seed dormancy in L. lobatum.
Seedbank persistence is a major driver of weed population dynamics (Cousens and Mortimer Reference Cousens and Mortimer1995), and reducing seed viability in the soil can have a significant impact on the size of the weed population (Jordan et al. Reference Jordan, Morkensen, Prenzlow and Cox1995). Preventing weed seed rain through effective management can also reduce weed population density and seedbank turnover (Kleemann et al. Reference Kleemann, Preston and Gill2016). Many weed species are known for their prolific seed production, which means only a few survivors are required to replenish the seedbank. However, exhaustion of the weed seedbank tends to be mainly due to seedling recruitment, seed decay, or both (Chee-Sanford et al. Reference Chee-Sanford, Williams, Davis and Sims2006), with the fate of seeds influenced largely by their placement in the soil and exposure to abiotic environmental conditions (Davis et al. Reference Davis, Cardina, Forcella, Johnson, Kegode, Lindquist, Luschei, Renner, Sprague and Williams2005). Seedbank behavior of L. lobatum is largely unknown, and the influence of factors such as rainfall and soil type on the rate of seedbank depletion in the field could have important implications for weed management.
Information on seed dormancy, germination, and seedling emergence behavior could assist in explaining why L. lobatum is becoming more abundant in field crops in southern Australia. Such information would also be useful in developing management strategies for this weed. Therefore, the objectives of the studies reported here were (1) to determine the effect of after-ripening period on seed germination of L. lobatum and the mechanisms of regulation; (2) to determine the effects of burial depth on seedling emergence and temperature, light, and salt stress on seed germination; and (3) to investigate seedling recruitment under field conditions.
Materials and Methods
Seed Source
Seeds of L. lobatum were collected at maturity from arable fields at Ouyen (S8), Victoria (35.32°S, 142.75°E) and Warnertown (S12), South Australia (33.55°S, 138.13°E) in October 2015 and November 2016. Seeds were collected from 200 senesced plants and then bulked to form a composite sample from each site. Seeds were separated from flower spikelets manually, and 1,000-seed weight for S8 and S12 populations were determined as 4.6±0.13 g and 5.5±0.11 g, respectively. Seeds were stored in naturally lit storage units placed outside to maintain ambient conditions until being used in experiments. The storage-unit temperature fluctuated between 23±10 C during the daytime and 12±10 C during the nighttime.
General Germination Test Protocol
Limonium lobatum germination was evaluated by placing 25 seeds evenly spaced in a 9-cm-diameter petri dish containing two layers of Whatman No. 1 filter paper, moistened with either 5 ml of distilled water or a treatment solution. There were four replicates of each treatment. Petri dishes were sealed with Parafilm® (Bemis Company, Oshkosh, WI) and placed in an incubator of fluctuating day/night temperatures of 20/12 C, unless otherwise stated. The photoperiod was set for 12 h with fluorescent lamps used to produce a light intensity of 43 µmol m−2 s−1. For the complete-darkness treatment, petri dishes were double-wrapped in aluminum foil. Seed germination was determined under alternating light/dark conditions, unless otherwise stated. The number of germinated seeds was counted 14 d after the start of the experiments, with the criterion for germination being the protrusion of the radicle, unless otherwise stated.
Seed Dormancy
On a monthly basis, seeds of two L. lobatum populations (S8 and S12) were used for germination tests. There were four replicates of each treatment. Germination was calculated as a total of the number of viable seeds tested. Seeds that matured in October and November were collected and stored, and germination was assessed using the general germination test protocol.
Effect of Light on Germination
The effect of two light regimes (12-h alternating light/dark and 24-h dark) on germination of dormant seed of both populations of L. lobatum was examined. The 24-h dark treatment was achieved by wrapping each petri dish in two layers of aluminum foil. There were four replicates of each treatment.
Seed Imbibition
To establish the ability of seeds of L. lobatum to imbibe water (lack of hardseededness [impermeable seed coat]), four replicates of 75 seeds were evenly placed in 9-cm-diameter petri dishes containing two layers of Whatman No. 1 filter paper moistened with 5 ml of distilled water. Seeds were incubated in the dark at 20 C, removed, weighed, and returned to the petri dishes, and the change in mass of each replicate recorded at 0.5, 1, 2, 4, 8, 24, 48, and 96 h. An estimate of the time required to reach 50% imbibition was derived from a fitted logistics function (GraphPad Prism v. 6.00, La Jolla CA).
Seed Germination with a Pretreatment of NaOCl, Gibberellic Acid, and Scarification
Preliminary experiments were conducted with 6-mo after-ripened seeds to determine a suitable pretreatment time with 564 mM NaOCl (from 15 to 60 min). Four replicates of 25 seeds were used in six different treatments to break dormancy: (1) incubation in distilled water; (2); physical scarification of seed and incubation in distilled water; (3) incubation in 0.001 M gibberellic acid (GA3); (4) physical scarification of seed and incubation in 0.001 M GA3; (5) treatment in 564 mM NaOCl for 30 min followed by a 10-min rinse in running water followed by incubation in water; and (6) treatment in 564 mM NaOCl for 30 min followed by a 10-min rinse in running water and incubation in 0.001 GA3. Seeds were physically scarified by cutting the seed coat with a scalpel. Seeds of S8 and S12 populations were used for this experiment, and the experiment was repeated twice.
Seedling Emergence from Different Burial Depths
The study of the effects of seed burial depth on the seedling emergence of both weed populations was undertaken using a growth cabinet at 9 mo after seed maturity. Fifty seeds of L. lobatum were buried in soil in plastic trays (10 cm by 15 cm by 6 cm) at depths of 0 (soil surface), 1, 2, and 5 cm. There were four replicates of each treatment. Control dishes, where seeds were not added, indicated that there was no background weed seedbank in the study soil. The field soil used was a sandy loam with a pH of 7. The temperature of the growth cabinet was set at fluctuating day/night temperatures of 20/12 C, and the photoperiod was set at 12 h with fluorescent lamps used to produce a light intensity of 43 µmol m−2 s−1. The trays were watered as needed to maintain adequate soil moisture. Seedling emergence was defined as the appearance of the two cotyledons, and seedling density was assessed 30 d after experiment initiation. The experiment was repeated twice.
Effect of Temperature on Germination
Nondormant (12-mo-old) scarified seeds of S8 and S12 populations were used to examine the effects of temperature on germination. Twenty-five seeds of each population were incubated in growth cabinets set at six different constant temperatures (5, 10, 15, 20, 25, and 30 C). There were four replicates of each treatment. Germinated seeds were counted and recorded twice daily for the estimation of base temperature. Germination tests were terminated when no further germination occurred for 7 d.
Effect of Salt Stress on Germination
The effect of salt stress on seed germination of both populations of L. lobatum was undertaken 9 mo after seed maturity. Salt-stress treatments involved application of 0, 10, 20, 40, 80, 160, 320, 480, and 640 mM NaCl. This range represents the level of salinity occurring in some soils of southern Australia (Chauhan et al. Reference Chauhan, Gill and Preston2006b). There were four replicates of each treatment. The experiment was repeated twice.
Seedling Emergence and Recruitment under Field Conditions
Field experiments were established in a randomized complete block design at Karoonda (35.08°S, 139.88°E), Roseworthy (34.88°S, 138°69′E), and Tarlee (34.27°S, 138.77°E) in South Australia to investigate field seedling emergence and seedbank recruitment of both populations of L. lobatum. A total of 350 seeds of each population were introduced to metal rings (37-cm diameter) in the field at 1.5 mo after seed maturity. There were three replicates. Seeds were allowed to after-ripen on the surface under field conditions; at 6 mo after seed maturity, soil inside the metal rings was cultivated to a depth of 2 cm by using hand harrows to simulate a crop-sowing operation. Seedlings that emerged were counted and removed after a monthly census from April to October during the 2016 and 2017 growing seasons.
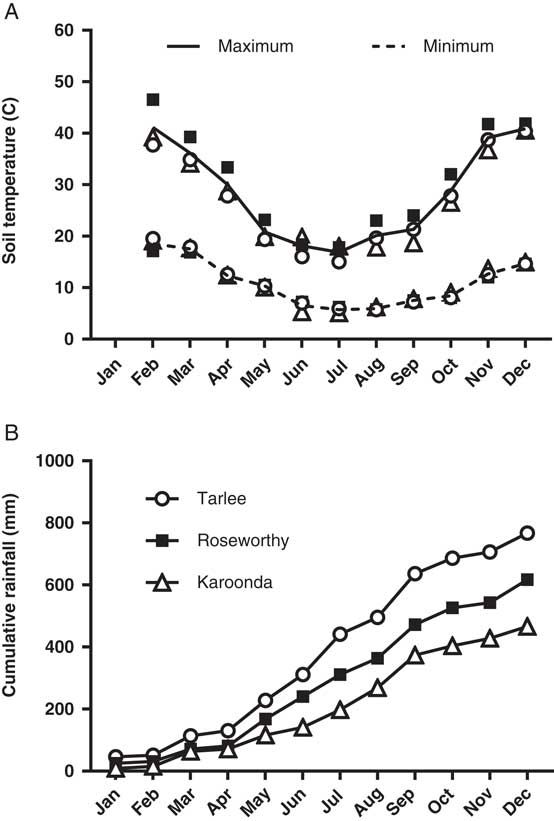
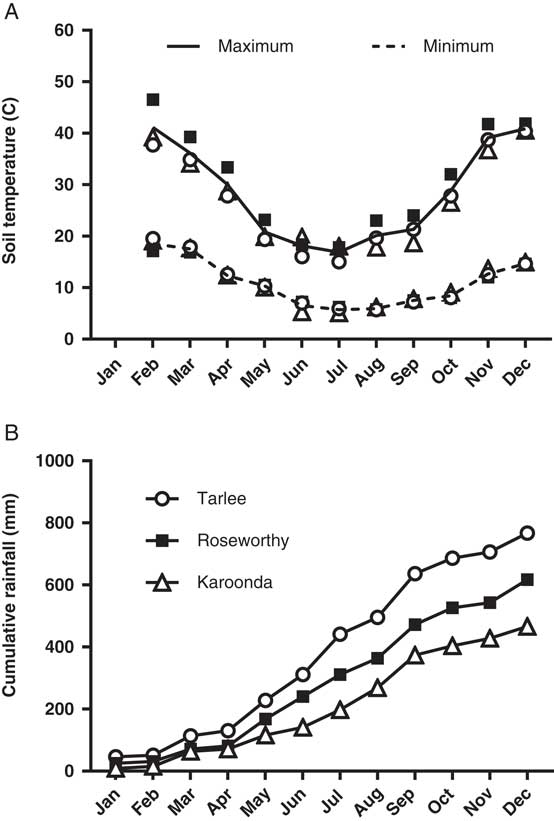
Soil temperature was monitored at 1.0±0.5 cm depth every 15 min using a stainless-steel thermistor probe and a Hastings Tinytag-Ultra Datalogger (Tinytag Ultra 2, Hastings Data Loggers., Port Macquarie, NSW, Australia). Daily rainfall data were acquired from Bureau of Meteorology weather stations located at the three sites (http://www.bom.gov.au; Figure 1). Soil characteristics and soil microbial activity were determined for each field experiment by sampling the upper 0- to 5-cm soil layer from each replicate. Samples were immediately placed in sealed plastic bags and analyzed for texture, pH (water), organic carbon (% OC), soil microbial biomass (mg C kg−1 soil), and soil basal respiration (mg CO2 kg−1 soil; APAL Agricultural Laboratory, Magill, SA, Australia).
Monthly mean minimum and maximum soil surface temperatures (A), and cumulative rainfall (B) during 2016 at Tarlee, Roseworthy, and Karoonda, South Australia (http://www.bom.gov.au).
Statistical Analyses
Estimation of Base Temperature
In previous studies, reciprocal time to 50% of germination has been shown to be the most statistically robust and biologically relevant method for estimating base temperature for seed germination (Steinmaus et al. Reference Steinmaus, Prather and Holt2000). A linear regression was performed with mean germination speed of the four replicates against incubation temperature. The base temperature (Tb) was estimated as the intercept of the specific regression line with the temperature axis. A logistic function was used to analyze mean germination response at each temperature (GraphPad Prism v. 6.00, La Jolla, CA):
 $$Y{\,\equals\,}{{100} \!\mathord{\left/\! {\vphantom {{100} {\left( {1{\plus}10^{{\left( {{\rm log}t50{\minus}X} \right){\asterisk}b}} } \right)}}} \right. \kern-\nulldelimiterspace} {\left( {1{\,\plus\,}10^{{\left( {{\rm log}t_{50}{\,\minus\,}X} \right){\,\asterisk\,}b}} } \right)}}$$
where Y is the percentage of cumulative germination; X is the time (in hours); germination speed is the time required for germination of half the total germinated seeds (T50); and b is the Hill slope, which describes the steepness of the family of curves. The same logistic function was applied to data on seed imbibition and salt stress.
Seedling emergence values at different field sites were fit to a functional three-parameter sigmoidal model using SigmaPlot 2011 (v. 12.5). The model fit was:
 $${\rm E}{\,\equals\,}{{{\rm E}_{{{\rm max}}} } \mathord{\left/ {\vphantom {{{\rm E}_{{{\rm max}}} } {\left[ {1{\plus}{\rm e}^{{{\minus}\left( {\left( {x-t50} \right)\,/\,{\rm Erate}} \right)}} } \right]}}} \right. \kern-\nulldelimiterspace} {\left[ {1{\,\plus\,}{\rm e}^{{{\minus}\left( {\left( {x\,-\,t_{50}} \right)/{\rm Erate}} \right)}} } \right]}}$$
where E is the total field seedling emergence (plants m−2) at time x (in days), Emax is the maximum seedling emergence, t 50 is the time to reach 50% of maximum seedling emergence, and Erate indicates the slope around t 50.
All experiments undertaken in the incubation cabinet were conducted in a completely randomized design. Treatments of each experiment were replicated four times, and data from repeated experiments evaluating the effect of NaOCl, burial depth, and NaCl were combined for analysis, as there was no time by treatment interaction.
Homogeneity of variance was determined by plotting residual and fitted data values. Transformation of data did not improve homogeneity of variance, so ANOVA was performed on nontransformed percentage data, and means were separated using Fisher’s protected LSD at P=0.05 (GenStat v. 17, VSN International, Herts, UK).
Results and Discussion
Seed Dormancy and Effect of Light on Germination
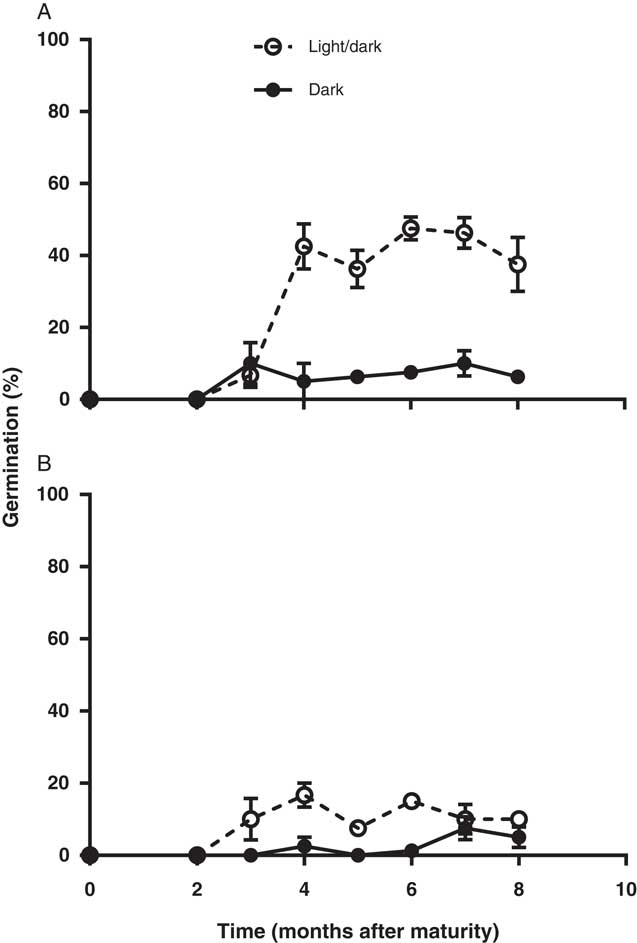
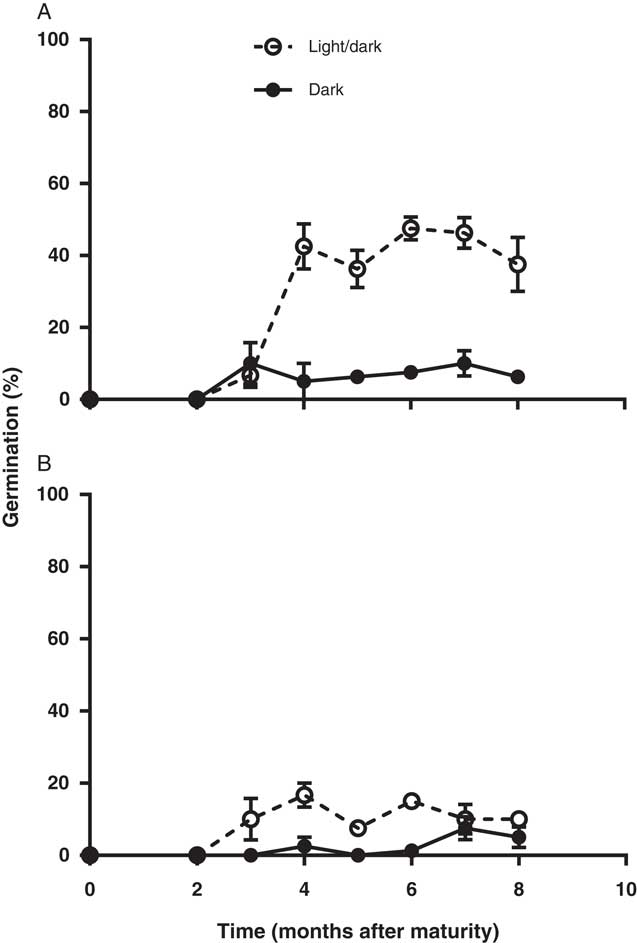
Freshly produced L. lobatum seeds did not germinate until they had after-ripened for about 2 mo (Figure 2). Therefore, L. lobatum appears to exhibit some innate dormancy. However, even at 8 mo after maturity, maximum germination for dry after-ripened seed did not exceed 50% for population S8 and was only 20% for S12. Lower germination of intact seeds of S12 could be related to greater pigmentation in the seed coat of this population compared with S8 (unpublished data). Seed coat pigments have been reported to influence seed dormancy and germination by reducing the permeability of seeds to water, gases, and hormones (Finkelstein et al. Reference Finkelstein, Reeves, Ariizumi and Steber2008). However, maximum germination for both populations appeared to coincide with the beginning of the winter growing season (4 mo after maturity). Exposure to light increased germination of both populations 5-fold; seed germination increased from 6% in the dark to 31% in alternating light and dark in S8 and from 2% to 10% in S12, respectively (Figure 2). Positive photoblastic response of L. lobatum is consistent with germination behavior of L. stocksii reported previously by Zia and Khan (Reference Zia and Khan2004). Many small-seeded broadleaf weeds have strong preference for light for germination (Chauhan et al. Reference Chauhan, Gill and Preston2006b; Milberg et al. 2000; Widderick et al. Reference Widderick, Walker and Sindel2004). Greater germination of L. lobatum seeds in light suggests that germination in the field is likely to be favored by the presence of seeds on the soil surface. The requirement for light-mediated germination may also explain the increasing prevalence of this weed since the adoption of no-till systems in which most of the seeds are likely to be present on the soil surface (Clements et al. Reference Clements, Benott, Murphy and Swanton1996; Yenish et al. Reference Yenish, Fry, Durgan and Wyse1996), where they would be exposed to light. However, up to 10% of the seeds were able to germinate in the dark, which in the field would ensure some seedling recruitment even with shallow burial after tillage, provided moisture and temperatures are favorable.
Dormancy pattern of two Limonium lobatum populations S8 (A) and S12 (B) after 14-d incubation at 20/12 C at 12-h alternating fluorescent light/dark and under continuous darkness. Each data point represents the mean of four replicates; vertical bars are the standard error of the mean.
Seed Imbibition
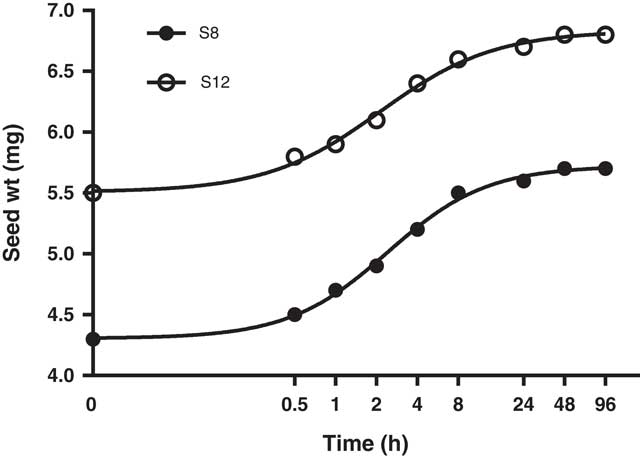
Seed of both populations rapidly imbibed water, required only 2 h to reach 50% imbibition, and were fully imbibed within 48 h (Figure 3).
Rates of imbibition of Limonium lobatum populations S8 and S12. Each data point represents the mean of four replicates, and curves were fit using Equation 1. For S8 population: Y=100/(1+10(2.163−X)*1.191), R2=0.997; and for S12 population: Y=100/(1+10(2.109−X)*1.042)), R2=0.995.

Permeability of the seed coat is a major factor controlling the rate of water uptake (Woodstock Reference Woodstock1988), and several studies have reported the influence of seed coat impermeability on dormancy and germination in annual weeds and legume pasture species (Cheam Reference Cheam1986; Cousens et al. Reference Cousens, Young and Tadayyon2010; Taylor Reference Taylor2005). However, seeds of L. lobatum were capable of rapid imbibition of water, indicating that dormancy is not regulated by hardseededness but imposed by other mechanisms. Similarly, Cousens et al. (Reference Cousens, Young and Tadayyon2010) found that naked seeds of wild radish (Raphanus raphanistrum L.) were able to fully imbibe within 24 h, suggesting the seed coat was porous to water but may have also allowed inhibitors of germination to leach out. The ability of seeds of L. lobatum to rapidly imbibe may have adaptive value in the field by promoting faster rates of germination and seedling establishment, but could also increase vulnerability to false breaks in an autumn–winter growing season, which is a regular climatic feature of southern Australia.
Response of Dormant Seeds to Scarification, GA3, and NaOCl
Germination of 6-mo after-ripened seed of both weed populations was significantly increased (P≤0.01) by scarification, GA3, and pretreatment with NaOCl (Table 1). Scarification alone increased seed germination from 22% (S12) and 55% (S8) to near-complete germination (89% to 100%) in the two populations, which provides clear evidence of seed coat–imposed dormancy in L. lobatum. However, the inhibitory effect of seed coat on seed germination was not related to impermeability of seed coat to water (Figure 3). Bleaching intact seed with NaOCl significantly increased germination (86% to 89%), whereas treatment with GA3 was less effective (49% to 73%). Stimulation of seed germination with GA3 has been shown in several weed species and was suggested to influence mobilization of food reserves (Chauhan et al. Reference Chauhan, Gill and Preston2006a). Near-complete germination (96% to 100%) was observed when scarification or NaOCl treatment was followed by GA3. Hsiao and Quick (Reference Hsiao and Quick1984) suggested two main roles for NaOCl in the termination of dormancy. Firstly, NaOCl may modify the properties of the hull and seed coat membranes in such a way as to increase water uptake by the embryo, leading to the release from dormancy. Second, NaOCl could act as an oxidant on vital pre-germination processes within the caryopsis. The capacity for gaseous exchange might be limited by the tissues surrounding the embryo (Adkins et al. Reference Adkins, Bellairs and Loch2002). Therefore, NaOCl could be stimulating germination by providing additional oxygen during the germination process. These data suggest the dormancy mechanism in L. lobatum could be based on embryo-covering structures of the seed and factors within the embryo.
Germination (%) of 6-mo after-ripened seed of two Limonium lobatum populations (S8 and S12) pretreated with NaOCl, gibberellic acid (GA3), and scarification.

a Each data value represents the mean of two experiments pooled with four replicates. Values (mean±SE) within a column followed by different letters are significantly different (Fisher’s protected LSD test P≤0.01).
Seedling Emergence from Different Burial Depths
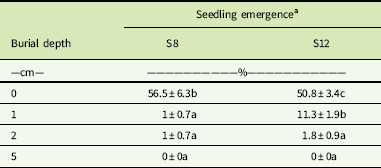
Seedling emergence of L. lobatum was significantly (P<0.01) influenced by burial depth (Table 2). Seedling emergence was greatest for seeds on the soil surface (51% to 57%), but significantly decreased even with shallow burial at 1 cm (≤11%) and 2 cm (≤2%). This reduction in seedling emergence is consistent with the stimulation of seed germination by exposure to light observed in this study (Figure 2).
Effect of burial depth on seedling emergence (%) of two Limonium lobatum populations (S8 and S12) in a glasshouse at 30 d after burial.

a Each data value represents the mean of two experiments pooled with four replicates. Values (mean±SE) within a column followed by different letters are significantly different (Fisher’s protected LSD test P≤0.01).
There was no seedling emergence beyond the 2-cm burial depth (Table 2). Decreased seedling emergence with increased burial depth has been reported for several weed species (Benvenuti et al. Reference Benvenuti, Macchia and Miele2001) and was strongly associated with seed size (Chauhan Reference Chauhan2006; Mennan and Ngouajio Reference Mennan and Ngouajio2006). Seeds of L. lobatum are moderate in size (4.6 to 5.5 mg). However, combination of light requirement for germination and low energy reserves for emergence from deep burial could be responsible for complete failure to emerge from the 5-cm burial depth. Clear preference for germination on the soil surface could explain the increase in abundance of L. lobatum since the adoption of no-till farming systems. In these systems, the weed seedbank is concentrated on or near the soil surface (Clements et al. Reference Clements, Benott, Murphy and Swanton1996; Yenish et al. Reference Yenish, Fry, Durgan and Wyse1996), where the conditions are generally more favorable for the establishment of small-seeded weed species. (Chauhan et al. Reference Chauhan, Gill and Preston2006b).
Effect of Temperature on Germination
Limonium lobatum was capable of germination over a wide range of temperatures from 5 to 30 C. In both populations, maximum germination (~92%) was reached at temperatures between 10 and 30 C. However, some seeds were unable to germinate at the low temperature (5 C), at which maximum germination (Gmax) was reduced by 20% (unpublished data). Zia and Khan (Reference Zia and Khan2004) showed that under saline conditions, germination of L. stocksii was inhibited at temperature regimes of 10/20 C and 25/35 C, but optimal at temperatures of 15/20 and 20/30 C, which are similar to the optimal temperatures observed for L. lobatum in this study.
Seed germinated faster as temperature increased (Figure 4). The optimum temperatures for germination rate (T50) were 20 to 25 C, with T50 reached within 1.3 to 2 d as compared with 8.3 to 12.2 d at 5 C. Zia and Khan (Reference Zia and Khan2004) also reported much faster rates of germination for L. stocksii at optimal temperatures (15/20, 20/30, and 25/30 C) with maximum germination within 2 d.
Cumulative germination of two Limonium lobatum populations S8 (A) and S12 (B) at different temperatures. Each data point represents the mean of four replicates, and curves were fit using Equation 1. For S8 population: Y=100/(1+10(2.468−X)*2.733), (R2=0.972) for 5 C; Y=100/(1+10(2.055−X)*4.213), (R2=0.998) for 10 C; Y=100/(1+10(1.936−X)*3.181), (R2=0.998) for 15 C; Y=100/(1+10(1.678−X)*3.789), (R2=0.986) for 20 C; Y=100/(1+10(1.57−X)*2.905), (R2=0.994) for 25 C; Y=100/(1+10(1.432−X)*4.156), (R2=0.995) for 30 C; and for S12 population: Y=100/(1+10(2.301−X)*2.898), (R2=0.994) for 5 C; Y=100/(1+10(1.918−X)*2.594), (R2=0.996) for 10 C; Y=100/(1+10(1.738−X)*2.834), (R2=0.989) for 15 C; Y=100/(1+10(1.496−X)*2.33), (R2=0.990) for 20 C; Y=100/(1+10(1.523−X)*2.492), (R2=0.984) for 25 C; Y=100/(1+10(1.375−X)*2.971), (R2=0.986) for 30 C.

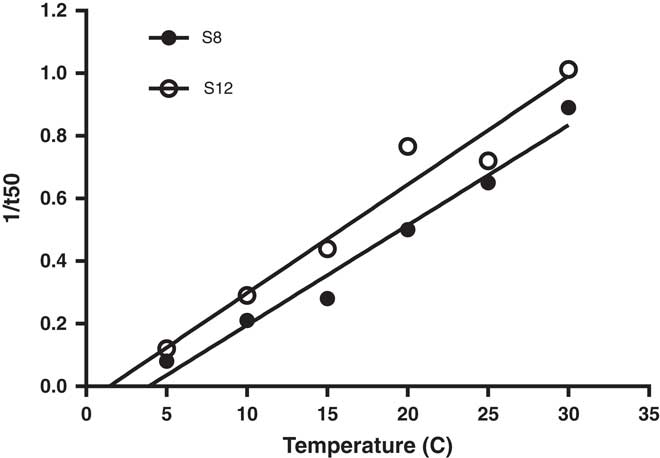
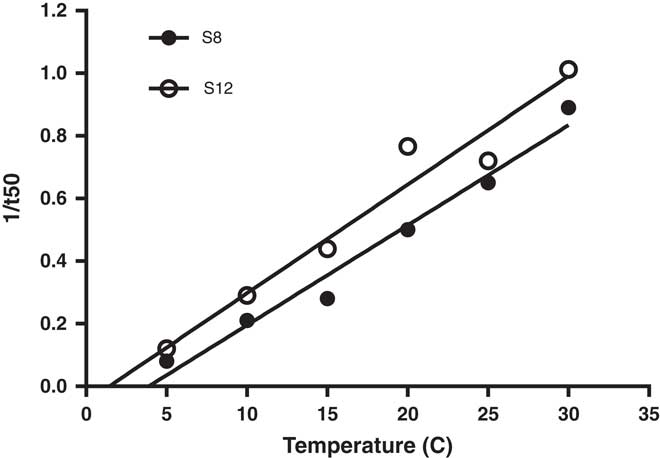
When temperature was plotted against the inverse of time to 50% germination, the base temperature (Tb) for germination was estimated to range from 1.4 to 3.9 C for the two populations (Figure 5). Our estimated Tb value for L. lobatum is lower than for the winter annual dicotyledonous weeds shortpod mustard [Hirschfeldia incana (L.) Lagr.-Foss.] and annual sowthistle (Sonchus oleraceus L.), with Tb for germination of 13.5 and 6.4 (Steinmaus et al. Reference Steinmaus, Prather and Holt2000), but falls within the range for temperate species (Tb 0 to 5 C), for which the optimum temperature for germination is about 20 to 25 C (Monteith Reference Monteith1981). With Gmax over a wide range of temperature (10 to 30 C), rapid germination, and low base temperature, L. lobatum is likely to emerge in the field after rainfall events during autumn to winter in southern Australia.
Base temperature estimation (Tb) of Limonium lobatum populations: Y=0.0318x – 0.1211 (R2=0.974) for S8; and Y=0.0347x – 0.05 (R2=0.953) for S12. Each data point represents the mean of four replicates.
Effect of Salt Stress on Germination
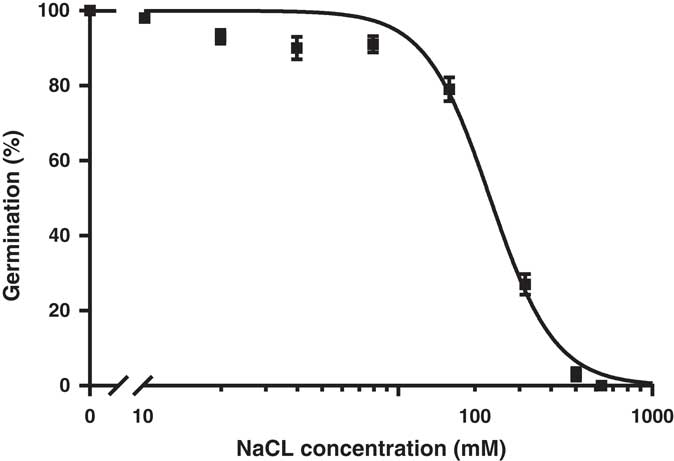
Germination response of L. lobatum seeds to NaCl fit well to a logistic model (R2=0.98). NaCl concentration of 230 mM inhibited germination of the two populations by 50%; 640 mM NaCl completely inhibited germination (Figure 6). In contrast to L. lobatum, seeds of other common annual winter weeds in southern Australia, such as little mallow (Malva parviflora L.), threehorn bedstraw (Galium tricornutum Dandy), oriental mustard (Sisymbrium orientale L.), S. oleraceus, African mustard (Brassica tournefortii Gouan.), and rigid ryegrass (Lolium rigidum Gaudin), were more sensitive and showed 50% inhibition at much lower salt concentrations (32 to 148 mM NaCl; Chauhan Reference Chauhan2006). These data suggest that even on soils with high salinity, L. lobatum seeds are more likely to germinate than many other local weed species. This is consistent with the results of previous studies in which plants of Limonium genus have been described as halophytes (Cortinhas et al. Reference Cortinhas, Erben, Paes, Santo, Guara-Requena and Caperta2015; Gimenez et al. Reference Gimenez, Fernandez and Mercado2013; Zia and Khan Reference Zia and Khan2004). Studies by Zia and Khan (Reference Zia and Khan2004) reported complete germination (100%) of L. stocksii at 200 mM NaCl, with 5% of seed germination at salt concentrations as high as 500 mM. Salinity is a major abiotic constraint to agricultural productivity in large areas of southern Australia (Rengasamy Reference Rengasamy2002), and tolerance of L. lobatum to high levels of salt could enable it to colonize and reduce crop productivity in areas affected by soil salinity.
Effect of salt (NaCl) stress on germination of Limonium lobatum seed incubated at 20/12 C at 12-h alternating fluorescent light/dark. The fitted line represents a logistics response equation: Y=100/(1+10(2.362−x)*−3.408), (R2=0.985). Each data point represents the mean of two experiments and two populations pooled with four replicates. The vertical bars are the standard error of the mean.

Seedling Emergence and Recruitment under Field Conditions
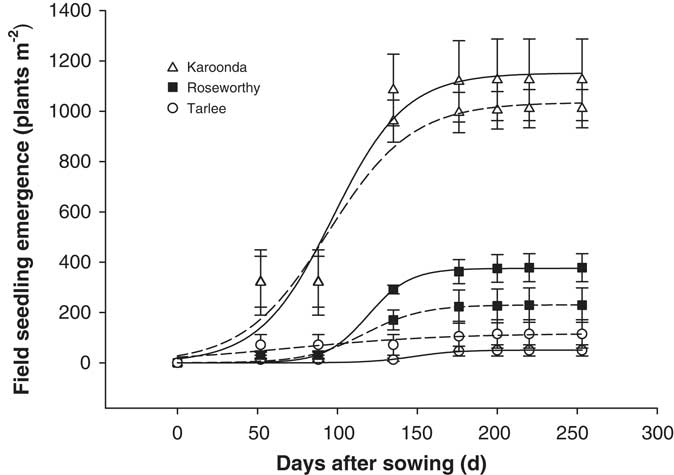
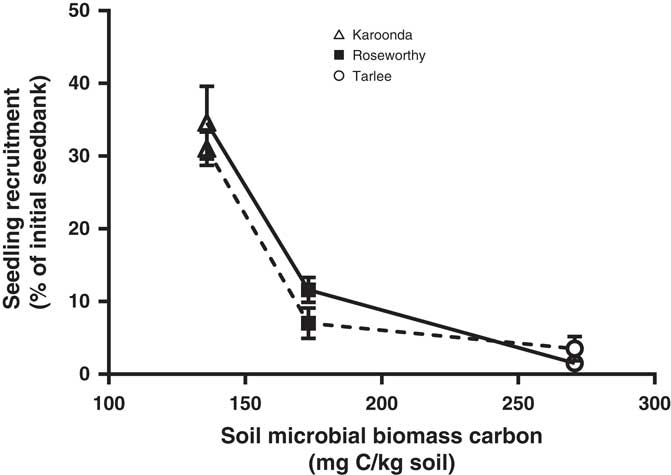
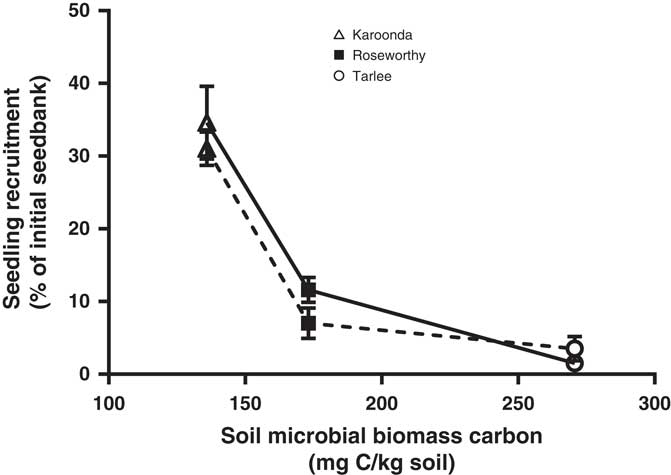
A three-parameter logistic model (Equation 2) was fit to seedling emergence measured during the growing season (April to October) at Tarlee, Roseworthy, and Karoonda, South Australia (Figure 7). Both populations of L. lobatum showed a very similar pattern of seedling recruitment at each location. Even though Karoonda received less growing-season rainfall than Roseworthy or Tarlee (Figure 1), seedling emergence was much greater for both populations (S8 and S12) at Karoonda. The maximum seedling emergence of the S8 and S12 population (Emax) was 1,152 and 1,035 plants m−2, respectively, at Karoonda compared with 375 and 230 plants m−2 at Roseworthy and 51 and 117 plants m−2 at Tarlee, respectively. The relationship between weed seedling emergence and rainfall observed in this study was unexpected and suggests other factors such as seed decay could be affecting seedling recruitment. Typically, soils high in OC and water content show greater microbial diversity and activity (Anderson and Domsch Reference Anderson and Domsch1989), which could influence rates of weed seed decay and seedling recruitment (Chee-Sanford et al. Reference Chee-Sanford, Williams, Davis and Sims2006). A decline in seedling recruitment with increasing soil microbial biomass was evident for both populations at the three locations (Figure 8). The combination of increased rainfall and microbial activity at Tarlee and Roseworthy compared with Karoonda (Table 3) could have caused rapid seed decay and reduced seedling recruitment. Chee-Sanford et al. (Reference Chee-Sanford, Williams, Davis and Sims2006) suggested that the seeds of some weed species may be a major source of carbon and nitrogen for microorganisms and that the ratio of these nutrients has the potential to influence both the microbial community and the susceptibility of seeds to decay. Although the specific compounds comprising the carbon and nitrogen of the weed seeds were not characterized here, seeds of L. lobatum do appear to be highly vulnerable to decay by microbial communities. This trend was also reflected in seedbank persistence and seedling recruitment of both populations at Karoonda in year 2 (Table 4), whereas no seedling recruitment was observed at Roseworthy and Tarlee over the same period. Closer examination of the susceptibility of L. lobatum seeds to decay and the biological mechanisms involved would be required to distinguish soil microbial effects from abiotic influences on persistence of seeds in soil. These results, however, are consistent with the observed occurrence of L. lobatum on sandy-textured and low-OC soils in southern Australia.
Field seedling emergence of two Limonium lobatum populations S8 (solid line) and S12 (dashed line) at Karoonda, Roseworthy, and Tarlee, South Australia. Each data point represents the mean of three replicates; curves were fit using Equation 2. For S8 population: Y=1152.15/[1+e−(x−96.9)/22.72], (R2=0.957) at Karoonda; Y=375.25/[1+e−(x−119.0)/13.13], (R2=0.997) at Roseworthy; and Y=50.54/[1+e−(x−148.1)/13.89], (R2=0.908) at Tarlee; and for S12 population: Y=1035.42/[1+e−(x−94.0)/26.23], (R2=0.956) at Karoonda; Y=230.24/[1+e−(x–116.9)/18.18], (R2=0.991) at Roseworthy; and Y=116.82/[1+e−(x−70.5)/48.97], (R2=0.857) at Tarlee. The vertical bars are the standard error of the mean.

Relationship between field seedling recruitment of two Limonium lobatum populations S8 (solid line) and S12 (dashed line) and soil microbial biomass carbon at Karoonda, Roseworthy, and Tarlee, South Australia. Each data point represents the mean of three replicates, and the vertical bars are the standard error of the mean.
Soil characteristics and soil microbial activity at experimental field sites.Footnote a

a Abbreviations: OC, organic carbon; SBR, soil basal respiration; SMBC, soil microbial biomass carbon.
Seedling recruitment from the seedbank of two Limonium lobatum populations (S8 and S12) in 2016 and 2017 at Karoonda, Roseworthy, and Tarlee, South Australia.

a Each data value represents the mean of three replicates. Values (mean±SE) within column followed by different letters are significantly different (Fisher’s protected LSD test P≤0.01).
Our results suggest that L. lobatum is capable of germinating over a range of environmental conditions and appears well adapted to the Mediterranean environment of southern Australia. Seeds were able to germinate over a broad range of temperatures (5 to 30 C), with maximum germination (~92%) occurring at temperatures between 10 and 30 C. This species has a low base temperature (1.4 to 3.9 C), so it can germinate and emerge under field conditions after rainfall events over several months in autumn and winter. Seedling emergence appears to be optimum from the soil surface; therefore no-till farming systems that concentrate the weed seedbank on the soil surface would be ideally suited to this species. Seeds were dormant for a relatively short time of about 2 mo after maturity, but dormancy was easily broken with physical scarification and treatment with NaOCl, which suggests the seed coat contributes to regulation of seed germination. However, the seed coat does not affect permeability of water. Limonium lobatum seed germination was more tolerant to moderate levels of salt stress than many other local weed species; this trait could allow this species to invade saline soils found in this region. However, seeds appear vulnerable to rapid decay, especially on soils with high OC and microbial biomass and with higher rainfall. Greater seedling recruitment and longer persistence of the seedbank associated with sandy-textured, low-OC, and low–microbial activity soils in this study could explain greater abundance of L. lobatum on such soils in low-rainfall areas of southern Australia.
Acknowledgments
This research was kindly funded by the Grains Research and Development Corporation (project UA00156). The authors would also like to acknowledge Jerome Martin and Malinee Thongmee for providing technical support. No conflicts of interest have been declared.