Coronary artery disease (CAD) results from a build up of atherosclerotic plaques in the coronary arteries. A major concern with CAD is narrowing of the blood vessels which increase the risk of death. Common treatment options for CAD include medical management, coronary artery bypass graft (CABG) surgery, and percutaneous coronary intervention (PCI) where a balloon catheter is inflated to unblock the narrowed artery. Although successful in unblocking arteries, balloon angioplasty alone is associated with restenosis rates as high as 40 percent (Reference Kastrati, Hall and Schomig25). As a result, PCI procedures are typically accompanied by the insertion and deployment of a small stainless steel mesh tube known as a coronary artery stent. Although representing a significant improvement over balloon angioplasty alone, the first class of coronary artery stents, known as bare metal stents (BMS), were associated with restenosis rates as high as 30 percent (Reference Kastrati, Hall and Schomig25;Reference Rankin, Spinelli and Carere46).
Drug-eluting stents (DES) were developed as an enhancement to BMS to specifically address the issue of high restenosis rates. DES are coated with polymer matrix containing drugs that have been shown to interrupt cellular replication and reduce neo-intimal hyperplasia (Reference Curfman11;Reference Herdeg, Oberhoff and Baumbach19). At the time of conducting the study, there were two DES available on the Canadian market, Cypher™ Sirolimus-eluting stent (Cordis) and Taxus® Express paclitaxel-eluting stent (Boston Scientific). Initial studies comparing DES to BMS suggested DES restenosis rates of 0 percent (Reference Morice, Serruys and Sousa36). However, subsequent randomized controlled trials (RCT) showed restenosis rates less than 10 percent for DES-treated patients compared to 30 percent in BMS-treated patients (23;Reference Moses, Leon and Popma37;Reference Schampaert, Cohen and Schluter50;Reference Schofer, Schluter and Gershlick51). Recent evidence from longer term registries based on large cohorts suggest that DES may not be as effective compared to BMS when used in “real-world” practice, when patients are not monitored as closely using routine angiograms like under trial conditions or when they are used in a broader range of patients (e.g., off-label use) (Reference Beohar, Davidson and Kip4;Reference Lagerqvist, James and Stenestrand27;Reference Marroquin, Selzer and Mulukutla32;Reference Tu, Bowen and Chiu55).
As a result, determining the cost-effectiveness (CE) or cost-utility (CU) of DES compared to BMS is important and is likely to vary across studies and jurisdictions for several reasons. For example, the CE/CU of DES compared to BMS will be influenced by modeling assumptions and geographic-specific factors, such as the relative price of DES compared to BMS, the absolute and relative rates of revascularization procedures, the types of patients treated (e.g., all patients or high risk subgroups only), the cost of revascularization procedures, waiting times for specialist consultation and subsequent PCI or CABG procedure, and quality of life (QOL) issues like the extent of decreased QOL (disutility) patients with angina symptoms experience and the extent of disutility and length of time in recovery post PCI or CABG procedure. A recent review of CE studies found that results have a strong jurisdiction influence, suggesting the necessity of conducting geographic-specific analyses (Reference Ligthart, Vlemmix and Dendukuri29). In light of this evidence, the specific objective of this study was to determine the CE and CU of DES in Ontario, Canada, using a large prospective “real-world” cohort study and determine the extent to which the CE and CU varies by patient risk subgroups.
METHODS
Overview of Data Collection, Model Structure, and Economic Evaluation
In 2002, the Ontario Ministry of Health and Long Term Care (MOHLTC) conducted a review of the evidence comparing DES to BMS and based on this review the Ontario Health Technology Advisory Committee (OHTAC) concluded there was insufficient evidence for the MOHLTC to make evidence-based long-term funding decisions on DES (Reference Cohen33;41). Concerned with both the paucity and generalizability of the existing evidence to the Ontario setting, the MOHLTC and OHTAC commissioned the Programs for Assessment of Technology in Health (PATH) Research Institute to conduct a field evaluation to compare the “real-world” clinical and cost-effectiveness of DES relative to BMS (Reference Goeree and Levin15;45).
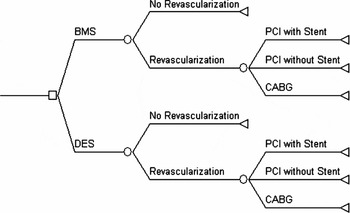
Safety, effectiveness, resource utilization, and waiting time information for procedures from the field evaluation was combined with cost estimates for stents, procedures, hospitalizations, and specialist consultations and QOL information from the literature for patients with and without angina symptoms and for recovery periods post CABG or PCI procedure. A decision analytic model (see Figure 1 for simple basic structure of the model) was developed to combine the study data and literature-based QOL information to allow for the estimation of 2-year cost-effectiveness and cost-utility of DES compared to BMS. Dominance was first assessed (i.e., if either BMS or DES was both less costly and more effective) and if a trade-off existed between additional costs and effects, incremental cost-effectiveness was calculated as the cost per revascularization avoided and incremental cost-utility as cost per quality-adjusted-life-year (QALY) gained. All costs are expressed in 2007 Canadian dollars and the perspective of the analysis was the Ontario MOHLTC (i.e., third party payer). Costs and effects in year 2 were discounted at 5 percent in the base case.
General structure of the decision analytic model. For illustrative purposes, the structure shown here only presents the index percutaneous coronary intervention (PCI) procedure, revascularization chance nodes, and the type of revascularization procedure. The actual model includes other events (e.g., myocardial infarction and death from various causes) and additional complexities such as the type and number of stents inserted during revascularization procedures and wait times (both of which depend on diabetes status, vessel diameter, and lesion length) and utility valuations for time with symptoms and recovery post PCI or coronary artery bypass graft (CABG). BMS, bare metal stent; DES, drug-eluting stent.

Data for Treatment Effectiveness, Resource Utilization, and Waiting Time Information
Data collection for the field evaluation was coordinated through the Cardiac Care Network (CCN) of Ontario by means of an existing CARDIACCESS patient registry database (9). All patients in the province undergoing a PCI procedure with the insertion of one or more coronary artery stent(s) (BMS, DES) were prospectively recruited from all 12 regional interventional cardiac care centers. CCN data were combined with record linkage information available from the Institute of Clinical and Evaluative Sciences (ICES) databases to determine patient specific resource utilization and longer term safety and effectiveness data (23).
Although the CCN database is ongoing, patients for this study were recruited between December 1, 2003 and March 31, 2005 to ensure all patients had a minimum of 1 year of follow-up data. For the survival analysis, patients were followed for a minimum of 1 year and up to 2 years after procedure. Patients were excluded from the study if they had both a BMS and DES inserted during the index procedure, if they had undergone a PCI in the previous year to the index procedure, if they had an invalid Ontario Health Insurance Plan (OHIP) card number, or if they had missing important prognostic factor information needed for the analysis (see below). The study received Research Ethics Board (REB) approval from Sunnybrook Health Sciences Centre, Toronto, Ontario. Under Ontario legislation, written informed consent was waived as participation in the CCN registry is legislated in the province. Additional details of the study and patient recruitment have been previously reported (Reference Tu, Bowen and Chiu55).
Analysis of Clinical Outcomes for Study Participants
A total of 18,314 patients underwent a PCI procedure at one of the twelve PCI centers in Ontario during the study recruitment period. Of these patients, 4,861 were excluded from the analysis due to meeting one or more of the study exclusion criterion, leaving 13,353 patients potentially available for analysis. Of these patients, a total of 8,247 received one or more BMS and 5,106 received one or more DES during the index PCI procedure. Characteristics of these patients have been reported previously (Reference Tu, Bowen and Chiu55).
Due to the nonrandomized nature of patient recruitment into the study, a propensity score matching process was used to control for any baseline imbalances between BMS- and DES-treated patients. Several patient, stent, and lesion characteristics were considered for use in the matching process (Reference Tu, Bowen and Chiu55). To determine which variables would be used in the propensity score matching univariate analysis was first conducted on the available explanatory variables. Variables that were significantly associated, at the .05 level, with the main clinical outcomes of target vessel revascularization (TVR), myocardial infarction, or death were then included in propensity score matching. Of the twenty-one variables identified as significantly associated with one or more of the primary clinical outcomes, a propensity score matched cohort was created by matching a BMS-treated patient with a DES-treated patient (i.e., 1:1 match). A nearest neighbor matching algorithm was used based on the patient's diabetes status and matching of other prognostic variables using a caliper width of less than 0.2 times the standard deviation of the propensity score (Reference Austin and Mamdani1).
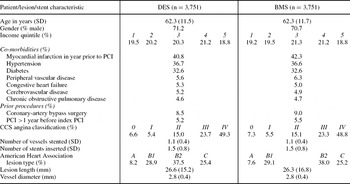
Based on the logit of the propensity score algorithm, 3,751 matched pairs of patients were identified for use in the analysis. As shown in Table 1, these patients were well matched on patient characteristics (i.e., age, gender, income quintile, co-morbidity conditions, prior cardiac procedures, and Canadian Cardiovascular Society angina classification) and lesion/stent characteristics (i.e., number of vessels stented, number of stents inserted, American heart Association lesion type, lesion length, and vessel diameter).
Baseline patient, lesion and stent characteristics after propensity score matching

Source: Tu et al. (Reference Tu, Bowen and Chiu55).
BMS, bare metal stent; DES, drug eluting stent; PCI, percutaneous coronary intervention; CABG, coronary artery bypass graft; SD, standard deviation; CCS, Canadian Cardiovascular Society.
Resource Utilization, Unit Costs, and Costing
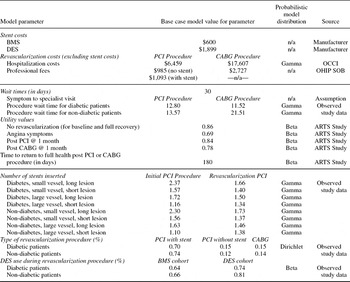
Resource utilization information such as the type and number of stents inserted during index and follow-up revascularization procedures, rates of revascularization, and the type of revascularization procedure performed (e.g., PCI with or without stent, CABG) were collected prospectively on all patients. These resource utilization data were used as inputs into the broader decision analytic model. Based on the field evaluation data, and as shown in Table 2, it was determined that approximately 1.5 BMS or DES were inserted, on average, into patients during PCI procedures, with this number being slightly higher during the index PCI procedure (range, 1.10 to 2.37, depending on risk subgroup) than for follow-up revascularizations (range, 1.34 to 1.73, depending on risk).
Cost, utility and utilization model parameter values

BMS, bare metal stent; DES, drug eluting stent; PCI, percutaneous coronary intervention; CABG, coronary artery bypass graft; OCCI, Ontario Case Costing Initiative; OHIP SOB, Ontario Health Insurance Plan Schedule of Benefits.
Small vessel, <3 mm; large vessel, ≥ 3 mm; short lesion, < 20 mm; long lession, ≥ 20 mm.
It was determined that the type of revascularization procedure performed was slightly different for diabetic and nondiabetic patients, with diabetic patients more likely to have a CABG or follow-up PCI without a stent. There was also a difference in the rate of DES use in subsequent revascularization procedures among diabetic and nondiabetic patients initially treated with a BMS or DES. For BMS-treated patients, the rate of DES use in subsequent revascularization procedures was 64 percent in diabetic patients and 66 percent in nondiabetic patients. The rates of subsequent DES use were higher in the DES-treated patients (i.e., 74 percent in diabetic patients and 81 percent in nondiabetic patients).
Unit costs used in the analysis are also presented in Table 2. We obtained average stent selling cost estimates directly from each manufacturer and then applied market shares to estimate Ontario weighted average BMS and DES costs (i.e., $600 and $1,899, respectively). The stent cost differential of nearly $1,300 was tested in a sensitivity analysis (see below). Hospitalization costs (excluding stent costs) for a PCI procedure was based on a sample of 519 detailed costing records from one of the PCI centers participating in the Ontario Case Costing Project (OCCP), whereas the cost of CABG was obtained directly from the OCCP database based on all PCI centers in the province (40). Physician fees for PCI and CABG were derived from the Ontario Schedule of Benefits for insured medical services (42).
Valuation of Patient Outcomes for Utility Assessment
Quality of life estimates, as measured by total QALYs over 2 years, were derived by combining information on rates of revascularization, waiting times for specialist consultation and subsequent PCI or CABG procedures, decreased QOL (i.e., disutility) patients with angina symptoms experience during waiting times, the length of time in recovery post PCI or CABG procedure, and the decreased QOL (i.e., disutility) during these surgical recovery periods. Total wait time for revascularization was the summation of the time of onset of angina symptoms to specialist consultation and the actual wait-time from specialist referral to revascularization procedure. As shown in Table 2, it was assumed that the wait time from angina symptom onset to specialist consultation was 15 days. This waiting time estimate was tested in a sensitivity analysis (see below). Wait times from specialist consultation until revascularization procedure was obtained from the CCN CARDIACCESS database for the study patients. As shown in Table 2, these average wait times were different for diabetic and nondiabetic patients and for PCI versus CABG procedures.
Utility values were not collected on the study patients; therefore, values from the literature were used. Utility values for patients with no symptoms, patients with symptoms and at selected time points post PCI or CABG procedure (i.e., 1 month, 6 months) were obtained from the Arterial Revascularization Therapies Study (ARTS) (Reference Serruys, Unger and Sousa52). As reported in Table 2, utility values for patients with no symptoms was 0.86, for patients with angina symptoms 0.69, for PCI recovery at 1 month 0.84, and for CABG recovery at 1 month 0.78. Based on the ARTS, it was assumed patient's utility values would completely return to normal (i.e., 0.86) 6 months following either the PCI or CABG procedure, and we assumed a straight line QOL recovery between the measured time intervals from the ARTS.
Analysis of Model Parameter Uncertainty
All stochastic model input parameters were expressed using probability distributions derived primarily from the study participants. Modeling assumptions were varied through a series of deterministic sensitivity analyses on the probabilistic model (see below). The assumed probability distributions used for each stochastic model input parameter are presented in Tables 2 and 3. These probability distributions were expressed using generally accepted standards and conventions (Reference Briggs, Claxton and Sculpher6). Beta distributions were assumed for probabilities in the model, Gamma distributions were used for cost variables and variables on the number of stents inserted, and a Dirichlet distribution was assumed for the type of revascularization procedure received as there were three alternative types of procedures patients could receive (i.e., PCI with stent, PCI without stent, CABG).
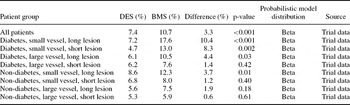
Target vessel revascularization rates, all patients and by risk subgroups

Source: Tu et al. (Reference Tu, Bowen and Chiu55).
BMS, bare metal stent; DES, drug eluting stent.
Small vessel, <3 mm; large vessel, ≥ 3 mm; short lesion, < 20 mm; long lession, ≥ 20 mm.
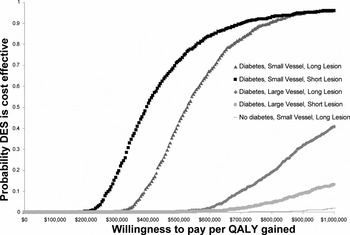
Monte Carlo simulation techniques, using 1,000 trials for each separate run of the model, were used for the probabilistic analysis. Average costs, effects, cost-effectiveness, and cost-utility results were based on means of the simulated results. Uncertainty in the results was expressed using cost-effectiveness acceptability curves (CEACs) showing the probability BMS or DES is cost-effective as a function of societies' willingness-to-pay (WTP) for a unit of outcome (i.e., QALY gained). For graphical representation, WTP values (thresholds) ranging from $0 to $1,000,000 are presented; however, the results were calculated for the full range of possible threshold values.
Sensitivity Analyses of Key Modeling Assumptions
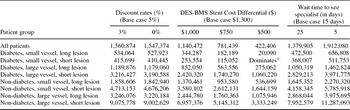
Key assumptions for the model that were not based on stochastic data from the study participants (e.g., wait time for specialist consultation, BMS to DES cost differential, and discount rates assumed for future costs and effects) were varied using deterministic sensitivity analysis on the underlying probabilistic model. Specialist consultation wait times were varied from 5 to 25 days (15 days in base case), the DES minus BMS cost differential was varied from $500 to $1,000 ($1,300 in base case), and discount rates were varied from 0 percent to 3 percent (5 percent in base case).
RESULTS
Clinical Outcomes for Study Participants
As shown in Table 3 and as reported previously, patients treated with DES had a significantly lower 2-year TVR rate compared to BMS-treated patients (10.7 percent versus 7.4 percent; p < .001) (Reference Tu, Bowen and Chiu55). However, these results for all patients mask an important underlying finding in that the overall difference across all patients is driven primarily by differences in patient risk. Significant differences in TVR rates were found only in patient subgroups with two or more of the three high risk factors (i.e., diabetes, small vessel, long lesion). The absolute difference in TVR rates ranged from 3.7 to 10.4 for these patients. Differences in TVR rates, ranging from 0.6 to 1.9 for patient subgroups with one or fewer high risk factors, were not significantly different between DES- and BMS-treated patients.
Expected Costs, QALYS, Cost-effectiveness, and Cost-utility
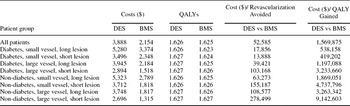
The 2-year expected cost and QALY results based on the probabilistic model are presented in Table 4 for the DES and BMS cohorts for all patients and for the eight patient risk subgroups. Across all patients, the expected 2-year cost was $1,734 higher for DES-treated patients, and this difference ranged from $1,148 to $2,534, depending on the patient subgroup. However, DES patients also experienced, on average, 0.033 fewer revascularizations (ranging from 0.006 to 0.104 as shown in Table 3) and 0.0013 additional QALYs (ranging from 0.0001 to 0.0018, depending on the patient subgroup).
Expected 2-year costs, outcomes, cost-effectiveness and cost-utility based on probabilistic model, all patients and by risk subgroups

BMS, bare metal stent; DES, drug eluting stent; QALY, quality adjusted life year.
Small vessel, <3 mm; large vessel, ≥ 3 mm; short lesion, < 20 mm; long lession, ≥ 20 mm.
Because there was a trade-off between higher costs and better patient outcomes for DES-treated patients, cost-effectiveness and cost-utility ratios were calculated. Across all patients, the cost-effectiveness of DES was $52,600 per revascularization avoided, and this ranged from $14,000 to $279,000 per revascularization avoided depending on the patient subgroup. The overall cost-utility results for DES was $1,301,000 per QALY gained, and this ranged from a low of $347,000 to a high of $7,476,000 per QALY gained. The most favorable cost-effectiveness and cost-utility results were found for patients with two or more of the three high risk factors (i.e., diabetes, small vessel, long lesion).
Parameter uncertainty based on the cost-utility simulation results of stochastic model variables is shown in Figure 2 for the four diabetes subgroups and for nondiabetes with small vessels and long lesions. The CEACs show that, after accounting for stochastic parameter uncertainty, the probability that DES are cost-effective do not materialize in any subgroup until after thresholds of at least $350,000 per QALY gained are reached. The results for the other three nondiabetes subgroups (not shown in Figure 2) are less favorable.
Cost-effectiveness acceptability curves, by patient risk subgroups. DES, drug-eluting stents; QALY, quality-adjusted life-year.

Sensitivity Analyses on Key Modeling Assumptions
The results of the deterministic sensitivity analyses on key modeling assumptions are presented in Table 5. These results show that the cost-utility results are fairly insensitive to alternative discount rate assumptions. The cost-utility results are more sensitive to alternative assumptions regarding waiting times for specialist consultation; however, the qualitative conclusions of the results do not change. The modeling assumption with the biggest impact on the cost-utility results was the differential in cost between DES and BMS. With a cost difference of $750, the cost-utility results for two of the patient subgroups fall below $200,000 per QALY gained. If the cost differential is $500, DES even dominate BMS for diabetics with small vessels and short lesions and the cost-utility is $20,000 per QALY gained for diabetics with small vessels and long lesions.
Sensitivity Analyses on Key Modeling Assumptions ($/QALY Gained), All Patients and by Risk Subgroups

1DES dominates BMS (lower expected cost and higher QALYs).
BMS, bare metal stent; DES, drug eluting stent; QALY, quality adjusted life year.
Small vessel, <3 mm; large vessel, ≥ 3 mm; short lesion, < 20 mm; long lession, ≥ 20 mm.
DISCUSSION
Several trial- and modeling-based CE studies have been conducted comparing DES to BMS. Some CE studies have concluded that DES are cost-effective or represent good value for money, some have concluded that DES are not cost-effective, and some have concluded that DES are only cost-effective in selected patient subgroups (Reference Bagust, Grayson and Palmer2;Reference Bakhai, Stone and Mahoney3;Reference Bowen, Hopkins and Chiu5;Reference Brophy and Erickson7;Reference Brunner-La Rocca, Kaiser and Bernheim8;Reference Cohen, Bakhai and Shi10;Reference Ekman, Sjogren and James13;Reference Galanaud, Delavennat and Durand-Zaleski14;Reference Greenberg, Bakhai and Cohen16;Reference Greenberg and Cohen17;Reference Hill, Bagust and Bakhai20;Reference Hill, Boland and Dickson21;Reference Kaiser and Brunner-La Rocca24;Reference Lord, Howard and Allen30;Reference Mahieu, De Ridder, De Graeve, Vrints and Bosmans31;34;Reference Mittmann, Brown and Seung35;Reference Oliva, Espallargues and Pons38;Reference Ong, Daemen and van Hout39;Reference Polanczyk, Wainstein and Ribeiro44;Reference Rinfret, Cohen and Tahami Monfared47–Reference Russell, anzas and Mainar49;Reference Shrive, Manns and Galbraith53;Reference Tarricone, Marchetti and Lamotte54;Reference van Hout, Serruys and Lemos56). It would not be feasible to compare our results to the results from each of these studies, as several factors contribute to different study findings. Cost-effectiveness results are influenced by relative prices of DES compared to BMS, differences in rates of revascularization procedures for DES compared to BMS, the types of patients treated (e.g., all patients or high risk subgroups only), the cost of revascularization procedures, waiting times for specialist consultation and subsequent PCI or CABG procedures, and assumed QOL utility values for patients without symptoms, patients with angina symptoms, and patients undergoing PCI or CABG surgical procedures.
Most of the underlying differences in CE results across studies and jurisdictions can be explained by assumed or measured differences in revascularization rates between DES- and BMS-treated patients. Because the disutility associated with angina symptoms during waiting times for consultation and procedures, and the disutility associated with PCI or CABG procedures drive the expected utility estimates, studies that assume or measure larger absolute differences in revascularization rates, for example in the 15 to 30 percent range, will naturally obtain more favorable cost-utility estimates for DES. In our “real-world” field evaluation, the largest absolute difference in revascularization rates we observed was 10 percent for diabetics with small vessels and long lesions. Most of the absolute differences in revascularization rates we observed were under 4 percent, and it is questionable whether some of these differences would be considered clinically meaningful and important. However, there are some differences in methodological assumptions across studies that explain the differences in CE results. For example, Shrive et al indirectly incorporated a mortality benefit for DES and assumed the disutility associated with a PCI or CABG procedure would last a whole year (Reference Shrive, Manns and Galbraith53). Both of these assumptions would obviously have a significant and favorable impact on the CE estimate for DES.
There have been three systematic reviews of the CE literature that have tried to summarize the findings across studies and explain any differences. Kuukasjarvi et al. conducted a review of thirteen CE studies and found that the evidence was inconsistent whether DES are cost-effective or not and concluded that a marked difference in revascularization rates would need to be achieved to justify the higher cost of DES (Reference Kuukasjarvi, Rasanen and Malmivaara26). Hill et al. reviewed ten CE studies and concluded that the balance of evidence indicates that DES are more cost-effective in higher risk patients (Reference Hill, Boland and Dickson21). And finally, Ligthart et al. conducted an interesting analysis of nineteen CE studies by mapping author findings against study quality, source of funding (e.g., industry), date of analysis, and location of analysis (Reference Ligthart, Vlemmix and Dendukuri29). The finding was that studies that supported widespread adoption of DES tended to be of lower quality, industry-sponsored, and to originate from the United States.
There are several strengths and limitations of our study worthy of mention. One of the limitations of our study is that, because the patient population data are not based on a randomized controlled trial, there may still be unmeasured and, therefore, unmatched confounding factors that may affect our clinical findings and therefore the CE results. Second, our results may not be generalizable to other jurisdictions that do not have similar health insurance coverage plans as in Ontario. For example, in Ontario dual antiplatelet therapy (e.g., aspirin, clopidogrel) for residents over age 65 is available at minimum cost for a period of 1 year following stent implantation for all DES patients and a minimum of 6 weeks and up to a year for BMS patients (43;Reference Tu, Bowen and Chiu55). As there is increasing evidence demonstrating the benefits of prolonged use of dual antiplatelet therapy for both BMS- and DES-treated patients, our effectiveness results may be different from that found in other jurisdictions or from trials with different allowances for antiplatelet therapy use (Reference Eisenstein, Anstrom and Kong12;Reference Grines, Bonow and Casey DE18;Reference Tu, Bowen and Chiu55). Third, although our study was not designed to address differences in mortality, we did observe a mortality benefit in favor of DES. Because controlled trials have not found a similar mortality benefit for DES, we did not incorporate this into the CE analysis. Mortality difference is the subject of additional and ongoing data collection. And finally, the utility values used in the CE analysis were not based on the Ontario cohort of patients. These utility values were adopted from another study, the applicability of which to Ontario residents seems reasonable but is uncertain.
Despite these limitations, our study has several strengths worth highlighting. The primary strength of our study lies in the fact that our results are based on a large “real-world” cohort of patients. The revascularization rates we observed are based on improved generations of both BMS and DES, are not based on “artificial” protocol-driven revascularization rates, and are reflective of the “real-world” use of DES in various patient subgroups, some with multiple complex lesions, and not simply patients with single “de novo” lesions as studied in some of the early RCTs. Another major strength of our study is that the propensity score process identified a large well-matched BMS control cohort for use in the analysis. And finally, the use of the CCN registry provided us with an evaluable database made up of all PCI patients in the province, thus increasing generalizability. This, combined with the record linkage capability of the ICES administrative databases, allowed us to achieve virtually 100 percent complete follow-up on all patients in the study.
CONCLUSIONS
A field evaluation designed to compare the effectiveness and cost-effectiveness of BMS to DES in a large “real-world” Ontario population-based setting was conducted. The study outcome data from a propensity-score matched cohort were combined with resource utilization data, cost data, and QOL data in a decision analytic model framework to assess the 2-year cost-effectiveness and cost-utility of DES compared with BMS. It was found that DES-treated patients had a lower rate of revascularization overall, but that this difference was driven primarily by differences in selected patient risk subgroups. In particular, significant differences were found only in patient subgroups with two or more of the three high risk factors of diabetes, small vessels, and long lesions. Despite significant differences in revascularization rates for selected patient subgroups, these differences did not translate into substantial QOL improvement estimates, as measured by QALYs, which ranged from $347,000 to $7,476,000 per QALY gained in the base case. As a result, DES would not be considered cost-effective according to conventionally quoted benchmarks (Reference Laupacis, Feeny and Detsky28). Sensitivity analyses on modeling assumptions revealed that only stent cost differentials had a qualitative impact on the cost-effectiveness results and conclusions. For cost differentials below $750, the cost-effectiveness of DES compared to BMS became more cost-effective for selected patient subgroups. To the extent increasing competition or newer generations of DES will reduce the cost differential of DES relative to BMS, the cost-effectiveness of DES will become more attractive.
ACKNOWLEDGMENTS
Funding and support for this study was provided by the Ontario Ministry of Health and Long Term Care (MOHLTC) and the Ontario Health Technology Advisory Committee (OHTAC). The PATH Research Institute, ICES, and CCN receive core funding from the MOHLTC; however, the results, conclusions, and views expressed in this study are those of the authors only. Jean-Eric Tarride is supported by a Career Scientist award from the MOHLTC. The authors acknowledge that the data used in this publication are from the CCN of Ontario and its member hospitals (Hamilton Health Sciences Corporation, Kingston General Hospital, London Health Sciences Centre, Rouge Valley Health System, Southlake Regional Health Centre, Hôpital Régional de Sudbury Regional Hospital, Sunnybrook Health Sciences Centre, St. Mary's General Hospital, St. Michael's Hospital, Trillium Health Centre, University Health Network, and the University of Ottawa Heart Institute), and the authors sincerely thank the participating site cardiologists and research nurses for time and effort devoted to study data collection. The CCN serves as an advisory body to the MOHLTC and is dedicated to improving quality, efficiency, access, and equity in the delivery of the continuum of adult cardiac services in Ontario.
CONTACT INFORMATION
Ron Goeree, MA (goereer@mcmaster.ca), Associate Professor, Department of Clinical Epidemiology and Biostatistics, McMaster University; Director, Programs for Assessment of Technology in Health (PATH) Research Institute, St. Joseph's Healthcare, 25 Main Street West, Suite 2000, Hamilton, Ontario L8P 1H1, Canada
James M. Bowen, BScPhm, MSc (bowenj@mcmaster.ca), Research Associate, Gord Blackhouse, MSc (blackhou@mcmaster.ca), Research Associate, Department of Clinical Epidemiology & Biostatistics, McMaster University, Programs for Assessment of Technology in Health (PATH) Research Institute, 25 Main Street West, Suite 2000, Hamilton, Ontario L8P 1H1, Canada
Charles Lazzam, MD (charles.lazzam@sympatico.ca), Department of Medicine, Trillium Health Centre, 101 Queensway West, Suite 206, Mississauga, Ontario L5B 2P7, Canada
Eric A. Cohen, MD, FRCPC (eric.cohen@sunnybrook.ca), Director, Cardiac Catheterization Laboratory, Sunnybrook Health Sciences Centre; Associate Professor; Department of Medicine; Maria Chiu, BSc, MSc (maria.chiu@ices.on.ca), Institute for Clinical Evaluative Sciences, Institute of Medical Science, University of Toronto, G106–2075 Bayview Avenue, North York, Ontario M4N 3M5, Canada
Robert Hopkins, BA, BSc, MA, MBA (hopkinr@mcmaster.ca), Research Associate, Jean-Eric Tarride, PhD (tarride@mcmaster.ca), Assistant Professor, Department of Clinical Epidemiology & Biostatistics, McMaster University, Programs for Assessment of Technology in Health (PATH) Research Institute, 25 Main St. West, Suite 2000, Hamilton, Ontario L8P 1H1, Canada
Jack V. Tu, MD, PhD (tu@ices.on.ca), Professor, Department of Medicine, University of Toronto; Senior Scientist, Institute for Clinical Evaluative Sciences, Sunnybrook Health Sciences Centre, G106–2075 Bayview Avenue, Toronto, Ontario M4N 3M5, Canada