




No CrossRef data available.
Trajectories of dynamic predictors of disorder: Their meanings and implications
Published online by Cambridge University Press: 01 December 2004
Abstract
Developmental psychopathologists are increasingly focused on characterizing heterogeneity of trajectories of psychological disorders across the life course (e.g., developmentally limited vs. chronic forms of disorder). Although the developmental significance of trajectories has been highlighted, there has been little attention to relations between trajectories and their etiologically and clinically relevant time-varying covariates (dynamic predictors). Depending upon the functional relation between a disorder and a dynamic predictor, we expect to see different trajectories of dynamic predictors. Thus, we propose a taxonomy of trajectories of dynamic predictors of course of disorder and provide an initial investigation into its validity. Using a mixed-gender, high-risk sample of young adults followed over 7 years, we identified dynamic predictors that covary with the course of alcohol use disorder (AUD). Based on a logically derived classification to facilitate interpretation of findings, three comparison groups were examined: persons whose AUD “remitted” (n = 33), those with a chronic AUD (n = 29), and nondiagnosers (n = 274). We hypothesized seven patterns of dynamic prediction (stable vulnerability indicators, course trackers, deterioration markers, developmentally specific variables, developmental lag markers, course-referenced variables, and recovery behaviors) and found evidence for five of them. The interpretation of markers of risk for development and course of AUDs and their implications for prevention, early intervention and formal/self-change treatments are discussed.Preparation of this article was supported by NIH Grants R37AA07231 and R01AA013987 to Kenneth J. Sher and P50 AA11998 to Andrew Heath from the National Institute on Alcohol Abuse and Alcoholism. Portions of this research were presented at the annual meeting of the Research Society on Alcoholism, Denver, CO, June 2000; the biennial meeting for the Society for Research on Adolescence, April 2000; and the Michigan Symposium on Developmental Discontinuities, June 2002. We gratefully acknowledge Laurie Chassin, Patrick Curran, Andrea Hussong, Kristina M. Jackson, Jenny Larkins, Terrie Moffitt, and Susan O'Neill for providing numerous, helpful comments on an earlier version of this article.
Information
- Type
- Research Article
- Information
- Copyright
- © 2004 Cambridge University Press
In recent years, there has been increasing recognition that the modal or mean course of disorder in an age cohort reflects a mixture of multiple courses or “trajectories” (e.g., Achenbach, 1990; Bates, 2000), and the mean trajectory itself may fail to reflect any individual in the population. Problems with focusing on the group mean have been recognized by methodologists for many years (e.g., Estes, 1956), and developmental psychopathologists (e.g., Moffitt, 1993; Zucker, 1987, 1995) have stressed the practical and theoretical importance of distinguishing among courses of psychopathology. Although the emphasis on course would appear to be a recent trend, more than 100 years ago Emil Kraepelin (1899), arguably the most influential psychopathologist to date, highlighted the importance of course in diagnosis (especially in distinguishing what are today called schizophrenia and bipolar disorder). The “neoKraepelinians,” who were the architects of the Diagnostic and Statistical Manual of Mental Disorders, 3rd edition (DSM-III; American Psychiatric Association [APA], 1980), 3rd edition—Revised (DSM-III-R; APA, 1987), and 4th edition (DSM-IV; APA, 1994), embraced the careful syndromal description pioneered by Kraepelin and recognized the importance of longitudinal observations (e.g., Spitzer, 1983). However, the dominant nosology has largely failed to implement variation in course into today's formal framework. Although the DSM-IV does list “course specifiers” for some disorders, the DSM-IV's incorporation of course information is both limited and not systematic across disorders.
Although quantitative methods such as cluster analysis have been used to study heterogeneity in course of various behaviors (e.g., binge drinking; Schulenberg, O'Malley, Bachman, Wadsworth, & Johnston, 1996), the development and diffusion of statistical methods and software for conducting growth mixture models (e.g., Jones, Nagin, & Roeder, 2001; Muthén, 2001; Muthén & Muthén, 2001; Nagin, 1999; Nagin & Tremblay, 2001) has been accompanied by a relative explosion of empirical reports of variations in trajectories of different types of psychological disorders, syndromes, symptoms, and behaviors (Bongers, Koot, van der Ende, & Verhulst, 2003; Jackson, Sher, Cooper, & Wood, 2002; Jackson, Sher, & Wood, 2000b). Although there has been, and continues to be, debate regarding the differential utility of person-centered, categorical approaches using trajectories versus more traditional variable-centered approaches (e.g., Bates, 2000; Horn, 2000; Muthén & Muthén, 2000), many developmental psychopathologists have embraced trajectory-based approaches because they highlight individual differences in development.
Despite the many reports of trajectory-based investigations in the past few years, there has been little conceptual or theoretical development regarding the relationship of covariates to these trajectories. Most typically, investigators examine the relation between fixed covariates (e.g., demographic variables, baseline individual differences) and trajectory (e.g., Galambos, Barker, & Almeida, 2003; Soldz & Cui, 2002) to identify prospective risk and protective factors for different trajectories. Consider the prototypic trajectories that can be used to describe binge drinking portrayed in Figure 1 (Schulenberg, Wadsworth, O'Malley, Bachman, & Johnston, 1996). (Note that the labels in Figure 1 have been changed from those used by Schulenberg, Wadsworth, et al., 1996, to make them more consistent with the terminology used in this article.) Most typically, comparisons, across trajectory classes, of the mean of continuous variables (or proportions of polytomous variables) measured at or before baseline are used to characterize relations between trajectories and fixed covariates. That is, test the null hypothesis μND = μLO = μFl = μRem = μChr. Additionally, some investigators have examined the relation between trajectories and time-varying covariates at specific time points (e.g., Tucker, Orlando, & Ellickson, 2003) to characterize predictors or consequences of these trajectories in a more developmental context. That is, test the null hypothesis that, say, μND.T2 = μLO.T2 = μFl.T2 = μRem.T2 = μChr.T2 and so on for each time point. Although these approaches have much merit for characterizing the fixed and time-varying correlates of trajectories, we argue below that deeper insights into the nature of the relation between a disorder and its correlate can be found by examining the mean trajectories of time-varying covariates associated with disorder. For example, comparing mean slopes μND.slope = μLO.slope = μFl.slope = μRem.slope = μChr.slope. Such comparisons, focusing on dynamic changes in a time-varying covariate, offer important clues as to the nature of the functional relationship between a disorder and its covariates.

The five types of trajectories reported in the literature for binge drinking.
Alcohol Use Disorders (AUDs) in Young Adulthood
To illustrate the heuristic value of mean trajectories of dynamic predictors, we use prospective data from our ongoing study of AUDs (alcohol abuse and dependence) in young adulthood. From a population-based, epidemiological perspective, young adulthood is clearly the time of greatest alcohol use and alcohol problems. The mean course of alcohol involvement in the United States can be summarized as follows. Most individuals begin using alcohol at approximately age 15, increase use until about age 21, and then dramatically decrease their use during the later 20s (e.g., Chen & Kandel, 1995; Johnston, O'Malley, & Bachman, 2000). Paralleling these age-related changes in consumption, rates of AUDs peak during the 20s and decrease monotonically thereafter (Grant, Harford, Dawson, Chou, Dufour, & Pickering, 1994). For many young adults, these problematic drinking patterns represent a developmentally limited phenomenon (e.g., Zucker, 1987). For others, this period represents the early stage of a more protracted course of pathologic alcohol involvement. Although several potent role transitions, such as marriage and entry into the labor market, appear related to “maturing out” of developmentally limited heavy alcohol involvement (Curran, Muthén, & Harford, 1998; Mullahy & Sindelar, 1992; Schulenberg, O'Malley, et al., 1996), relatively little is known concerning individual difference variables that distinguish those whose early-onset AUDs show a remitting versus a chronic course. Research on “natural recovery” (from alcoholism without treatment) has identified several individual difference variables associated with resolution of alcohol problems. Unfortunately, most of this research has been based on middle-aged samples, retrospective reports, and individuals who self-recognized a prior alcohol problem that was subsequently overcome (see Watson & Sher, 1998). The relevance of these findings to the normative, developmental course of alcohol problems in the general population is unclear. As the epidemiological literature on maturing out in young adulthood is relatively uninformative regarding individual differences and work on natural recovery often fails to recognize the developmental context in which most resolution of drinking problems occurs, a complete understanding requires an integration of both literatures.
A Taxonomy of Dynamic Predictors
We now consider more extensively the notion of dynamic predictors, variables that covary with AUDs over time (are measured on multiple occasions along with AUDs) and may predict the occurrence and/or course of AUDs. We consider seven patterns of dynamic predictors (Table 1, Figure 2), at times drawing on Nuechterlein and Dawson's (1984; Nuechterlein, 1990) discussion of psychopathology indicators.
Taxonomy of dynamic predictors


The seven possible patterns of dynamic predictors of alcohol use disorders over time.
Although we use the term dynamic predictors to describe variables that covary with course, the term is somewhat of a misnomer for the first pattern that we consider, what Nuechterlein and Dawson (1984) have termed stable vulnerability indicators (Figure 2). These variables remain at a consistently different level in individuals with psychopathology (whether symptomatic or asymptomatic) compared to normal controls. They may distinguish course but do not covary with course (and are, thus, nondynamic) as they remain stable even when an individual's AUD remits. Personality traits might be an example as they are thought to remain stable across long periods of development (Block, 1971; Costa & McCrae, 1986). In cases of a monotonic relation between a stable vulnerability indicator and course of disorder (i.e., no disorder, remitted course, chronic course), a severity model is implied as it suggests that the variable is indexing a severity-graded vulnerability process.
A second pattern of dynamic variables we refer to as course trackers (Nuechterlein and Dawson's mediating vulnerability factors; Figure 2). These variables differentiate individuals with a disorder compared to normal controls, but also covary with degree of symptomatology over time. They are associated with both the occurrence and course of an AUD, and are likely to decrease over time as an AUD remits. (At this point, we do not address whether the functional relation is causal or consequential.) Examples might include alcohol use and alcohol-related problems (Bates & Labouvie, 1995) and anxiety disorders (Kushner, Sher, & Erickson, 1999). Although, as noted, personality traits are generally hypothesized to be stable, several studies have found that impulsivity and sensation seeking changed in parallel with alcohol involvement during young adulthood (Bates & Labouvie, 1995; Raskin White, Bates, & Buyske, 2001).
A third pattern, closely related to course trackers, we refer to as deterioration markers (Figure 2). The basic notion is that the continued presence of a chronic disorder is associated with cumulative adverse effects. A prototype would be decreased pulmonary function as a consequence of chronic tobacco dependence. That is, increasing chronicity of an AUD is associated with increasing likelihood of certain negative effects. Although lifetime exposure gradients for some types of alcohol-related medical consequences (e.g., liver disease) have been well established (National Institute on Alcohol Abuse and Alcoholism, 2000), it is unclear to what extent we might expect to see such effects in other types of variables. (A concept closely related to, but distinct from, our definition of a deterioration marker is that of a scar. According to Zeiss and Lewinsohn [1988, p. 151], a scar pattern is defined “as a deficit observed during [a diagnostic episode] that remained after the … episode ended.” We view a deterioration marker as representing a distinct process that is cumulative, progressive, and not necessarily permanent.)
A fourth pattern of dynamic variables, that we term developmentally specific variables, is similar to what Rutter (1996, p. 212) termed “age-indexed variations in susceptibility to environmental hazards” (Figure 2). Such factors initially appear to track course (i.e., predict early occurrence of a disorder), but actually only have prognostic significance at certain ages (Rutter, 1996). For example, parents and peers might be more influential on drinking in young adulthood than in later adulthood (e.g., Curran, Stice, & Chassin, 1997; Scheier & Botvin, 1997). Role transitions (e.g., finishing education, developing intimate relationships) may be good predictors during young adulthood, but then fade in significance in later years.
A fifth pattern we have labeled developmental lag markers (Figure 2). As opposed to developmentally specific predictors, which we see as leading (i.e., etiologic) predictors related to onset or course, developmental lag markers are viewed as trailing (i.e., consequential) indicators that reflect slowed or inhibited normative developmental changes. For example, in previous work we found a dramatic decrease in self-reported distress during the early years of college (Sher, Wood, & Gotham, 1996). If pathological alcohol involvement delayed this normative decrease (perhaps by inhibiting the development of adaptive coping skills or intimate relations), we might expect a more gradual decline or later inflection point in the trajectory of decreasing distress. Thus, like course trackers, these indicators initially track course, but as development progresses with relatively little variance in the indicator as it becomes less developmentally sensitive, its course tracking ability diminishes. More important, it is a trailing indicator of course, albeit one with a slow time constant. Finally, like developmentally specific predictors, we only expect to observe developmental lag markers at stages where the marker is developmentally relevant.
We have termed a sixth pattern, course-referenced variables (Figure 2). These indicators appear to represent different constructs at different stages in the course of a disorder. Such variables may or may not initially predict a disorder's occurrence, but similar to developmentally specific variables, they have prognostic significance only at certain times. For example, early in one's drinking history various “self-control” attempts might indicate effective skills for moderating intake (remitting course), while in the context of alcohol dependence they might reflect futile attempts at overcoming “loss of control” or “inability to abstain” (Connors, Collins, Dermen, & Koutsky, 1998; Guydish & Greenfield, 1990; Werch, 1990). Therefore, in this example, we would see an initially high level of a variable that decreases with recovery, but within a chronic course the same variable emerges late. There are two major conceptual distinctions between the developmentally specific variables and course-referenced variables. The first is that developmentally specific variables predict the occurrence or persistence of a disorder only at certain ages; whereas, the predictability of course-referenced variables is moderated, not necessarily by age, but by stage of disorder (e.g., duration of problematic alcohol involvement or degree of dependence). A second distinction is that the meaning of the course-referenced variables (i.e., the constructs they indicate) changes as a function of stage of substance involvement; whereas, the fundamental meaning of the developmentally specific predictors remains constant over time even if their psychopathological relevance changes.
Finally, a seventh pattern represents recovery behaviors that are conceptually similar to the course-referenced variables, but are likely to represent long-term recovery strategies (Figure 2). As such, they may not relate to the occurrence of a disorder but later may be prognostic. For example, at baseline, few people in a young-adult sample are likely to attend Alcoholic's Anonymous (AA) meetings. However, those who later develop an AUD and then remit from it may increase their AA attendance and maintain a higher level of attendance.
Some other types of dynamic predictors may also be significant factors, but a paucity of research makes it difficult to classify them. For example, research about whether life events affect alcohol involvement has yielded conflicting results (Bates & Labouvie, 1997; Perreira & Sloan, 2001; Scheier, Botvin, & Miller, 1999; Tucker, Vuchinich, & Pukish, 1995).
Current Study
The current study seeks to identify dynamic predictors of AUDs from a range of variables shown to influence the development and cessation of alcohol problems: alcohol involvement, motivational factors for drinking and not drinking, comorbid substance abuse and psychopathology, personality variables, and social/environmental factors including life events.1
In analyses not reported here, we attempted to determine whether cognitive/neuropsychological variables measured at baseline were significant predictors of occurrence and/or course of AUDs. We used 10 variables drawn from four standard cognitive/neuropsychological instruments administered at Year 1, but the analyses failed to identify any significant baseline predictors.
Method
Participants
Baseline sample
At baseline, 489 participants were recruited from an initial screening sample of 3156 (80% of a total class of 3944) first-time freshmen at a large, midwestern university during the academic year 1987–1988. Participants were classified as family history positive for alcoholism (FH+; n = 252) if they reported biological paternal alcoholism on both a version of the Short Michigan Alcoholism Screening Test (SMAST; Selzer, Vinokur, & van Rooijen, 1975) adapted to measure paternal drinking problems (F-SMAST; Crews & Sher, 1992) and a section of the Family History-Research Diagnostic Criteria interview (Endicott, Andreason, & Spitzer, 1978) that assessed paternal drinking habits. Participants were classified as family history negative (FH−; n = 237) if they reported an absence of substance use disorders in all biological first- and second-degree relatives and an absence of antisocial personality disorder in all biological first-degree relatives (see Sher, Walitzer, Wood, & Brent, 1991). The sample was primarily of European Ancestry (94%) at a mean age of 18.4 years.
Longitudinal sample
Participants were assessed at baseline (Year 1) when they were freshmen, at three subsequent yearly intervals (Years 2, 3, and 4 corresponding to the sophomore, junior, and senior years of college for many), and again 3 years later at Year 7. The 3-year interval between the fourth and five waves of assessment was designed to capture the postcollege transition for those students who were likely to attain an undergraduate degree. By Year 7, 93.7% (n = 458) were still participating and 451 had participated at all five waves. As described more extensively elsewhere (Gotham, Sher, & Wood, 2003), at Year 7, 72% of the sample had completed a baccalaureate (BA/BS) degree, 35% were married, and 11% were parents.
At each wave, individuals were assessed for past-year DSM-III alcohol abuse and/or dependence. Considering the presence or absence of a past-year AUD diagnosis at five time points results in 32 possible temporal patterns of diagnosis (25); 30 patterns of diagnoses were identified in our sample. Figure 3 provides a graphic representation of those patterns of diagnoses exhibited by participants who diagnosed at least once. Each pattern is according to the temporal sequencing of AUD diagnosis (“1”) and nondiagnosis (“0”). Thus, a “10000” pattern represents individuals who diagnosed at Year 1 but did not diagnose at Years 2, 3, 4, and 7. Although a number of patterns are of interest,2
Although 30 temporal patterns of 12-month AUD diagnoses were found in our overall sample, this study combined several patterns into three categories of chronics, remitters, and nondiagnosers. These patterns are thought to best represent conceptually meaningful patterns studied in the literature. A large number of studies exist concerning individuals who have remitted from AUDs, especially in comparison to samples of those with long-term AUDs and those who have never had an AUD.

The temporal patterns of past-year DSM-III alcohol use disorder (AUD) diagnoses (Dx) over 7 years for those who were diagnosed at least once during the study (n = 177); 1 = AUD Dx and 0 = no Dx, with serial position corresponding to the year of data collection (e.g., 1, 2, 3, 4, or 7).
Measures
AUDs
At each wave, an AUD was diagnosed if an individual met DSM-III criteria for past-year alcohol abuse or dependence based on the Diagnostic Interview Schedule, Version III-A (DIS-III-A; Years 1 and 2; Robins, Helzer, Croughan, Williams, & Spitzer, 1985) or the DIS-III—Revised (Years 3, 4, and 7; Robins, Helzer, Cottler, & Goldring, 1989). All diagnoses were made according to DSM-III criteria to maintain diagnostic continuity.3
Note that DSM-III (APA, 1980), DSM-III-R (APA, 1987) and DSM-IV (APA, 1994) diagnoses of alcohol abuse and dependence differ. Most strikingly, the DSM-III alcohol dependence diagnosis is narrower than DSM-III-R or DSM-IV. It is based on only three symptoms, and a pattern of pathological use or impairment in social/occupational functioning. DSM-III-R alcohol dependence is based on nine symptoms, and either persistence of symptoms for at least 1 month or their repeated occurrence. DSM-IV alcohol dependence is based on seven symptoms (three or more within 12 months) and impairment in functioning or responsibilities. We compared DSM-III and DSM-III-R diagnoses at Year 7 (DSM-IV was not yet available). Of the 457 participants with complete interview data at Year 7, 41 met DSM-III-R criteria for alcohol dependence but did not meet criteria for either DSM-III alcohol dependence or abuse. Examination of variables that make up the criteria indicates that although 39 of the 41 participants did not endorse any of the 3 DSM-III dependence symptoms, they did endorse at least three of the nine DSM-III-R dependence symptoms. Researchers should be careful in comparing studies that use different systems for diagnosis and in comparing different systems of diagnoses in the same population over time.
Alcohol involvement
The following alcohol involvement variables were created from items asked on a self-report measure given at each wave of assessment.
Heavy drinking occasions
A composite of three variables was made for heavy drinking occasions per week, based on number of times participants were drunk, high on alcohol, and drank five or more drinks in one sitting over the past month (α = .91).
Alcohol-related consequences
A 14-item scale (α = .74) assessed the occurrence of negative alcohol-related consequences in the past year (e.g., fighting while drinking, damaging property).
Alcohol dependence symptoms
A 14-item scale (α = .80) assessed symptomatology of alcohol dependence displayed during the past year (e.g., feeling guilty about drinking, having blackouts).
Motivations for drinking.
Reasons for drinking
A 15-item scale adapted from Cahalan, Cisin, and Crossley (1969) asked participants to rank how much they agreed with each statement (e.g., “I drink because it helps me relax”) with responses ranging from 0 (strongly disagree) to 3 (strongly agree). The means of six subscales were used: tension reduction (2 items, α = .58), mood modification (3 items, α = .84), social conformity (4 items, α = .76), celebration (2 items, α = .69), sensation seeking (2 items, α = .51), and taste (1 item).
Alcohol expectancies
Forty-four items measured positive expectations of alcohol's effects. Responses ranged from 0 (not at all) to 4 (a lot). Based on previous confirmatory and exploratory factor analyses (Kushner, Sher, Wood, & Wood, 1994), four subscales were formed using unit-weighted scoring: tension reduction (9 items, α = .89; e.g., “Drinking makes me feel less tense or nervous”), social lubrication (8 items, α = .88; e.g., “Drinking makes me feel less shy”), activity enhancement (9 items, α = .85; e.g., “Drinking makes many activities more enjoyable”), and performance enhancement (9 items, α = .81; e.g., “Drinking helps me have better ideas”).
Drinking restraint.
Reasons for not drinking
Eleven reasons for limiting one's drinking were developed by project staff in consultation with J. E. Donovan, including religious beliefs, peer group influence, alcohol's negative consequences, and loss of control worries (α = .79). Responses ranged from 0 (strongly agree) to 4 (strongly disagree), and items were reverse scored for analysis.
Drinking restraint strategies
Seven items assessed frequency of restrained drinking and use of strategies to limit drinking, including limiting drinking to certain occasions and limiting the number of drinks (α = .83). Responses ranged from 0 (never) to 4 (always).
Comorbid substance use disorders.
Tobacco dependence
Individuals were coded as having tobacco dependence if they met DSM-III criteria (on the DIS).
Drug abuse/dependence
Drug abuse/dependence was coded if participants met past-year DSM-III criteria (on the DIS) for abuse and/or dependence on cannabis, barbiturates, opioids, amphetamines, cocaine, or hallucinogens.
Other comorbid psychopathology.
Anxiety disorders
Individuals were coded as having an anxiety disorder if they met past-year DSM-III diagnostic criteria4
Several comments need to be made regarding the scoring of the anxiety disorders. For generalized anxiety disorder, although DSM-III diagnostic criteria require “worry for at least one month,” the DSM-III-R requirement is 6 months. Therefore, some participants diagnosed with generalized anxiety disorder in this study would not have been diagnosed if DSM-III-R criteria had been used. Because agoraphobia without panic attacks is a controversial diagnosis, we excluded from the agoraphobia group those individuals who did not report panic attacks. Finally, for panic attacks (without agoraphobia), whereas DSM-III-R requires four panic attacks in a 4-week period or one panic attack and at least 1 month of worry about panic, DSM-III requires three panic attacks in a 3-week period. To identify nonagoraphobic individuals who have experienced repeated panic attacks over the course of their lives, we grouped those reporting either more than five panic attacks over their lifetime or at least three panic attacks in any 1-month period in the absence of agoraphobic avoidance.
Major depression
Individuals were coded as having major depression if they met past-year DSM-III diagnostic criteria (on the DIS) for major depression.
Psychological distress
The Brief Symptom Inventory (BSI; Derogatis, 1993), a short form of the Symptom Checklist 90-R (Derogatis & Cleary, 1977), assesses how much one has been bothered or distressed in the past week by 53 psychological/physiological symptoms (e.g., faintness, feeling inferior to others). Responses ranged from 0 (not at all) to 4 (extremely). The current study used the General Severity Index (BSI-GSI), calculated by dividing the sum of the response values by the total number of responses (α = .95). Derogatis (1993) reported a 2-week test–retest reliability coefficient of .90 for the BSI-GSI.
Antisociality
A dichotomous variable was created from a DIS item asking participants who endorsed at least three antisocial personality items whether they had committed any of those acts in the past year. It was coded 1 if individuals responded yes and 0 if they either had not committed any of those behaviors in the past year or had endorsed fewer than three symptoms at baseline.5
The DIS questions regarding antisocial personality symptoms were worded and scored to create an aggregate of the number of symptoms over time, and a yearly count could not be discerned. Therefore, as a proxy for past-year symptoms, we used a question that asked all respondents who had endorsed at least three lifetime symptoms whether they had occurred in the past year.
Personality
Although our baseline assessment contained extensive assessment of personality traits, only a few were assessed over time and lend themselves to the type of analyses undertaken.
Self-Consciousness Scale
This 23-item scale (Fenigstein, Scheier, & Buss, 1975) measures private self-consciousness (10 items, α = .71), public self-consciousness (7 items, α = .81), and social anxiety (6 items, α = .74).
Pearlin Mastery Scale (PMS)
This 7-item scale (Pearlin & Radabaugh, 1976) is a measure of generalized coping (α = .75). The scale's authors found moderate correlations among social distress (such as economic hardship), anxiety, and drinking for the relief of distress, particularly for people who have little sense of mastery and low self-esteem.
Rosenberg Self-Esteem (RSE)
The 10-item RSE (Rosenberg, 1979) assesses attitudes such as being satisfied with oneself and feeling useless or that one is a failure (α = .89).
MacAndrew Alcoholism Scale (MAC)
This 49-item scale (α = .41; MacAndrew, 1965) assesses alcoholism tendencies in an indirect manner and in archival studies has been found to predict the later occurrence of alcoholism (Hoffman, Loper, & Kammeier, 1974).
Social/environmental variables.
Peer involvement
A sum of 6 items adapted from Jessor and Jessor (1973, 1981) assessed levels of peer involvement with alcohol and peer support for drinking (α = .89). Examples are friend's approval of drinking and getting drunk (0 = strongly disapprove to 4 = strongly approve), and how much friends drink (0 = they don't drink to 4 = more than six drinks).
Religious involvement
Four items assessed religious involvement: frequency of church attendance (0 = three or more times a week to 7 = never, reverse scored), importance of religion (0 = extremely important to 4 = unimportant, reverse scored), considering self to be religious (0 = yes, definitely to 2 = no, reverse scored), and abstaining from behaviors (e.g., alcohol use) for religious reasons (0 = yes and 1 = no, reverse scored). (The items were examined separately.)
Recent life events
The past-year occurrence of life events was assessed via a 47-item, modified version of the Life Events Survey (Sarason, Johnson, & Siegel, 1978). Several items not likely to occur in a college student sample were deleted, and age-relevant items were added. Five a priori subscales (sum of items endorsed) were used: interpersonal (21 items, α = .68), work/school (12 items, α = .55), health (2 items, α = .12), financial (2 items, α = .35), and legal (2 items, α = .09).
Procedure
Participants were contacted early in their first year of college and asked to participate in a research project assessing health behaviors during the college years. Throughout the follow-up period, attempts were made to retain and track all participants, regardless of whether they remained at the university. Participants completed the DIS and a questionnaire battery at each year of the study. Although at Years 2–7 attempts were made to have all participants complete the assessment in the laboratory, some participants completed phone interviews and mail-in questionnaires (e.g., 27% at Year 7). In a number of analyses comparing the covariance structures of participants who completed assessments in the laboratory with those who completed assessments by phone and mail, we failed to find any differences suggesting effects of method variation.
Results
Attrition analyses
Individuals who left the study by Year 7 were considered attriters (n = 32), including 1 who died during the follow-up period, 1 who found out that he/she was adopted, 1 who was unable to be located, and 29 who refused participation. A nonsignificant chi square of attrition and AUD at Year 1 (p = .17) suggests that individuals with baseline AUD diagnoses did not differentially drop out of the study after Year 1. To determine whether attrition affected other variables (i.e., individuals with more antisocial personality symptoms might be more likely to drop out), 62 t test (continuous variables) or chi-square (categorical variables) analyses were performed on an attrition variable (attriters = 1, nonattriters = 0, n = 457) and Year 1 study variables. Compared to nonattriters, attriters scored significantly higher on alcohol dependence symptoms (d = .37), alcohol-related consequences (d = .43), reasons for not drinking of “because I sometimes become rude or obnoxious” (d = .39), and “because I'm afraid I might become an alcoholic” (d = .45), and restrained drinking items regarding frequency of cutting back (d = .37) and amount by which one cuts back (d = .38). Attriters scored significantly lower on the PMS (d = .41) and RSE (d = .46). Although attriters versus nonattriters differed on a few variables, the lack of a significant relation between attrition and Year 1 AUD and the overall high retention rate (over 90%) suggest the sample is not overly biased by more alcohol-involved individuals leaving the study.
Characterizing the course of alcohol involvement in nondiagnosers, remitters, and chronics
Table 2 shows the frequencies of AUD course over time, that is chronic, remitting, nondiagnosing, and an “other” group that includes all other patterns, by FH and gender. Because there are no FH+ women who chronically diagnosed with an AUD, the interaction of FH and gender was not modeled. Although not a focus here, results of a categorical maximum likelihood analysis predicting these four courses of AUDs (all other analyses use three groups of AUDs) by main effects of FH and gender, showed significant effects of FH, χ2 (3, N = 451) = 17.45, p < .001, and gender, χ2 (3, N = 451) = 29.53, p < .0001. Generally, FH positive individuals were more likely to be in the Chronic and Remitting groups, and men were more likely to be in the Chronic and “other” groups. Due to these main effects, gender and FH are controlled in all analyses.
Frequencies of course of AUD over time by FH and gender (N = 451)

Validity of a priori designation of course
As described above, our classes were logically derived for the purpose of providing relatively “pure” prototypes that would facilitate meaningful comparisons among courses. However, it can be argued that although “rational,” these courses are arbitrary and may not represent the underlying nature of the phenomenon under investigation. To address this issue, we compared our logically derived classes with empirically derived classes to establish their reasonableness with respect to the overall data structure. We accomplished this using latent class growth analysis (LCGA; Muthén, 2001), a type of latent growth mixture modeling suitable for categorical indicator variables such as dichotomous diagnoses. Using full information, maximum likelihood to exploit all available data, a series of LCGA models using Mplus Version 2.13 (Muthén & Muthén, 2000, 2001) were estimated. The base model included intercept and linear and quadratic slopes and a four-class model demonstrating the best fit for the data using multiple fit indices (see Jackson & Sher, 2004, for more details on this analysis).
The results of this analysis are reported in Figure 4. As can be seen, there is clear evidence for all three of the logical groups with trajectories clearly associated with a chronic class (12%), a remitting class (10%), and a nondiagnosing class (66%). In addition to these three classes, the LCGA revealed a fourth class labeled in Figure 4 as a “later onset” course (13%). Examination of the diagnostic configurations associated with this later onset course reveals that individuals with this course tended to not diagnose at Year 1 but did tend to diagnose at least twice during later follow-up assessments. Cross-tabulation of the 336 subjects who met a priori logical classification, the LCGA and the logical classes showed 100% agreement with respect to both the nondiagnosing and chronic class. With respect to the remitting class, 26 of 33 (79%) of the logically derived remitters were in the LCGA remitting class and 7 of 33 (21%) were in the LCGA chronic class. This is because the LCGA classified patterns of consistent diagnosis through the first 4 years of the study and no diagnosis at Year 7 as chronic. Given the strong concordance between the logically derived classes and the LCGA and our scientific judgment that patterns characterized by late remission were more appropriately considered “in remission” rather than chronic (especially with the restriction of no past-year symptoms and the fact that the years following college are characterized by high rates of maturing out; Sher & Gotham, 1999), we elected to proceed with the a priori groupings. Although the LCGA results provide empirical justification for including a fourth group for comparison purposes, we elected to focus on the three logical groupings for multiple reasons. Foremost among these is that at most measurement occasions (especially Years 3, 4, and 7), approximately half of the members of the later onset group are diagnosing and the other half are not diagnosing, complicating interpretation. Also, in contrast to the three logical courses that provide meaningful comparisons among each other at the beginning and end of the observation period (i.e., remitters and chronics are similar diagnostically at Year 1; remitters and nondiagnosers are similar diagnostically at Year 7), later onset courses provide less clear-cut comparisons.

A latent class growth analysis of trajectories of 12-month DSM-III alcohol use disorders over 7 years; Dx, diagnosers.
Analytic strategy
Throughout the analyses, two contrasts represent our primary interests: Remitters versus Chronics, and Diagnosers (Remitters and Chronics combined) versus Nondiagnosers. To illustrate the validity (e.g., Tucker et al., 2003) of these three courses of AUDs over 7 years, we conducted a doubly multivariate, repeated-measures analysis of variance (ANOVA) with main effects of FH, gender, and AUD course predicting the alcohol involvement variables (heavy drinking occasions, alcohol-related consequences, alcohol dependence symptoms) at all five occasions. (That is, a multivariate approach to repeated measures [e.g., O'Brien & Kaiser, 1985] employing multiple dependent measures using SAS Institute's [1992] PROC GLM [e.g., see example 9; pp. 988–993].) The overall multivariate effects for each contrast were significant (all ps < .0001). Also, the multivariate interactions between time and each contrast were significant: Time × Chronics versus Remitters, Wilk's lambda, F (12, 313) = 2.09, p < .05; Time × Diagnosers versus Nondiagnosers, Wilk's lambda, F (12, 313) = 6.86, p < .0001. Probing these interactions further, for each contrast there were significant interactions with the linear effect for each dependent variable. (There were also interactions between the Diagnosers vs. Nondiagnosers contrast and nonlinear polynomial effects on each dependent variable.) Figure 5 shows, as expected, that alcohol involvement variables are course trackers. Although Chronics began at the highest levels of alcohol involvement and Remitters were next highest, Remitters greatly decreased alcohol involvement to the approximate level of nondiagnosers by Year 7. (At Year 7, simple effect tests failed to find significant differences between Remitters and Nondiagnosers, although the difference approached significance, p = .052, on alcohol-related consequences.)

The levels of three alcohol involvement variables over time by the course of alcohol use disorders: heavy drinking occasions, alcohol-related consequences, and alcohol dependence symptoms.
Dynamic prediction of course of AUDs over time
Our primary goal was to determine whether changes in variables over time were related to course of alcohol involvement in young adulthood. To reduce the chance of Type I error, doubly multivariate repeated-measures ANOVAs were conducted for variables assessed at all five waves, as a function of AUD course, gender, and FH main effects. Measures of comorbid psychopathology (categorical and continuous variables) and peer involvement (composite variable) were examined separately with repeated-measures weighted least-squares analyses (categorical variables) or ANOVAs (continuous variables). As in the previous analyses, multivariate planned contrasts of Chronics versus Remitters and Diagnosers versus Nondiagnosers were conducted. Main effects of gender and FH were modeled as covariates but are not discussed further. For continuous dependent variables, polynomial contrasts assessing linear and nonlinear trends over time were computed (both overall and in interaction with the between-group contrasts of interest). Table 3 presents results of the doubly multivariate analyses for groups of variables with significant multivariate Time × Contrast effects, and Figures 6, 7, 8, 9, 10, and 11 selectively illustrate effects of particular interest (adjusted for FH and gender effects). Note that because we focus on dynamic predictors in these analyses, only effects associated with the interaction between time and our between-group contrasts are noted and reported in Table 3 because the presence of such an interaction is necessary to establish covariation between a potential dynamic predictor and course. Stable group differences (i.e., main effects of group but no Group × Time interaction) are important because they suggest stable vulnerability processes and generalized time trends (i.e., no interaction with between-group contrasts) can indicate important normative developmental changes. However, these types of effects are neither highlighted nor typically discussed because they are largely tangential to the focus of the article.

The levels of three reasons for drinking over time by course of alcohol use disorders: Mood Modification, Celebration, and Sensation Seeking.

The level of Performance Enhancement alcohol expectancies over time by course of alcohol use disorders.

The levels of three restrained drinking items over time by the course of alcohol use disorders: frequency of trying to cut back, frequency of drinking low alcohol beverages, and frequency of pacing drinking.

The level of psychological distress as measured by the BSI-GSI.

The percentage of participants reporting past-year antisocial personality disorder symptoms over time by the course of alcohol use disorders and scores on the MAC scale.

The level of peer involvement in drinking over time by the course of alcohol use disorders.
Results of significant doubly multivariate, repeated measures regression analyses predicting sets of study variables from gender, family history of alcoholism, and course of AUD

Motivations for drinking.
Reasons for drinking
The multivariate effects for each contrast were significant (all ps < .0001). As shown in Table 3, the multivariate interactions between Time and each contrast were significant. Figure 6 depicts the significant interaction between time and the Chronics versus Remitters contrast for Mood Modification, Celebration, and Sensation Seeking motives. These variables appear to be course trackers, because Chronics and Remitters began at the same or nearly the same level but over time the motives of Remitters decreased more rapidly than Nondiagnosers. There was also a significant interaction between Time and the Diagnosers versus Nondiagnosers contrast. Significant Contrast × Time (linear) effects were found for all but the Tension Reduction and Social Conformity motives (although a Contrast × Time [quadratic] effect was found for the latter).
Alcohol expectancies
The multivariate effects for each contrast were significant (all ps < .0001) as were the multivariate Contrast × Time interactions (see Table 3). As seen in Figure 7, the significant interactions between time and each contrast on Performance Enhancement suggests developmentally specific effects. Although at Year 1 (p < .002) and Year 3 (p < .001) Chronics reported much stronger expectancies than Remitters, by Years 4 and 7 the two groups were similar (all ps > .59). Equally important, the mean difference between Diagnosers and Nondiagnosers at Years 4 and 7 was much smaller than at baseline (although they remained significant, p < .01). There were also significant Time × Diagnosers versus Nondiagnosers interactions for Tension Reduction and Activity Enhancement expectancies (see Table 3). Inspection of the means indicated that both scales appear to be course trackers as chronic diagnosers maintained relatively high levels of expectancies, whereas those who went on to remit showed initially high levels that decreased over time close to the levels of Nondiagnosers.
Drinking restraint.
Reasons for not drinking
Although the multivariate effect for the chronics versus remitters contrast was marginally significant (p = .05) and was significant (p < .0001) for the Diagnosers versus Nondiagnosers contrast, neither multivariate Time × Chronics versus Remitters interaction nor Time × Diagnosers versus Nondiagnosers interaction was significant (p = .73 and .75, respectively).
Restrained drinking
Only the multivariate effect for the Diagnosers versus Nondiagnosers contrast was significant (p < .0001; Chronics versus Remitters, p = .11). The multivariate Time × Diagnosers versus Nondiagnosers interaction was marginally significant, and the Time × Chronics versus Remitters interaction was significant (see Table 3). Figure 8 depicts items with significant effects for the Time × Chronics versus Remitters interaction. The top panel shows that both Chronics and Remitters began with the same high frequency of trying to cut back, but over time, the Remitters decreased to almost the level of the Nondiagnosers, and the Chronics remained at the same high level.
Although frequency of trying to cut back fits our definition of a course tracker variable, the drinking restraint strategies of drinking low alcohol beverages and pacing drinking appear to be course-referenced indicators (middle and lower panels of Figure 8). At Year 1, Remitters used drinking restraint strategies of drinking low alcohol beverages and pacing drinking more often than Nondiagnosers (p < .05 and < .001, respectively) but over time they decreased use of those strategies; by Year 7 they were no longer different than Nondiagnosers (all ps > .53). In contrast, at Year 1, Chronics were similar to Nondiagnosers on both frequency of drinking low alcohol beverages and frequency of pacing drinking (all ps > .51) but increased the use of those strategies over time and by Year 7 tended to use them more than Nondiagnosers (p < .06 and .05, respectively).
Comorbid substance use disorders.
Tobacco dependence
The Chronics versus Remitters contrast was not significant (p = .34) and did not interact significantly with time (p = .85). Diagnosers and Nondiagnosers differed in prevalence of tobacco dependence (p < .0001), with approximately three times as many Diagnosers being tobacco dependent (20–28%) than Nondiagnosers (5–9%). However, a follow-up analysis found the Time × Diagnosers versus Nondiagnosers interaction to be nonsignificant (p = .68). This pattern of comorbidity suggests that smoking might be a stable vulnerability marker.6
We have conducted extensive prospective analyses of comorbidity between tobacco dependence and AUDs (Jackson et al., 2000a; Sher, Gotham, et al., 1996) and readers interested in a more probing analysis of this relation are referred to those articles.
Drug abuse/dependence
The overall Chronics versus Remitters contrast was not significant (p = .47) and did not interact significantly with Time (p = .76). Diagnosers and Nondiagnosers differed in the prevalence of drug abuse/dependence (p < .0001), and in an ad hoc analysis there was a marginally significant Time × Diagnosers versus Nondiagnosers interaction, χ2 (4, N = 336) = 8.92, p = .06. At each year, 2% of the Nondiagnosers had a drug use disorder, whereas the prevalence for Diagnosers was 25, 22, 26, 20, and 14% for Years 1, 2, 3, 4, and 7, respectively (adjusted for FH and gender). This marginal interaction appears to reflect the joint influence of age-graded declines in drug use disorders and a floor effect in the Nondiagnosers.
Other comorbid psychopathology.
Anxiety disorders
The overall Chronics versus Remitters contrast was not significant (p = .64) and did not interact significantly with Time (p = .92). Diagnosers and Nondiagnosers differed in the prevalence of anxiety disorders (p < .0001), with Diagnosers generally reporting more anxiety disorders than Nondiagnosers. The Time × Diagnosers and Nondiagnosers interaction was not significant (p = .73). More extensive analysis of AUDs and anxiety disorder comorbidity with this data is reported in Kushner et al. (1999). Findings from that study suggest that a different pattern might emerge if one were to compare anxiety with physical dependence on alcohol as opposed to the broad-band diagnosis of AUD employed in the current analyses.
Major depression
The overall Chronics versus Remitters contrast was not significant (p = .71) and did not interact with Time (p = .94). Diagnosers and Nondiagnosers differed in prevalence of major depression (p < .0001), and there was a significant Time × Diagnosers versus Nondiagnosis interaction, χ2 (4, N = 336) = 9.93, p < .05. At each year, approximately 2% of Nondiagnosers reported major depression, whereas the prevalence for AUD diagnosers was 10, 12, 11, 9, and 3% for Years 1, 2, 3, 4, and 7, respectively (adjusted for FH and gender). The pattern is very similar to that observed for drug use disorders except there are lower base rates for major depression.
Psychological distress
The overall Chronics versus Remitters effect was marginally significant (p = .055). The Time × Chronics versus Remitters interaction was significant, F (4, 1292) = 5.03, p < .01, with significant nonlinear effects (p < .001). Figure 9 shows that compared to Remitters who evidenced a steadier decline, Chronics showed a lag in that their psychological distress dropped sharply between Years 3 and 4. The overall Diagnosers versus Nondiagnosers effect was significant (p < .0001). There was a significant Time × Contrast interaction, F (4, 1292) = 5.03, p < .01, with significant linear (p < .001) and nonlinear (p < .001) effects. The pattern is one of developmentally graded decreases in distress that are relatively dramatic in late adolescence and then asymptote. Against this background are initially higher levels of distress associated with the presence of an AUD, that decrease in a near linear fashion for those who remit and in a delayed but steep decrease in those with chronic problems. The pattern is consistent with the concept of a developmental lag indicator, although the increasing level of distress from Year 4 to 7 among Chronics is suggestive of the beginning of a deterioration process.
Antisociality
The top panel of Figure 10 shows the changing patterns of having at least one past-year adult ASP symptom. The overall effect for Chronics versus Remitters was not significant (p = .24); however, this may be due in part to collinearity between FH and antisociality, as when the covariate of FH was deleted, the Chronics versus Remitters contrast was significant (p = .03). However, even with FH deleted from the analysis, the Time × Chronics versus Remitters interaction was not significant (p = .78). The overall effect for Diagnosers versus Nondiagnosers was significant (p < .0001), with more diagnosers reporting a past-year symptom than Nondiagnosers. The Time × Diagnosers versus Nondiagnosers interaction was not significant (p = .17). Overall, the pattern suggests antisociality as a stable vulnerability indicator.
Personality
For the personality variables (Self-Consciousness scale, PMS, RSE, and MAC), both multivariate contrasts were significant (all ps < .05). However, perhaps due to their presumed trait-like nature, neither of the multivariate Time × Contrast interactions was significant (p = .12 for Chronics versus Remitters, p = .95 for Diagnosers vs. Nondiagnosers) suggesting that some of these variables can be viewed as stable vulnerability indicators.7
In previous work from this project, Walitzer and Sher (1996) found a significant relation between the RSE and AUDs, including a significant effect for pattern of AUD diagnosis. Women who were either early or early-and-late AUD diagnosers had significantly lower self-esteem than men in the same diagnosis groups. This highlights that some personality variables may show variability, and that overgeneralizations should not be made regarding the current findings.
Social/environmental variables.
Peer involvement
The multivariate effect for Chronics and Remitters was significant (p < .05), with a significant Time × Contrast interaction, F (4, 1296) = 3.53, p < .05, and a significant linear effect, F (1, 324) = 8.51, p < .01. Figure 11 shows that this variable is a course tracker as both Chronics and Remitters began with much higher levels of peer involvement in drinking, but over time Remitters' peer involvement decreased almost to the level of Nondiagnosers, whereas Chronics' peer involvement appears to have remained the same. The multivariate effect for Diagnosers versus Nondiagnosers was significant (p < .0001), with a significant Time × Contrast interaction, F (4, 1296) = 3.44, p < .05, and significant linear (p < .01) and nonlinear (p < .05) effects.
Religious involvement
Neither the multivariate effect for Chronics versus Remitters (p = .30), nor the Time × Contrast interaction (p = .67) was significant. The multivariate effect for Diagnosers versus Nondiagnosers was significant (p = .02), as was the Time × Contrast interaction (see Table 3). The item regarding the importance of religion in day-to-day life showed significant nonlinear effects over time, such that while the level of importance of religion remained higher and steady for the Nondiagnosers, for the Diagnosers, it began lower, increased at Year 3, and then decreased at Years 4 and 7.
Recent life events
Neither the multivariate effect for Chronics versus Remitters (p = .90) nor the multivariate Time × Chronics versus Remitters interaction (p = .75) was significant. Both the multivariate effect for Diagnosers versus Nondiagnosers (p < .01) and the multivariate Time × Contrast interaction were significant (see Table 3). There were significant linear (decreasing) effects for legal and health events, with Diagnosers generally experiencing more legal and health events, and a significant nonlinear effect for work events. Whereas Nondiagnosers experienced steadily declining numbers of work events, Diagnosers (who reported more events than Nondiagnosers) experienced an increase in work events from Year 1 to Year 2, and then decreasing numbers of events through Year 7.
Summary
Based on these analyses, several variables can be considered dynamic predictors of whether one remits from previous AUDs or continues to diagnose, including mood modification, celebration, and sensation-seeking reasons for drinking, performance enhancement alcohol expectancies, restrained drinking items, general psychological distress, adult antisociality, and peer involvement. Evidence was found for five of the seven predicted patterns of dynamic predictors. Neither recovery behaviors nor deterioration markers were unambiguously identified in the set of variables examined.
Discussion
As described at the outset, different patterns of mean trajectories of covariates could have different implications for their functional relationship to AUDs. We hypothesized seven patterns of dynamic prediction (stable vulnerability indicators, course trackers, deterioration markers, developmentally specific variables, developmental lag indicators, course-referenced variables, and recovery behaviors) and found evidence for five of them within the current data set. Below we discuss those variables that appear to fit our hypothesized taxonomy of dynamic predictors and the implications of these findings for understanding the relationship between trajectories and time-varying covariates.
Evidence for stable vulnerability indicators
Variables thought to reflect or be closely linked to personality/temperament (e.g., antisocial behavior) were most likely to behave as stable vulnerability markers. Because our analyses focused on variables that were assessed over time, the data reported here are not particularly probing of stable vulnerability indicators as, per study design, we did not assess these at each wave. For example, baseline personality variables reflective of behavioral undercontrol (e.g., Novelty Seeking from the Tridimensional Personality Questionnaire [TPQ]; Cloninger, 1987; Psychoticism from the Eysenck Personality Questionnaire [EPQ], Eysenck & Eysenck, 1975) and negative affectivity (e.g., Harm Avoidance on TPQ, Neuroticism on EPQ) that appear fairly stable in our larger dataset (Sher, Bartholow, & Wood, 2000) were not available over time in the current study. However, measures of behavioral undercontrol that we did assess regularly (e.g., past-year antisociality, MacAndrew scale) were consistent with the concept of stable vulnerability indicators. Considerable evidence suggests that temperamental characteristics are associated with risk of alcohol problems and dependence (Sher, Trull, Bartholow, & Vieth, 1999) and, in fact, might partially mediate genetic risk (Slutske, Heath, Dinwiddie, Madden, Bucholz, Dunne, Statham, & Martin, 1998; Slutske, Heath, Madden, Bucholz, Statham, & Martin, 2002). However, it is possible that severe alcohol dependence can affect the measurement of personality (Barnes, 1983; Sher et al., 1999). Aside from the effects of alcohol dependence on personality, “stability” is relative as there appear to be normative decreases in negative affectivity and behavioral control from adolescence until adulthood (Costa & McCrae, 1994, 1997; McGue, Bacon, & Lykken, 1993), only moderate (rank order) stability of personality in adolescence and young adulthood (Roberts & DelVecchio, 2000), and social roles can moderate personality stability (Caspi & Roberts, 1999). Thus, although we believe that personality traits can function as stable vulnerability indicators, it is possible that personality traits can also be dynamically related to course. Moreover, these may be indicators of high risk for development of AUDs, but may not be easily modifiable.
Evidence for course trackers
Closely tracking course, measures of alcohol involvement showed a monotonic relation with the nondiagnosing–remitting–chronically diagnosing gradient at baseline, indicating, not surprisingly, that initial severity is related to chronicity. For several variables, however, both Chronics and Remitters began at similarly high levels, and then remitters showed greater decreases over time. This pattern was exemplified by Mood Modification, Celebration, and Sensation Seeking reasons for drinking, the restraint strategy of trying to cut back on drinking, and peer alcohol involvement. Given that individuals who do not remit from their AUDs fail to decline in these variables in comparison to those who do remit, these markers of problematic AUDs might be useful in monitoring treatment progress, or course, more generally.
More fine-grained analyses (e.g., cross-lagged autoregressive models) could help distinguish whether course trackers are leading indicators (and potentially causal) or trailing indicators (and consequential). With respect to drinking motives (Sher & Wood, 1997) and alcohol expectancies (Sher, Wood, Wood, & Raskin, 1996) reciprocal influences have been shown, demonstrating that both directional influences can be present. The considerably large literature on peer influence also suggests reciprocal processes (i.e., individuals are influenced by their peers' drinking but also select peers based, in part, on their drinking). For example, Curran et al. (1997) reported bidirectional effects for target individual and peer alcohol use from adolescence into early young adulthood. This suggests that targeting such variables in either prevention or treatment programs might alter the course of AUDs in some young adults.
Evidence for developmentally specific variables
For some variables, we found noticeably stronger prediction of the chronic course of AUDs at earlier but not later time points. Specifically, Performance Enhancement alcohol expectancies were initially higher in those with AUDs who went on to develop chronic patterns, but these expectancies decreased over time and eventually became roughly similar to Nondiagnosers and Remitters during their early 20s. The early severe deviation of Chronics that then tends to normalize suggests that some markers are developmentally limited risk factors that only have prognostic significance at certain ages (Rutter, 1996). Previous research noted that although performance enhancement expectancies increase and then decrease during adolescence for most young people, these expectancies did not decrease in problem drinking adolescents (Christiansen, Goldman, & Brown, 1985). In an elaboration of this work, we found that Performance Enhancement expectancies remain elevated in chronically diagnosing young adults only during the early college years, indicating that there are critical developmental parameters of this association. This raises cautions about generalizing findings regarding prognosis across developmental periods and strongly argues for designs and statistical analyses that are attentive to participants' ages and, relatedly, “hidden” cohorts in age-heterogeneous samples.
Evidence for developmental lag markers
There is a marked normative decrease in subjective distress over the college years (Sher, Wood, & Gotham, 1996), but against this normative trend there are individual variations in trajectories. For those characterized by persistent AUDs, the decrease in generalized distress (as assessed by the BSI-GSI) is delayed but ultimately achieved (or at least, approximately achieved, for a period of time). These findings are consistent with the theory suggesting that heavy substance involvement may cause cognitive and/or affective damage and interferes with the development of social and cognitive competencies that are associated with optimal development (Baumrind & Moselle, 1985; Newcomb & Bentler, 1988). Similar to developmentally specific predictors, the association between AUDs and developmental lag indicators is presumed to be dependent upon the ages studied, and important effects could be obscured by studying individuals at the wrong time of life or by studying age-heterogeneous cohorts and failing to resolve age-dependent effects.
Evidence for course-referenced variables
On two variables assessing drinking restraint (frequency of drinking low alcohol beverages, frequency of pacing drinking), Remitters appeared to have initially relatively high levels that decreased over time (by later years, the Remitters' levels on these variables dropped close to the level of Nondiagnosers). However, the same variables showed the opposite pattern, that is, an increase over time, in individuals with a chronic course. This contrasting pattern suggests that the “meaning” of an observed variable can change over the course of alcohol abuse/dependence and observed patterns of association between a manifest disorder and a covariate can be conditional upon the stage of one's “drinking career.”
More specifically, for those with a remitting course, use of drinking restraints might represent a successful moderation strategy that results in an amelioration of alcohol-related problems, and the decline in use of the strategy over time signifies recovery. However, the later increased use of these strategies by individuals with chronic courses of AUDs suggests that they develop a more persistent problem before trying a strategy that, at least throughout the years studied, does not appear to produce success. This pattern also suggests that those who go on to remit from an early-onset AUD have an early notion that they are having difficulties with alcohol involvement. One potential implication of these findings is that self-change strategies that are effective for individuals with “early stage” alcohol abuse or dependence (see Sanchez–Craig, 1984) might be ineffective (or potentially even harmful in those whose dependence has progressed) and thus course might be a relevant “matching variable” for evaluating the effectiveness of differing treatment approaches (Project Match Research Group, 1997).
Deterioration markers
We were not able to identify any variables that that showed progressive deterioration as a function of a chronic course, although there was some indication that psychological distress might be starting to show such a trend towards the end of our observation period. The absence of a deterioration effect is almost certainly due to the types of variables we assessed, the severity of disorder manifested in our nonclinical sample, and possibly the relative youth of our sample; there is little doubt that deterioration can and frequently does occur. For example, given existing epidemiological data, it seems a certainty that we would ultimately observe increased tissue deterioration (e.g., impaired liver function) had we tracked this variable in a sufficiently large, chronic group of alcohol-dependent individuals for an extended period of time. Furthermore, when deterioration occurs, it is likely that later remission can be associated with permanent disability (e.g., Korsakoff's psychosis) or improvement (e.g., most alcohol-related neuropsychological impairment) with simple passage of time, continued use of affected abilities, or drug therapy (Goldman, 1987; Rainer, Mucke, Chwatal, & Havelec, 1996). Thus, there is considerable value in studying individuals who show deterioration patterns to determine what types of deterioration are likely to be relatively permanent (e.g., “scarring”) versus short lived.
Recovery behaviors
Our study found no evidence for (course-independent) recovery behaviors. (Recall that certain drinking restraint strategies appear to be course-referenced markers of an early recovery process.) This is not surprising in that the study was not designed to track these types of variables, although many variables (e.g., AA attendance, drinking self-efficacy) might be expected to increase during the initial stages of recovery and to continue to increase or be maintained for some period of time. Identification of recovery behaviors represents a potentially promising research strategy for identifying those variables associated with natural recovery processes (Russell, Peirce, Chan, Wieczorek, Moscato, & Nochajski, 2001; Sobell, Cunningham, Sobell, & Toneatto, 1993; Watson & Sher, 1998). As discussed elsewhere, understanding natural recovery not only provides us with a better understanding of the course of AUDs in the general population but also has the potential to form the basis of new intervention strategies.
Beyond the current taxonomy
We deliberately limited our taxonomy of dynamic predictors to those that we hypothesized would be observable in our data set. Because our cohort was ascertained when participants were well into their period of risk for AUDs, we did not extend our analysis to possible patterns of dynamic prediction that involve premorbid covariates that are leading indicators of onset risk. In addition to stable vulnerability indicators that, by definition, are present premorbidly, we can envision at least two types of premorbid dynamic prediction. The first involves various environmental or biological influences that accrue during development and promote the development of disorder. These predictors would be dynamic in the sense they are changing and relate to the onset (and possibly later course) of disorder. For example, continued exposures to environmental toxins (e.g., lead), psychosocial stressors (e.g., poverty), or “bad models” for behavior (e.g., deviant peers) could presage the onset of disorder and provide targets for preventive intervention even prior to symptoms. The second involves subclinical manifestations of disorder itself. Such a pattern of “subclinical emergence” might be especially important for some disorders, not just because it heralds the onset of later, frank disorder, but because it could represent an opportune time for intervention. That is, risk is already tangibly manifest (and thus false positive are less likely to be a problem than they would for latent risk as exemplified by stable vulnerability indicators) but disorder has not yet appeared. For example, early intervention with adolescents and young adults who are exhibiting risky drinking patterns but are not yet alcohol dependent appears to represent a promising intervention strategy for altering trajectories of pathological drinking (Baer, Kivlahan, Blume, McKnight, & Marlatt, 2001). Similarly, in recent years, schizophrenia researchers have devoted more attention to early intervention during the “prodromal” period in efforts to prevent the emergence of frank psychosis and more severe disability (see Cornblatt, Heinssen, Cannon, & Lencz, 2003). Such proximal indicators of risk may guide us more in conceptualizing the timing of intervention more than more distal indicators such as stable vulnerability indicators. As multivariate, prospective research on etiology and course of disorder continues to progress, refinement of the type of taxonomy discussed in this article is almost certain.
Limitations
Several notes regarding the sample need to be made. The collegiate nature of the sample presumably reflects a relatively high functioning group of young adults. However, results from the Monitoring the Future study suggest that although alcohol use in college students compared to their nonstudent peers is quite similar, college students' drinking patterns are actually more likely to be characterized by bingeing (Johnston et al., 2000). In addition, many of our participants dropped out or stopped out of college over the course of the study, so that although all were college freshman at Year 1, they did not continue to be an exclusively college student sample. In addition, because we oversampled those with a FH of alcoholism, there is a relatively high proportion of affected individuals in the sample. Our sample is almost exclusively White (94%). Thus, generalizations to other groups of young adults should be made cautiously; African American, Hispanic, and Asian American groups have different prevalences and age distributions of alcohol involvement and AUDs (e.g., Herd, 1988; Higuchi, Parrish, Dufour, Towle, & Harford, 1994; Wechsler, Dowdall, Davenport, & Castillo, 1995), and predictors of onset and recovery may also differ among groups.
Perhaps the most critical limitations concern the joint effects of a relatively “late beginning” and “early end” of our observation period coupled with a relatively small sample. Consequently, we were not able to assess dynamic predictors premorbidly in those who diagnose early and we were not able to identify a sufficiently large group of subjects with a late onset of AUD to track how dynamic predictors might vary as a function of age of symptom onset. A related limitation stems from studying a single cohort and, consequently, difficulty in disentangling developmentally specific and course-referenced predictors. Greater confidence for this distinction could be achieved by replicating course-specific predictors in different age cohorts.
As noted earlier, the data analytic approach we used for examining dynamic predictors does not resolve direction of effect. Previous analyses from this project have found evidence for reciprocal effects over time for alcohol expectancies (Sher, Wood, Wood, & Raskin, 1996), reasons for drinking (Raskin, Sher, & Wood, 1993), tobacco dependence (Jackson, Sher, & Wood, 2000a; Sher, Gotham, Erickson, & Wood, 1996), and anxiety disorders (Kushner et al., 1999), but some variables might be exclusively predictive or exclusively consequential. Also, more sophisticated analyses are possible. For example, rather than focusing on a few, clinically relevant, prototypic courses (and thus excluding those with a nonprototypic course), we could have attempted to categorize all courses using latent class growth analysis, a multivariate technique that can be used to identify latent classes of trajectories of diagnosis (Jackson et al., 2000a). These latent trajectories (of diagnosis) could then be related to latent growth curves for each dynamic predictor considered. This approach has its appeal and, indeed, we have embarked upon a series of analyses to extend the conceptual approach described here to a complete multivariate framework both in this and in other data sets. Although there is a methodological rationale for employing more sophisticated approaches, we find it less desirable for the type of initial theory building we are attempting here.
The absence of role transition variables also deserves mention. Role transitions such as becoming married or gaining full-time employment are important influences on the course of AUDs during young adulthood, and we have examined those influences in other work (e.g., Gotham, Sher, & Wood, 1997, 2003; Wood, Sher, & McGowan, 2000). However, in this study the majority of the sample was single and not in the workforce until between Years 4 and 7, and during this time period relatively few participants transitioned in and out of different roles, limiting variability of these factors. With data from future follow-ups we may be able to delineate dynamic changes in role transitions.
Implications
We believe the major implications of the present study are conceptual; beyond the increasingly recognized fact that there is considerable variability in course of disorder (i.e., trajectories; e.g., Schulenberg, O'Malley, et al., 1996) there is even greater variability in the trajectories of the covariates (i.e., dynamic predictors). More important, this variability offers clues to the functional relation of the covariate to the underlying disorder and to the developmental boundary conditions under which it serves to operate. From our perspective, the identification of the types of patterns considered here represents a critical first step towards understanding the etiological or consequential role of a diagnosis-related variable. Thus, consistent with earlier work (Sher et al., 1999), variables related to behavioral undercontrol and impulsivity, if measured early (e.g., high school, early college), may be markers of high risk for both the occurrence of an AUD and a potential chronic course of AUDs over time. However, some risk factors, such as alcohol expectancies related to performance enhancement, may only be markers of high risk when measured early in the drinking career of young adults. Other variables may be associated with better prognoses when measured early in the course of disorder but poorer prognosis when measured later. Finally, the extent of negative consequences of a disorder can vary as a function of normative developmental trajectories. The clear message from these findings is that AUDs are clearly embedded within a strong developmental context.
Beyond the primary conceptual and methodological contribution, there are several more applied implications. For example, preventive interventions, which are becoming prevalent at colleges and universities (e.g., Baer et al., 2001; Ziemelis, Bucknam, & Elfessi, 2002), could target factors identified as influential to the recovery process. The current study lends support to prevention and early intervention programs aimed at changing young adult's motivations for using alcohol and expectancies regarding alcohol's effects (Darkes & Goldman, 1993, 1998).
Another implication is that the effectiveness of formal treatments and self-change strategies (Sobell & Sobell, 1998; Vaillant, 1995) could be improved by an understanding of factors that promote or inhibit resolution of an alcohol problem. Although the direction of effects of the dynamic predictors and course of AUDs cannot be discerned from the current analyses, this study provides evidence for the utility of several variables to be monitored during treatment (e.g., reasons for drinking, restraint strategies, psychological distress, peer involvement). It may also be that attempts to change these variables, such as the emphasis in some treatment programs on “changing playmates and playgrounds” or on addressing comorbid smoking and other substance use or other disorders such as depression, should be specific targets of treatment.
We cannot emphasize enough, however, that we see our approach as only a first step toward more elaboration and pruning of taxonomies of dynamic predictors. Future efforts will most certainly be informed by others studying different problems and different stages of the life course. It is our hope that attention to the concept of trajectories of dynamic predictors will provide another methodological tool for uncovering important relations between disorders and their correlates.
References
REFERENCES
Achenbach, T. M.
(1990).
Conceptualization of developmental psychopathology. In
M. Lewis &
S. M. Miller (Eds.),
Handbook of developmental psychopathology (pp.
3–14).
New York:
Plenum Press.
American Psychiatric Association.
(1980).
Diagnostic and statistical manual of mental disorders
(3rd ed.).
Washington, DC:
Author.
American Psychiatric Association.
(1987).
Diagnostic and statistical manual of mental disorders
(3rd ed., revised).
Washington, DC:
Author.
American Psychiatric Association.
(1994).
Diagnostic and statistical manual of mental disorders
(4th ed.).
Washington, DC:
Author.
Baer, J. S.,
Kivlahan, D. R.,
Blume, A. W.,
McKnight, P., &
Marlatt, G. A.
(2001).
Brief intervention for heavy-drinking college students: 4-year
follow-up and natural history.
American Journal of Public Health
91,
1310–1316.Google Scholar
Barnes, G. E.
(1983).
Clinical and personality characteristics. In
B. Kissin &
H. Begleiter (Eds.),
The pathogenesis of alcoholism: Psychosocial factors
(Vol. 6, pp.
113–196).
New York:
Plenum Press.
Bates, M. E.
(2000).
Integrating person-centered and variable-centered approaches in the
study of developmental courses and transitions in alcohol use:
Introduction to the special section.
Alcoholism: Clinical & Experimental Research
24,
878–881.Google Scholar
Bates, M. E., &
Labouvie, E. W.
(1995).
Personality-environment constellations and alcohol use: A
process-oriented study of intraindividual change during
adolescence.
Psychology of Addictive Behaviors
9,
23–35.Google Scholar
Bates, M. E., &
Labouvie, E. W.
(1997).
Adolescent risk factors and the prediction of persistent alcohol
and drug use into adulthood.
Alcoholism: Clinical & Experimental Research
21,
944–950.Google Scholar
Baumrind, D., &
Moselle, K. A.
(1985).
A developmental perspective on adolescent drug abuse.
Advances in Alcohol and Substance Abuse
4,
41–67.Google Scholar
Block, J.
(1971).
Lives through time.
Berkeley, CA:
Bancroft Books.
Bongers, I. L.,
Koot, H. M.,
van der Ende, J., &
Verhulst, F. C.
(2003).
The normative development of child and adolescent problem behavior.
Journal of Abnormal Psychology
112,
179–192.Google Scholar
Cahalan, D.,
Cisin, I. H., &
Crossley, H. M.
(1969).
American drinking practices: A national study of drinking behavior
and attitudes
(Monograph 6).
New Brunswick, NJ:
Rutgers Center of Alcohol Studies.
Caspi, A., &
Roberts, B. W.
(1999).
Personality continuity and change across the life course. In
L. A. Pervin &
O. P. John (Eds.)
Handbook of personality: Theory and research
(2nd ed., pp.
300–326).
Chen, K., &
Kandel, D. B.
(1995).
The natural history of drug use from adolescence to the
mid-thirties in a general population study.
American Journal of Public Health
85,
41–47.Google Scholar
Christiansen, B. A.,
Goldman, M. S., &
Brown, S. A.
(1985).
The differential development of adolescent alcohol expectancies may
predict adult alcoholism.
Addictive Behaviors
10,
299–306.Google Scholar
Cloninger, C. R.
(1987).
Tridimensional Personality Questionnaire, Version 4.
Unpublished manuscript.
Connors, G. J.,
Collins, R. L.,
Dermen, K. H., &
Koutsky, J. R.
(1998).
Substance use restraint: An extension of the construct to a
clinical population.
Cognitive Therapy & Research
22,
75–87.Google Scholar
Cornblatt, B. A.,
Heinssen, R. K.,
Cannon, T. D., &
Lencz, T. (Eds.).
(2003).
Issue theme: Conceptual and methodological advances in prodromal
research.
Schizophrenia Bulletin
29.Google Scholar
Costa, P. T., Jr., &
McCrae, R. R.
(1986).
Personality stability and its implications for clinical psychology.
Clinical Psychology Review
6,
407–423.Google Scholar
Costa, P. T., Jr., &
McCrae, R. R.
(1994).
Stability and change in personality from adolescence through young
adulthood. In
C. F. Halverson, Jr.,
G. A. Kohnstamm, &
R. P. Martin (Eds.),
The developing structure of temperament and personality from
infancy to adulthood (pp.
139–150).
Hillsdale, NJ:
Erlbaum.
Costa, P. T., Jr., &
McCrae, R. R.
(1997).
Longitudinal stability of adult personality. In
R. Hogan,
J. A. Johnson, &
S. R. Briggs (Eds.),
Handbook of personality psychology (pp.
269–290).
New York:
Academic Press.
Crews, T., &
Sher, K. J.
(1992).
Using adapted short MASTs for assessing parental alcoholism:
Reliability and validity.
Alcoholism: Clinical & Experimental Research
16,
576–584.Google Scholar
Curran, P. J.,
Muthén, B. O., &
Harford, T. C.
(1998).
The influence of changes in marital status on developmental
trajectories of alcohol use in young adults.
Journal of Studies on Alcohol
59,
647–658.Google Scholar
Curran, P. J.,
Stice, E., &
Chassin, L.
(1997).
The relation between adolescent alcohol use and peer alcohol use: A
longitudinal random coefficients model.
Journal of Consulting and Clinical Psychology
65,
130–140.Google Scholar
Darkes, J., &
Goldman, M. S.
(1993).
Expectancy challenge and drinking reduction: Experimental evidence
for a mediational process.
Journal of Consulting and Clinical Psychology
61,
344–353.Google Scholar
Darkes, J., &
Goldman, M. S.
(1998).
Expectancy challenge and drinking reduction: Process and structure
in the alcohol expectancy network.
Experimental and Clinical Psychopharmacology
6,
64–76.Google Scholar
Derogatis, L. R.
(1993).
Brief Symptom Inventory (BSI): Administration, scoring and
procedures manual
(3rd ed.).
Minneapolis, MN:
National Computer Systems, Inc.
Derogatis, L. R., &
Cleary, P. A.
(1977).
Confirmation of the dimensional structure of the SCL-90-R: A study
in construct validation.
Journal of Clinical Psychology
33,
981–989.Google Scholar
Endicott, J.,
Andreason, N., &
Spitzer, R. L.
(1978).
Family History-Research Diagnostic Criteria (FH-RDC).
New York:
New York State Psychiatric Institute.
Estes, W. K.
(1956).
The problem of inference from curves based on group data.
Psychological Bulletin
53,
134–140.Google Scholar
Eysenck, H. J., &
Eysenck, S. B. G.
(1975).
Manual of the Eysenck Personality Questionnaire.
San Diego, CA:
Educational and Industrial Testing Services.
Fenigstein, A.,
Scheier, M. F., &
Buss, A. H.,
(1975).
Public and private self-consciousness: Assessment and theory.
Journal of Consulting and Clinical Psychology
43,
522–527.Google Scholar
Galambos, N. L.,
Barker, E. T., &
Almeida, D. M.
(2003).
Parents do matter: Trajectories of change in externalizing and
internalizing problems in early adolescence.
Child Development
74,
578–594.Google Scholar
Goldman, M. S.
(1987).
The role of time and practice in recovery of function in
alcoholics. In
O. A. Parsons,
N. Butters, &
P. E. Nathan (Eds.),
Neuropsychology of alcoholism: Implications for diagnosis and
treatment (pp.
291–321).
New York:
Guilford Press.
Gotham, H. J.,
Sher, K. J., &
Wood, P. K.
(1997).
Predicting stability and change in frequency of intoxication from
the college years to beyond: Individual difference and role transition
variables.
Journal of Abnormal Psychology
106,
619–629.Google Scholar
Gotham, H. J.,
Sher, K. J., &
Wood, P. K.
(2003).
Alcohol involvement and developmental task completion during young
adulthood.
Journal of Studies on Alcohol
64,
32–42.Google Scholar
Grant, B. F.,
Harford, T. C.,
Dawson, D. A.,
Chou, P.,
Dufour, M., &
Pickering, R.
(1994).
Prevalence of DSM-IV alcohol abuse and dependence.
Alcohol Health and Research World
18,
243–248.Google Scholar
Guydish, J., &
Greenfield, T. K.
(1990).
Alcohol-related cognitions: Do they predict treatment outcome?
Addictive Behaviors
15,
423–430.Google Scholar
Herd, D.
(1988).
Drinking by Black and White women: Results from a national survey.
Social Problems
35,
493–505.Google Scholar
Higuchi, S.,
Parrish, K. M.,
Dufour, M. C.,
Towle, L. H., &
Harford, T. C.
(1994).
Relationship between age and drinking patterns and drinking
problems among Japanese, Japanese-Americans, and Caucasians.
Alcoholism: Clinical & Experimental Research
18,
305–310.Google Scholar
Hoffman, H.,
Loper, R., &
Kammeier, M. L.
(1974).
Identifying future alcoholics with MMPI alcoholism scales.
Quarterly Journal of Studies on Alcohol
35,
490–498.Google Scholar
Horn, J. L.
(2000).
Comments on integrating person-centered and variable-centered
research on problems associated with the use of alcohol.
Alcoholism: Clinical & Experimental Research
24,
924–930.Google Scholar
Jackson, K. M., &
Sher, K. J.
(2004).
Similarities and differences of longitudinal phenotypes across
alternate measures of alcohol involvement.
Unpublished manuscript.
Jackson, K. M.,
Sher, K. J.,
Cooper, M. L., &
Wood, P. K.
(2002).
Adolescent alcohol and tobacco use: Onset, persistence and
trajectories of use across two samples.
Addiction
97,
517–531.Google Scholar
Jackson, K. M.,
Sher, K. J., &
Wood, P. K.
(2000a).
Prospective analyses of comorbidity: Tobacco and alcohol use
disorders.
Journal of Abnormal Psychology
109,
679–694.Google Scholar
Jackson, K. M.,
Sher, K. J., &
Wood, P. K.
(2000b).
Trajectories of conjoint substance use disorders: A developmental,
typological approach to comorbidity.
Alcoholism: Clinical & Experimental Research
24,
902–913.Google Scholar
Jessor, R., &
Jessor, S. L.
(1973).
SPBV-4: College study.
Denver, CO:
University of Colorado, Institute of Behavioral Sciences.
Jessor, R., &
Jessor, S. L.
(1981).
Young adult follow-up study.
Denver, CO:
University of Colorado, Institute of Behavioral Sciences.
Johnston, L. D.,
O'Malley, P. M., &
Bachman, J. G.
(2000).
Monitoring the Future national survey results on drug use,
1975–1999: Vol. II. College students and young adults
(NIH Publication No. 00-4803).
Rockville, MD:
National Institute on Drug Abuse.
Jones, B. L.,
Nagin, D. S., &
Roeder, K.
(2001).
A SAS procedure based on mixture models for estimating
developmental trajectories.
Sociological Methods & Research
29,
374–393.Google Scholar
Kraepelin, E.
(1899).
Psychiatrie (6. Aufl.).
Leipzig:
Barth.
Kushner, M. G.,
Sher, K. J., &
Erickson, D. J.
(1999).
Prospective analyses of the relation between DSM-III
anxiety disorders and alcohol use disorders.
American Journal of Psychiatry
156,
723–732.Google Scholar
Kushner, M. G.,
Sher, K. J.,
Wood, M. D., &
Wood, P. K.
(1994).
Anxiety and drinking behavior: Moderating effects of
tension-reduction expectancies.
Alcoholism: Clinical & Experimental Research
18,
852–860.Google Scholar
MacAndrew, C.
(1965).
The differentiation of male alcoholic out-patients from non-alcoholic
psychiatric patients by means of the MMPI.
Quarterly Journal of Studies on Alcohol,
26,
238, 246.Google Scholar
McGue, M.,
Bacon, S., &
Lykken, D. T.
(1993).
Personality stability and change in early adulthood: A behavioral
genetic analysis.
Developmental Psychology
29,
98–109.Google Scholar
Moffitt, T. E.
(1993).
Adolescence-limited and life-course-persistent antisocial behavior:
A developmental taxonomy.
Psychological Review
100,
674–701.Google Scholar
Mullahy, J., &
Sindelar, J.
(1992).
Effects of alcohol on labor market success: Income, earnings, labor
supply, and occupation.
Alcohol Health and Research World
16,
134–139.Google Scholar
Muthén, B.
(2001).
Latent variable mixture modeling. In
G. A. Marcoulides &
R. E. Schumacker (Eds.),
New developments and techniques in structural equation modeling (pp.
1–33).
Hillsdale, NJ:
Erlbaum.
Muthén, B., &
Muthén, L. K.
(2000).
Integrating person-centered and variable-centered analyses: Growth
mixture modeling with latent trajectory classes.
Alcoholism: Clinical & Experimental Research
24,
882–891.Google Scholar
Muthén, L. K., &
Muthén, B. O.
(2001).
Mplus user's guide, Version 2.
Los Angeles:
Muthén & Muthén.
Nagin, D.
(1999).
Analyzing developmental trajectories: A semi-parametric,
group-based approach.
Psychological Methods
4,
139–177.Google Scholar
Nagin, D., &
Tremblay, R. E.
(2001).
Analyzing developmental trajectories of distinct but related
behaviors: A group-based method.
Psychological Methods
6,
18–34.Google Scholar
National Institute on Alcohol Abuse and Alcoholism.
(2000).
Tenth special report to the U.S. Congress on alcohol and health
(NIH Publication No. 00-1583).
Rockville, MD:
Author.
Newcomb, M. D., &
Bentler, P. M.
(1988).
Consequences of adolescent drug use: Impact on the lives of young
adults.
Newbury Park, CA:
Sage.
Nuechterlein, K. H.
(1990).
Methodological considerations in the search for indicators of
vulnerability to severe psychopathology. In
J. W. Rohrbaugh,
R. Parasuraman, &
R. Johnson, Jr. (Eds.),
Event-related brain potentials: Basic issues and applications (pp.
364–373).
New York:
Oxford University Press.
Nuechterlein, K. H., &
Dawson, M. E.
(1984).
A heuristic vulnerability/stress model of schizophrenic
episodes.
Schizophrenia Bulletin
10,
300–312.Google Scholar
O'Brien, R. G., &
Kaiser, M. K.
(1985).
MANOVA method for analyzing repeated measures designs: An extensive
primer.
Psychological Bulletin
97,
316–333.Google Scholar
Pearlin, L. I., &
Radabaugh, C. W.
(1976).
Economic strains and the coping functions of alcohol.
American Journal of Sociology
82,
652–663.Google Scholar
Perreira, K. M., &
Sloan, F. A.
(2001).
Life events and alcohol consumption among mature adults: A
longitudinal analysis.
Journal of Studies on Alcohol
62,
501–508.Google Scholar
Project Match Research Group.
(1997).
Matching alcoholism treatments to client heterogeneity: Project
MATCH Posttreatment drinking- outcomes.
Journal of Studies on Alcohol
58,
7–29.Google Scholar
Rainer, M.,
Mucke, H. A. M.,
Chwatal, K., &
Havelec, L.
(1996).
Alcohol-induced organic cerebral psychosyndromes: Partial reversal
of cognitive impairments assisted by dihydroergocristine.
Psychopharmacology
127,
365–369.Google Scholar
Raskin, G.,
Sher, K. J., &
Wood, P. K.
(1993).
Resolving the direction of causality between reasons for drinking
and alcohol use: A four-wave prospective study.
Poster presented at the Research Society on Alcoholism annual
meeting, San Antonio, TX.
Raskin White, H.,
Bates, M. E., &
Buyske, S.
(2001).
Adolescence-limited versus persistent delinquency: Extending
Moffitt's hypothesis into adulthood.
Journal of Abnormal Psychology
110,
600–609.Google Scholar
Roberts, B. W., &
DelVecchio, W. F.
(2000).
The rank-order consistency of personality traits from childhood to
old age: A quantitative review of longitudinal studies.
Psychological Bulletin
126,
3–25.Google Scholar
Robins, L. N.,
Helzer, J. E.,
Cottler, L., &
Goldring, E.
(1989).
National Institute of Mental Health Diagnostic Interview Schedule,
Version III—Revised.
St. Louis, MO:
Washington University.
Robins, L. N.,
Helzer, J. E.,
Croughan, J.,
Williams, J. B. W., &
Spitzer, R. L.
(1985).
National Institute of Mental Health Diagnostic Interview Schedule,
version III-A. ADDM-T-42-3 (4-85).
Washington, DC:
Institute of Mental Health.
Rosenberg, M.
(1979).
Conceiving the self.
New York:
Basic Books.
Russell, M.,
Peirce, R. S.,
Chan, A. W. K.,
Wieczorek, W. F.,
Moscato, B. S., &
Nochajski, T. H.
(2001).
Natural recovery in a community-based sample of alcoholics: Study
design and descriptive data.
Substance Use & Misuse
36,
1417–1441.Google Scholar
Rutter, M.
(1996).
Developmental psychopathology: Concepts and prospects. In
M. Lenzenweger &
J. Haugaard (Eds.),
Frontiers of developmental psychopathology (pp.
209–237).
New York:
Oxford University Press.
Sanchez–Craig, M.
(1984).
A therapist's manual for secondary prevention of alcohol
problems: Procedures for teaching moderate drinking and
abstinence.
Toronto:
Addiction Research Foundation.
Sarason, I. G.,
Johnson, J. H., &
Siegel, J. M.
(1978).
Assessing the impact of life changes: Development of the Life
Experiences Survey.
Journal of Consulting and Clinical Psychology
46,
932–946.Google Scholar
SAS Institute Inc.
(1992).
SAS Technical Report P-229. SAS/STAT software: Changes and
enhancements, release 6.07.
Cary, NC:
Author.
Scheier, L. M., &
Botvin, G. J.
(1997).
Expectancies as mediators of the effects of social influences and
alcohol knowledge on adolescent alcohol use: A prospective
analysis.
Psychology of Addictive Behaviors
11,
48–64.Google Scholar
Scheier, L. M.,
Botvin, G. J., &
Miller, N. L.
(1999).
Life events, neighborhood stress, psychosocial functioning, and
alcohol use among urban minority youth.
Journal of Child & Adolescent Substance Abuse
9,
19–50.Google Scholar
Schulenberg, J.,
O'Malley, P. M.,
Bachman, J. G.,
Wadsworth, K. M., &
Johnston, L. D.
(1996).
Getting drunk and growing up: Trajectories of frequent binge
drinking during the transition to young adulthood.
Journal of Studies on Alcohol
57,
289–304.Google Scholar
Schulenberg, J.,
Wadsworth, K. M.,
O'Malley, P.M.,
Bachman, J.G., &
Johnston, L.D.
(1996).
Adolescent risk factors for binge drinking during the transition to
young adulthood: Variable and pattern-centered approaches to
change.
Developmental Psychology
32,
659–674.Google Scholar
Selzer, M.,
Vinokur, A.,
van Rooijen, L.
(1975).
A self-administered Short Michigan Alcoholism Screening Test
(SMAST).
Journal of Studies on Alcohol
36,
117–126.Google Scholar
Sher, K. J.,
Bartholow, B. D., &
Wood, M. D.
(2000).
Personality and substance use disorders: A prospective study.
Journal of Consulting and Clinical Psychology
68,
818–829.Google Scholar
Sher, K. J., &
Gotham, H. J.
(1999).
Pathological alcohol involvement: A developmental disorder of young
adulthood.
Development and Psychopathology
11,
933–956.Google Scholar
Sher, K. J.,
Gotham, H. J.,
Erickson, D. J., &
Wood, P. K.
(1996).
A prospective high-risk study of the relationship between Tobacco
Dependence and Alcohol Use Disorders.
Alcoholism: Clinical & Experimental Research
20,
485–491.Google Scholar
Sher, K. J.,
Trull, T. J.,
Bartholow, B., &
Vieth, A.
(1999).
Personality and alcoholism: Issues, methods, and etiological
processes. In
H. Blane &
K. Leonard (Eds.),
Psychological theories of drinking and alcoholism
(2nd ed., pp.
54–105).
New York:
Plenum.
Sher, K. J.,
Walitzer, K. S.,
Wood, P. K., &
Brent, E. E.
(1991).
Characteristics of children of alcoholics: Putative risk factors,
substance use and abuse, and psychopathology.
Journal of Abnormal Psychology
100,
427–448.Google Scholar
Sher, K. J., &
Wood, P. K.
(1997).
Problems encountered in conducting prospective research on alcohol
use: A report from the field. In
K. Bryant,
M. Windle, &
S. G. West (Eds.),
Advances in prevention research methodology (pp.
3–41).
Washington, DC:
American Psychological Association.
Sher, K. J.,
Wood, P. K., &
Gotham, H.
(1996).
The course of psychological distress in college: A prospective
high-risk study.
Journal of College Student Development
37,
42–51.Google Scholar
Sher, K. J.,
Wood, M. D.,
Wood, P. K., &
Raskin, G.
(1996).
Alcohol outcome expectancies and alcohol use: A latent variable
cross-lagged panel study.
Journal of Abnormal Psychology
105,
561–574.Google Scholar
Slutske, W. S.,
Heath, A. C.,
Dinwiddie, S. H.,
Madden, P. A. F.,
Bucholz, K. K.,
Dunne, M. P.,
Statham, D. J., &
Martin, N. G.
(1998).
Common genetic risk factors for conduct disorder and alcohol
dependence.
Journal of Abnormal Psychology
107,
363–374.Google Scholar
Slutske, W.S.,
Heath, A.C.,
Madden, P.A.F.,
Bucholz, K.K.,
Statham, D.J., &
Martin, N.G.
(2002).
Personality and the genetic risk for alcohol dependence.
Journal of Abnormal Psychology
111,
124–133.Google Scholar
Sobell, L. C.,
Cunningham, J. A.,
Sobell, M. B.,
Toneatto, T.
(1993).
Life-span perspective on natural recovery (self-change) from
alcohol problems. In
J. S. Baer,
G. A. Marlatt, &
R. J. McMahan (Eds.),
Addictive behaviors across the life span (pp.
34–66).
London:
Sage Publications.
Sobell, M. B., &
Sobell, L. C.
(1998).
Guiding self-change. In
W. R. Miller &
N. Heather (Eds.),
Treating addictive behaviors. Applied clinical psychology
(2nd ed., pp.
189–202).
New York:
Plenum Press.
Soldz, S., &
Cui, X.
(2002).
Pathways through adolescent smoking: A 7-year longitudinal grouping
analysis.
Health Psychology
21,
495–504.Google Scholar
Spitzer, R. L.
(1983).
Psychiatric diagnosis: Are clinicians still necessary?
Comprehensive Psychiatry
24,
399–411.Google Scholar
Tucker, J. A.,
Vuchinich, R. E., &
Pukish, M. M.
(1995).
Molar environmental contexts surrounding recovery from alcohol
problems by treated and untreated problem drinkers.
Experimental and Clinical Psychopharmacology
3,
195–204.Google Scholar
Tucker, J. S.,
Orlando, M., &
Ellickson, P. L.
(2003).
Patterns and correlates of binge drinking trajectories from early
adolescence to young adulthood.
Health Psychology
22,
79–87.Google Scholar
Vaillant, G. E.
(1995).
The Natural History of Alcoholism Revisited.
Cambridge, MA:
Harvard University Press.
Walitzer, K. S., &
Sher, K. J.
(1996).
A prospective study of self-esteem and alcohol use disorders in
early adulthood: Evidence for gender differences.
Alcoholism: Clinical & Experimental Research
20,
1118–1124.Google Scholar
Watson, A. L., &
Sher, K. J.
(1998).
Resolution of alcohol problems without treatment: Methodological
issues and future directions of natural recovery research.
Clinical Psychology: Science and Practice
5,
1–18.Google Scholar
Wechsler, H.,
Dowdall, G. W.,
Davenport, A., &
Castillo, S.
(1995).
Correlates of college student binge drinking.
American Journal of Public Health
85,
921–926.Google Scholar
Werch, C. E.
(1990).
Behavioral self-control strategies for deliberately limiting
drinking among college students.
Addictive Behaviors
15,
119–128.Google Scholar
Wood, M. D.,
Sher, K. J., &
McGowan, A. K.
(2000).
Collegiate alcohol involvement and role attainment in early
adulthood: Findings from a prospective high-risk study.
Journal of Studies on Alcohol
61,
278–289.Google Scholar
Zeiss, A. M., &
Lewinsohn, P. M.
(1988).
Enduring deficits after remissions of depression: A test of the
scar hypothesis.
Behaviour Research & Therapy
26,
151–158.Google Scholar
Ziemelis, A.,
Bucknam, R. B., &
Elfessi, A. M.
(2002).
Prevention efforts underlying decreases in binge drinking at
institutions of higher education.
Journal of American College Health
50,
238–252.Google Scholar
Zucker, R. A.
(1987).
The four alcoholisms: A developmental account of the etiologic
process. In
P. C. Rivers (Ed.),
Alcohol and addictive behaviors: Nebraska Symposium on Motivation
(pp.
27–83).
Lincoln, NE:
University of Nebraska Press.
Zucker, R. A.
(1995).
Pathways to alcohol problems and alcoholism: A developmental
account of the evidence for multiple alcoholisms and for contextual
contributions to risk. In
R. A. Zucker,
G. M. Boyd, &
J. Howard (Eds.),
The development of alcohol problems: Exploring the biopsychosocial
matrix of risk
(NIAAA Research Monograph 26, pp.
255–289).
Rockville, MD:
Department of Health and Human Services.
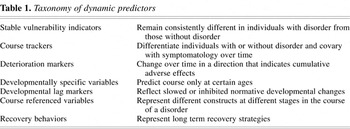
Taxonomy of dynamic predictors
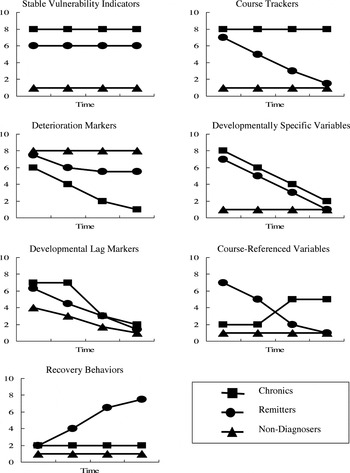
The seven possible patterns of dynamic predictors of alcohol use disorders over time.
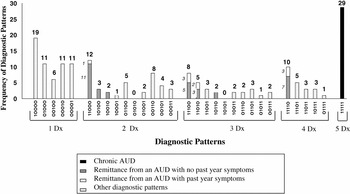
The temporal patterns of past-year DSM-III alcohol use disorder (AUD) diagnoses (Dx) over 7 years for those who were diagnosed at least once during the study (n = 177); 1 = AUD Dx and 0 = no Dx, with serial position corresponding to the year of data collection (e.g., 1, 2, 3, 4, or 7).
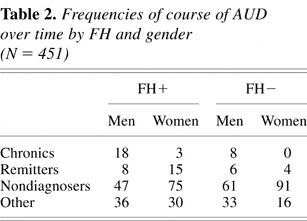
Frequencies of course of AUD over time by FH and gender (N = 451)
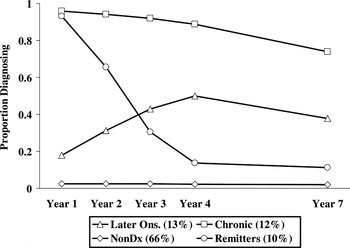
A latent class growth analysis of trajectories of 12-month DSM-III alcohol use disorders over 7 years; Dx, diagnosers.
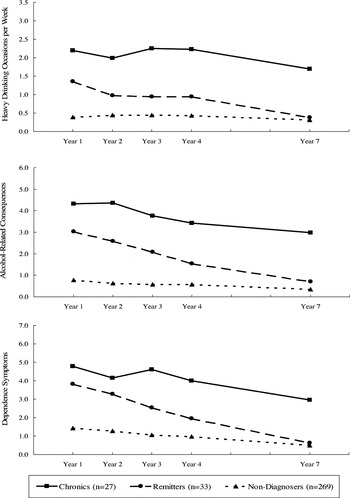
The levels of three alcohol involvement variables over time by the course of alcohol use disorders: heavy drinking occasions, alcohol-related consequences, and alcohol dependence symptoms.
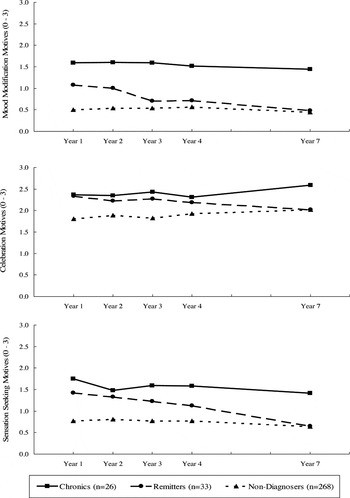
The levels of three reasons for drinking over time by course of alcohol use disorders: Mood Modification, Celebration, and Sensation Seeking.
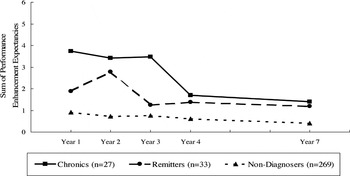
The level of Performance Enhancement alcohol expectancies over time by course of alcohol use disorders.
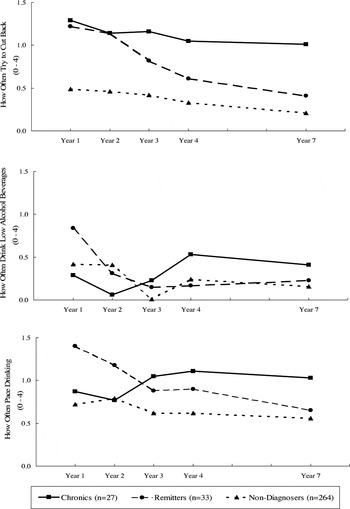
The levels of three restrained drinking items over time by the course of alcohol use disorders: frequency of trying to cut back, frequency of drinking low alcohol beverages, and frequency of pacing drinking.
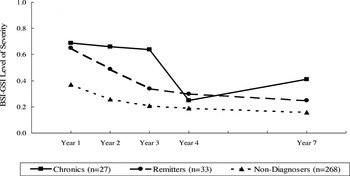
The level of psychological distress as measured by the BSI-GSI.
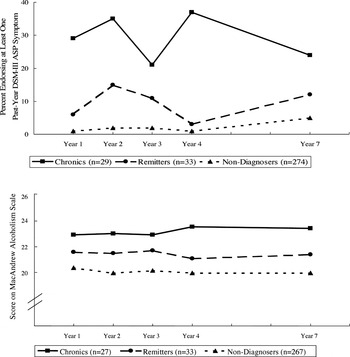
The percentage of participants reporting past-year antisocial personality disorder symptoms over time by the course of alcohol use disorders and scores on the MAC scale.
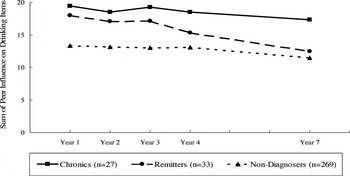
The level of peer involvement in drinking over time by the course of alcohol use disorders.
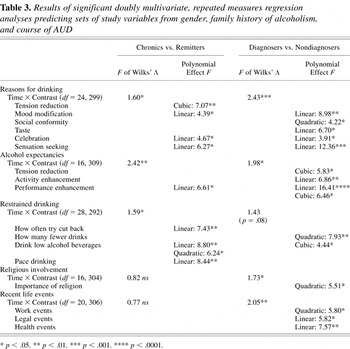
Results of significant doubly multivariate, repeated measures regression analyses predicting sets of study variables from gender, family history of alcoholism, and course of AUD
 You have
Access
- 27
- Cited by