


1. Introduction
Quantifying uncertainty in probability distributions plays an important role in statistical inference, reliability theory, and survival analysis. In recent years, information-theoretic measures such as entropy and its complementary dual, extropy, have received considerable attention because they provide useful tools for describing variability and uncertainty in random phenomena. Extropy-based measures have been increasingly applied in reliability analysis, lifetime modeling, and stochastic systems due to their ability to capture distributional characteristics that are not always reflected by entropy alone.
In statistical theory and practice, probability distributions are commonly characterized either through their distribution function or through their quantile function. In recent years, quantile-based methodologies have gained significant attention in the literature because quantile functions often provide a more convenient and interpretable representation of distributions, particularly when the density or distribution function is analytically complex or unavailable in closed form. Quantile functions retain complete information about the underlying distribution while offering practical advantages for statistical modeling, especially for skewed or heavy-tailed distributions frequently encountered in reliability engineering and survival analysis. A substantial body of literature has explored the theory and applications of quantile functions, including the works of Ramberg and Schmeiser [Reference Ramberg and Schmeiser35], Gilchrist [Reference Gilchrist15], Hankin and Lee [Reference Hankin and Lee18], Sankaran and Nair [Reference Sankaran and Nair37], Nair et al. [Reference Nair, Sankaran and Balakrishnan31], Maladan and Sankaran [Reference Maladan and Sankaran28], Aswin et al. [Reference Aswin, Sankaran and Sunoj6], and Sathar and Vijayan [Reference Abdul Sathar and Vijayan1].
Parallel to these developments, several studies have investigated uncertainty and information measures within the quantile framework. However, most of the existing works focus primarily on entropy and its related measures (see, e.g., Krishnan et al. [Reference Krishnan, Sunoj and Nair23–Reference Krishnan, Sunoj and Sankaran25]; and Kayal and Tripathy [Reference Kayal and Tripathy22]). In contrast, extropy, as the complementary dual of entropy, captures uncertainty from a different probabilistic perspective and has shown promising applications in reliability and information theory. Despite its growing importance, relatively little attention has been devoted to developing quantile-based formulations of extropy and its weighted variants.
Quantile functions are used as an equivalent alternative to distribution functions in modeling and analysis of statistical data (see Gilchrist [Reference Gilchrist15], Nair and Sankaran [Reference Nair and Sankaran30], and Sunoj and Sankaran [Reference Sunoj and Sankaran39]). Motivated by this, Sunoj and Sankaran [Reference Sunoj and Sankaran39] introduced a quantile-based Shannon entropy function. As noted by Sunoj and Sankaran [Reference Sunoj and Sankaran39], the residual quantile entropy function determines the quantile density function uniquely through a simple relationship, although the residual entropy function due to Ebrahimi [Reference Ebrahimi13] does not have such a relationship.
Motivated by these considerations, this paper introduces and studies quantile-based general weighted cumulative residual and past extropy for extreme order statistics. The motivation for adopting a quantile-based formulation arises from the need to analyze uncertainty measures in situations where distributions are more naturally expressed through their quantile functions rather than through density functions. The quantile-based weighted extropy function of residual random variable determines the quantile density function uniquely through a simple relationship, although the extropy function does not have such a relationship.
Such an approach provides greater flexibility and applicability, particularly in models involving skewed distributions, heavy-tailed behavior, or distributions with intractable density forms.
The proposed framework extends traditional entropy/extropy measures to a quantile-based setting and integrates them with weighted reliability concepts. We derive several theoretical properties of the proposed measures, obtain distributional characterizations, and illustrate the results through examples involving commonly used distributions. The proposed formulation not only broadens the applicability of extropy-based measures but also provides additional insights into the behavior of uncertainty measures associated with extreme order statistics.
Entropy has long been a cornerstone in information theory and statistics, serving as a primary measure of uncertainty. As its complementary dual, extropy, introduced by Lad et al. [Reference Lad, Sanfilippo and Agrò26], offers an alternative perspective by emphasizing the role of lower-probability events. While sharing several properties with entropy, extropy provides distinct interpretations in areas such as reliability analysis, risk assessment, and statistical modeling. Lad et al. [Reference Lad, Sanfilippo and Agrò26] defined extropy, also called the differential extropy, of an absolutely continuous random variable  $X$, with probability density function (pdf)
 $f_X(x)$ as
 \begin{equation}
J(X)=-\frac{1}{2}\int_{S_X} f_X^2(x)dx,
\end{equation}
here  $X$ is defined on
 $S_X=(l_X,u_X)$, where
 \begin{equation*}
l_X=\inf\{x\in\mathbb{R}:F_X(x) \gt 0\}, \qquad
u_X=\sup\{x\in\mathbb{R}:F_X(x) \lt 1\}.
\end{equation*}
We assume throughout that the density function  $f$ satisfies
 $f \in L^2(\mathbb{R})$ to ensure that the extropy measure is finite. The extropy measure is translation invariant. Specifically, for any constant
 $a \in \mathbb{R}$,
 \begin{equation*}
J(X+a) = J(X),
\end{equation*}
since if  $Y = X + a$, then its density is given by
 $f_Y(y) = f_X(y-a)$, and hence
 \begin{equation*}
\int_{-\infty}^{\infty} f_Y^2(y)\,dy = \int_{-\infty}^{\infty} f_X^2(x)\,dx.
\end{equation*}
Since its introduction, extropy has inspired a range of developments, including residual extropy (see Qiu and Jia [Reference Qiu and Raqab34]), past extropy, record value extropy (Jose and Sathar [Reference Jose and Abdul Sathar20]), and ranked set sampling extropy (Raqab and Qiu [Reference Raqab and Qiu36]). These extensions capture uncertainty in different contexts, particularly in lifetime and reliability studies. Researchers have also explored distributional properties, estimation techniques (Alizadeh et al. [Reference Alizadeh Noughabi and Jarrahiferiz4]), and bounds for extropy-based measures.
In reliability and life testing, data are frequently subject to truncation, rendering conventional measures such as the standard extropy  $ J(X) $ inadequate. To overcome this limitation, Qiu and Jia [Reference Qiu and Jia33] proposed the concept of residual extropy, which assesses the uncertainty in the remaining lifetime of a component that has already survived up to a specific time
 $ t $. This residual lifetime is denoted by
 $ X_t = (X - t \mid X \gt t) $, and the associated differential residual extropy is defined as
 \begin{equation}
J(X_t) = -\frac{1}{2 \, \bar{F}(t)^2} \int_t^{u_X} f^2(x) \, dx,
\end{equation}
where  $ f(x) $ represents the pdf and
 $ \bar{F}(t) $ is the survival function. This formulation offers a more appropriate way to quantify uncertainty in the presence of truncated data. Further investigations and applications of residual extropy have been discussed in studies by Raqab and Qiu [Reference Raqab and Qiu36], Yang et al. [Reference Yang, Hutson and Wang41], Alizadeh Noughabi and Jarrahiferiz [Reference Alizadeh Noughabi and Jarrahiferiz4], and Jose and Sathar [Reference Jose and Abdul Sathar20].
The primary flaw in the information measures mentioned above is that they solely take the probability density of the random variable into account, without taking into account its values. More precisely, the integrand on the right-hand side of Eq. (1) depends on  $x$ exclusively through its pdf, which makes the measure shift-independent. Nevertheless, this shift-independent quality proves to be a disadvantage in many applicable fields, like mathematical neurobiology or reliability. In these cases, the values taken by the random variables and the probabilities become important considerations. So weighted and general weighted extropy are measures of interest. The requirement for the presence of weighted measures of uncertainty was highlighted by Di Crescenzo and Longobardi [Reference Di Crescenzo and Longobardi12], Balakrishnan et al. [Reference Balakrishnan, Buono and Longobardi7], Bansal and Gupta [Reference Bansal and Gupta8], as well as Gupta and Chaudhary [Reference Gupta and Chaudhary17]. Weighted extropy serves as an indicator of the information provided by a probabilistic experiment, where the individual events are defined by both their objective probabilities and qualitative weights. We have new information measures called weighted extropy and general weighted extropy, which are comparable to weighted entropy and can be used to efficiently model statistical data.
In analogy with the weighted Shannon entropy proposed by Belis and Guiasu [Reference Belis and Guiasu9] and Guiasu [Reference Guiasu16], Gupta and Chaudhary [Reference Gupta and Chaudhary17] introduced the general weighted extropy (GWJ) for the random variable  $X$. For a weight function
 $w_1(x)$ which is assumed to be non-negative, integrable, and defined on
 $S_X$, the GWJ of random variable
 $X$ is defined as
 \begin{equation}
J^{w_1}(X)=-\frac{1}{2} \int_{S_X}w_1(x) f^2(x)dx.
\end{equation}
The assertion that the  $\text{Beta}(2,1)$ and
 $\text{Beta}(1,2)$ distributions possess the exact same standard extropy but distinct weighted extropies is mathematically true and highlights the fundamental differences between shift-independent and shift-dependent information measures. When evaluating
 $X_1 \sim \text{Beta}(2,1)$ with pdf
 $f_1(x) = 2x$, the standard extropy computes to
 $J(X_1) =-\frac{2}{3}$. Conversely, evaluating
 $X_2 \sim \text{Beta}(1,2)$ with density
 $f_2(x) = 2(1-x)$ yields
 $J(X_2) = -\frac{2}{3}$. This equality arises because standard extropy measures purely structural uncertainty and treats mirror-image distributions symmetrically. However, introducing a linear weight function
 $\phi(x) = x$ to compute the weighted extropy breaks this directional symmetry. The weighted extropy for
 $X_1$ is evaluated as
 $J_w(X_1) = -\frac{1}{2}$, whereas the weighted extropy for
 $X_2$ evaluates to
 $J_w(X_2) = -\frac{1}{6}$.
The primary role of the weight function is to break the shift-invariance property inherent to classical extropy ( $J(X+a) = J(X)$) by assigning a weight function and
 $J^w(X+a) \neq J^w(X).$ When translated into the quantile domain via the probability integral transform
 $X = Q(u)$ for
 $u \in (0,1)$, the linear weight function
 $w(x) = x$ transforms into the quantile-dependent weight
 $w(Q(u)) = Q(u)$. The choice of a linear weight is fundamentally motivated by the physical requirements of reliability engineering and survival analysis, where uncertainty must scale directly with elapsed operational lifetime or magnitude. Crucially, this specific selection ensures that the quantile-based weighted residual extropy determines the underlying quantile density function
 $q(u) = Q'(u)$ uniquely through a direct, analytically tractable relationship—a structural advantage that classical, unweighted extropy entirely lacks.
Furthermore, a global functional sensitivity assessment shows that while changing the weight function to a non-linear form (e.g., quadratic  $w(x)=x^2$ or exponential
 $w(x)=e^{\alpha x}$) naturally alters the absolute scale of the uncertainty index, the fundamental stochastic orderings and the characterization properties for symmetric parent distributions remain completely invariant. This mathematical consistency establishes that the analytical insights and ordering relations developed under our quantile-based framework are structurally robust and independent of minor variations in the selection of the utility weight.
This paper is organized as follows. In Section 2, we introduce the quantile-based weighted extropy and its residual version and obtain some results and properties. Section 3 presents weighted extropy of order statistics using the quantile function. We extend the measure based on the survival function, known as weighted cumulative residual extropy, and study its characterization and properties in Section 4. Section 5 proposes a nonparametric estimator for the quantile-based weighted extropy function, and a simulation study and data analysis are performed. In Section 6, a real data application is discussed. In the end, Section 7 concludes this paper.
2. Quantile-based weighted residual extropy
Throughout the paper, we assume that the random variable  $X$ is defined on
 $S_X$ and is absolutely continuous, with the cumulative distribution function (CDF)
 $F$ assumed to be strictly increasing, continuous, and differentiable, the density satisfies
 $f \in L^2(\mathbb{R})$, the weight function
 $w(x)$ is non-negative and integrable and defined on
 $S_X$, and the quantile function
 $Q(u)$ is differentiable.
The quantile function of a random variable  $X$, with CDF
 $F$, is defined as
 \begin{equation}
Q(p) = F^{-1}(p) = \inf\{x \in \mathbb{R} : F(x) \geq p\}, \quad 0 \lt p \lt 1.
\end{equation}
An elegant example of a continuous probability distribution that lacks a closed-form CDF but possesses an explicit, closed-form quantile function is the Tukey Lambda distribution (Tukey [Reference Tukey40]).
Instead of being defined via its density or distribution function, the Tukey Lambda distribution is defined directly through its quantile function  $Q(p)$, where
 $p \in [0, 1]$ represents the cumulative probability as
 \begin{equation}
Q(p) = \frac{p^\lambda - (1-p)^\lambda}{\lambda}
\end{equation}
Here,  $\lambda \in \mathbb{R}$ is a shape parameter. Despite lacking an explicit CDF, this quantile-defined family is highly valued in statistical modeling and Monte Carlo simulations due to its structural simplicity and ability to approximate various standard distributions. Hence, quantile-based reliability analysis of weighted extropy is a useful study.
Let  $ X $ be a continuous random variable with pdf
 $ f(\cdot) $. Then, the composition
 $ f(Q(p)) $ is referred to as the density quantile function, while its derivative
 $ q(p) = \frac{d}{dp} Q(p) $ is known as the quantile density function (see Parzen [Reference Parzen32]).
From the relationship  $ F(Q(p)) = p $, it follows, by differentiation with respect to
 $ p $, that (see Krishnan et al. [Reference Krishnan, Sunoj and Sankaran25])
 \begin{equation}
q(p) f(Q(p)) = 1.
\end{equation}
Equation (6) holds under the assumption that the distribution function  $F$ is strictly increasing and differentiable, with
 $f(Q(p)) \gt 0$ for all
 $p \in (0,1)$.
This identity connects the quantile function with the corresponding density function and serves as a key tool in developing quantile-based information measures.
A particularly important quantity in reliability analysis is the hazard quantile function, defined as
 \begin{equation}
H(p) = h(Q(p)) = \frac{1}{(1 - p) q(p)}, \quad 0 \lt p \lt 1.
\end{equation}
This definition requires that the quantile function  $Q(p)$ is differentiable on
 $(0,1)$, where
 $ h(t) = \frac{f(t)}{\bar{F}(t)} $ denotes the traditional hazard rate function of
 $ X $, and
 $ \bar{F}(t) = 1 - F(t) $ is the survival function. The hazard quantile function
 $H(p)$ represents the instantaneous risk at the
 $p$-th quantile.
The mean residual life (MRL) function describes the expected remaining lifetime of a component that has survived up to a specific time  $ x $. It is defined as
 \begin{equation}
m(x) = \mathbb{E}(X - x \mid X \gt x) = \frac{1}{1 - F(x)} \int_x^{u_X} (1 - F(t)) \, dt,
\end{equation}
where  $ F(x) $ is the CDF of the lifetime variable
 $ X $. Building on this, the mean residual quantile function evaluates the MRL at a specific quantile level. It is given by
 \begin{equation}
M(u) = m(Q(u)) = \frac{1}{1 - u} \int_u^1 (1 - p) q(p) \, dp= \frac{1}{1 - u} \int_u^1 (Q(p) - Q(u)) \, dp,
\end{equation}
where  $ Q(u) $ is the quantile function corresponding to
 $ F(x) $, and
 $ q(p) = \frac{d}{dp}Q(p) $ is its derivative. This quantile-based formulation of the MRL is particularly useful in reliability analysis and survival studies for interpreting remaining life in terms of distributional quantiles.
It is worth noting that  $ H(p) $ uniquely determines the quantile function
 $ Q(p) $ (see Nair and Sankaran [Reference Nair and Sankaran30]). This makes
 $ H(p) $ a fundamental tool for characterizing lifetime distributions in the quantile domain.
Krishnan et al. [Reference Krishnan, Sunoj and Sankaran25] investigated various properties of extropy and its associated measures through the lens of quantile functions. The study explored ordering relationships related to quantile-based residual extropy.
Using the identity  $F(Q(p)) = p$, differentiation with respect to
 $p$ yields
 $ f(Q(p))\,Q'(p) = 1,$ which implies
 $f(Q(p)) = \frac{1}{q(p)}$, where
 $q(p) = Q'(p)$ is the quantile density function. The quantile-based weighted extropy with weight
 $w_1(x)\geq 0$ is defined as
 \begin{align*}
L^{w_1}(X)&=-\frac{1}{2} \int_{0}^{1}w_1(Q(p)) f^2(Q(p))dQ(p)\\
&=-\frac{1}{2} \int_{0}^{1}w_1(Q(p)) \left(q(p)\right)^{-1}dp\\
&=-\frac{1}{2}\int_{0}^{1}w_1(Q(p)) (1-p) H(p) dp,
\end{align*}
here  $L^{w_1}(X)$ is the quantile version of weighted extropy. It measures the uncertainty of random variable
 $X$, which is obtained either using the quantile density function or the hazard quantile function. When
 $w_1(x)=\left(F(x)\right)^{\alpha-1}$, then we denote
 $L^{w_1}(X)$ as
 $L^{(\alpha)}(X)$. The expression for
 $L^{\alpha}(X)$ is obtained as
 \begin{align*}
L^{(\alpha)}(X)&=-\frac{1}{2} \int_{0}^{1} p^{\alpha-1} f^2(Q(p))dQ(p)\\
&=-\frac{1}{2} \int_{0}^{1} p^{\alpha-1} \left(q(p)\right)^{-1}dp\\
&=-\frac{1}{2}\int_{0}^{1} p^{\alpha-1} (1-p) H(p) dp.
\end{align*}
Table 1 lists several standard quantile functions together with their associated quantile-based weighted extropy  $L^{(\alpha)}(X)$ functions. Let
 $X$ and
 $Y$ be random variables with Pareto II
 $(c=1,\ \gamma=1)$ and Rescaled beta
 $(c=1,\ R=3)$, respectively. Then
 $L(X)=L(Y)=-1/6$, but
 $L^{(2)}(X)=-1/24$ and
 $L^{(2)}(Y)=-1/12$. Thus, in this case, quantile version of extropies are the same, but the quantile version of weighted extropies are different for
 $\alpha=2$. Therefore, the quantile version of weighted extropies can also play a role as a measure of uncertainty.
Quantile-based weighted extropy for some quantile functions.

Table 1 Long description
Four columns give distribution name, probability density function, quantile function, and L alpha of X. Rows cover Exponential with parameter lambda, Pareto II with parameters gamma and c, Rescaled Beta with parameters c and R, Generalized Pareto with parameters a and b, Power with parameters gamma and beta, Uniform with parameters a and b, and Davies with parameters c, lambda 1, and lambda 2. For Exponential, the density is defined for x greater than zero, and L alpha of X is written using lambda and the beta function. Pareto II and Generalized Pareto list densities with a one plus x over a scale term raised to a negative power, and their L alpha of X entries use the beta function with parameter combinations that include c or a. Rescaled Beta and Power specify support between zero and an upper bound, R or gamma, and their L alpha of X entries include c over R or a rational expression in beta and gamma. Uniform gives a constant density between a and b, a linear quantile function in u, and an L alpha of X term proportional to one over alpha times b minus a. Davies provides a density written in terms of u with parameters c, lambda 1, and lambda 2, a quantile function using powers of u and one minus u, and an L alpha of X expression that continues onto a second line with a beta function term multiplied by a hypergeometric function.
In Table 1,  $B(a, b)$ represents complete Beta function defined as
 \begin{equation*}
B(a, b) = \int_0^1 p^{a - 1}(1 - p)^{b - 1} \, dp,
\end{equation*}
and the symbol  ${}_2F_1(a,b;c;z)$ represents the Gauss hypergeometric function, defined as:
 \begin{equation*}
{}_2F_1(a,b;c;z) = \sum_{n=0}^{\infty} \frac{(a)_n\, (b)_n}{(c)_n} \frac{z^n}{n!}
\end{equation*}
where
(i)
 $(a)_n$ is the Pochhammer symbol or rising factorial, defined by:
\begin{equation*}
(a)_0 = 1,\quad (a)_n = a(a+1)\cdots(a+n-1),\quad \text{for } n \geq 1
\end{equation*}
(ii)
$a, b, c, z$ can be real or complex numbers, with the restriction that
$c \notin \mathbb{Z}_{\leq 0}$.(iii) The series converges absolutely for
$|z| \lt 1$, and may also converge at
$|z| = 1$ under suitable conditions on
$a, b, c$.


The quantile-based weighted extropy of  $X_t$, denoted by
 $L_Q^{w_1}(u)$, measures the magnitude-sensitive uncertainty of the residual lifetime beyond quantile
 $u$ and is defined as
 \begin{align}
L_Q^{w_1}(u)
&= -\frac{1}{2(1-u)^2}
\int_u^1 w_1\bigl(Q(p)\bigr)f^2\bigl(Q(p)\bigr)\,dQ(p)\\
&= -\frac{1}{2(1-u)^2}
\int_u^1 w_1\bigl(Q(p)\bigr)\bigl(q(p)\bigr)^{-1}\,dp\\
&= -\frac{1}{2(1-u)^2}
\int_u^1 w_1\bigl(Q(p)\bigr)(1-p)H(p)\,dp.
\end{align}
Now differentiating (10) with respect to  $u$, using Leibniz’s rule, taking into account the dependence of both the integral limits and the factor
 $(1-u)^2$ on
 $u$, we have
 \begin{equation}
\left(L_{Q}^{w_1}(u)\right)^\prime=\frac{w_1(Q(u)) H(u)}{2(1-u)}+\frac{2L_{Q}^{w_1}(u)}{(1-u)}
\end{equation}
equivalentely
 \begin{equation}
q(u)=w_1(Q(u))\left(2(1-u)^2\left(L_{Q}^{w_1}(u)\right)^\prime-4(1-u)L_{Q}^{w_1}(u)\right)^{-1}
\end{equation}
The above inversion formula holds provided that  $ 2(1-u)^2\left(L_{Q}^{w_1}(u)\right)^\prime-4(1-u)L_{Q}^{w_1}(u) \neq 0. $ The above expression determines
 $L_{Q}^{w_1}(u)$ uniquely using the quantile density function through this simple relationship, although the extropy function does not have such a relationship.
When  $w_1(x)=\left(F(x)\right)^{\alpha-1}$, then we denote
 $L_Q^{w_1}(X)$ as
 $L_Q^{(\alpha)}(X)$. The expression for
 $L_Q^{\alpha}(X)$ is obtained as
 \begin{align*}
L_Q^{w^1}(u)
&= -\frac{1}{2(1-u)^2}
\int_u^1 w_1(Q(p))f^2(Q(p))\,dQ(p)\\
&= -\frac{1}{2(1-u)^2}
\int_u^1 w_1(Q(p))\left(q(p)\right)^{-1}\,dp\\
&= -\frac{1}{2(1-u)^2}
\int_u^1 w_1(Q(p))(1-p)H(p)\,dp.
\end{align*}
In Table 2,  $B_u(a, b)$ represents incomplete Beta function defined as
 \begin{equation*}
B_u(a, b) = \int_u^1 p^{a - 1}(1 - p)^{b - 1} \, dp.
\end{equation*}
Quantile-based weighted residual extropy  $ L_Q^{(\alpha)}(u) $ using incomplete Beta function representations.

Table 2 Long description
Columns are labeled, Distribution, Quantile Function Q of u, and L Q of alpha of u. Each row pairs a named distribution with its quantile function and an expression for L Q of alpha of u written using an incomplete Beta function. Exponential gives a log based quantile with rate parameter lambda greater than zero, and an L Q term with lambda times an incomplete Beta function with parameters alpha and two. Pareto II gives a quantile using gamma and c greater than zero, and an L Q term with c over gamma and an incomplete Beta function with parameters alpha and two plus one over c. Rescaled Beta gives a quantile using R and c greater than zero, and an L Q term with c over R and an incomplete Beta function with parameters alpha and two minus one over c. Generalized Pareto gives a quantile using a greater than minus one and b greater than zero, and an L Q term with a plus one over b and an incomplete Beta function with parameters alpha and two plus a over a plus one. Power gives a quantile using gamma and beta greater than zero, and an L Q term with beta over gamma and an incomplete Beta function with parameters alpha plus one minus one over beta and one. Uniform gives a linear quantile from a to b with a less than b, and an L Q term with one over b minus a and an incomplete Beta function with parameters alpha and one. Davies gives a quantile using c, lambda one, and lambda two greater than zero, and an L Q term with one over c and an incomplete Beta function with parameters alpha minus lambda one plus one and lambda two plus two.
Theorem 1. Let random variable  $X$ follows a distribution with quantile density function
 \begin{equation}q(u)=ku^\delta (1-u)^{-(A+\delta)}, \ k \gt 0,\ A,\delta \in \mathbb{R}, \ u\in (0,1),\end{equation}
if and only if
 \begin{equation*}(1-u)^2L_{Q}^{(\alpha)}(u)=-k_1\tilde{B}_u(a,b),\end{equation*}
where  $k_1 \gt 0$ and
 $\tilde{B}_u(a,b)=\int_{u}^{1}p^{a-1}(1-p)^{b-1}dp$ denote the incomplete beta function.
Proof. Since the proof of the if part is straightforward, we only prove the only-if part. Assume  $(1-u)^2L_{Q}^{(\alpha)}(u)=-k_1\tilde{B}_u(a,b)$ holds. On differentaiting both sides with respect to
 $u$, we have
 \begin{equation*}(1-u)^2\left(L_{Q}^{(\alpha)}(u)\right)^\prime-2(1-u)L_{Q}^{(\alpha)}(u)=k_1u^{a-1}(1-u)^{b-1}.\end{equation*}
Now from (12) with  $w(x)=\left(F(x)\right)^{\alpha-1}$ and using above equation, we obtain the quantile model (13).
 $\square$
The family of distributions (13) contains some important probability distributions; one may refer to Krishnan et al. [Reference Krishnan, Sunoj and Sankaran25] and Nair et al. [Reference Nair, Sankaran and Balakrishnan31] for details of these.
Definition 1.  $X$ has increasing (decreasing) quantile-based weighted residual extropy if
 $L_Q^{w_1}(u)$ is increasing (decreasing) in
 $u$.
The proof of the following theorem is straightforward from (11), hence omitted.
Theorem 2. Let the random variable  $X$ have quantile function
 $Q_X(u)$ and hazard quantile function
 $H_X(u)$. If the quantile-based weighted extropy is increasing (decreasing) in
 $u$, then
 $L_{Q_X}^{w_1}(u)\geq (\leq) \frac{-w_1(Q_X(u))H_X(u)}{4}$.
Proof. From Eq. (11), we have
 \begin{equation*}
\left(L^{w_1}_{Q_X}(u)\right)'
= \frac{w_1(Q_X(u)) H_X(u)}{2(1-u)}
+ \frac{2L^{w_1}_{Q_X}(u)}{1-u}.
\end{equation*}
Multiplying both sides by  $(1-u)$, we obtain
 \begin{equation*}
(1-u)\left(L^{w_1}_{Q_X}(u)\right)'
=
\frac{w_1(Q_X(u)) H_X(u)}{2}
+
2L^{w_1}_{Q_X}(u).
\end{equation*}
Rearranging terms gives
 \begin{equation*}
2L^{w_1}_{Q_X}(u)
=
(1-u)\left(L^{w_1}_{Q_X}(u)\right)'
-
\frac{w_1(Q_X(u)) H_X(u)}{2}.
\end{equation*}
Hence,
 \begin{equation*}
L^{w_1}_{Q_X}(u)
=
\frac{1-u}{2}\left(L^{w_1}_{Q_X}(u)\right)'
-
\frac{w_1(Q_X(u)) H_X(u)}{4}.
\end{equation*}
Now consider two cases.
Case 1: If  $L^{w_1}_{Q_X}(u)$ is increasing in
 $u$, then
 \begin{equation*}
\left(L^{w_1}_{Q_X}(u)\right)' \ge 0.
\end{equation*}
Since  $1-u \gt 0$ for
 $u \in (0,1)$, we get
 \begin{equation*}
\frac{1-u}{2}\left(L^{w_1}_{Q_X}(u)\right)' \ge 0.
\end{equation*}
Therefore,
 \begin{equation*}
L^{w_1}_{Q_X}(u)
\ge
-\frac{w_1(Q_X(u)) H_X(u)}{4}.
\end{equation*}
Case 2: If  $L^{w_1}_{Q_X}(u)$ is decreasing in
 $u$, then
 \begin{equation*}
\left(L^{w_1}_{Q_X}(u)\right)' \le 0.
\end{equation*}
Thus,
 \begin{equation*}
\frac{1-u}{2}\left(L^{w_1}_{Q_X}(u)\right)' \le 0,
\end{equation*}
and consequently,
 \begin{equation*}
L^{w_1}_{Q_X}(u)
\le
-\frac{w_1(Q_X(u)) H_X(u)}{4}.
\end{equation*}
This completes the proof.
Definition 2.  $X$ is less than
 $Y$ in dispersive order (
 $X\leq_{disp} Y$) if
 $Q_Y(u)-Q_X(u)$ is increasing in
 $u\in (0,1)$.
Theorem 3. Let  $X$ and
 $Y$ be non-negative random variables. if
 $w_1(x)$ is increasing,
 $w_2(x)\leq w_1(x)$, and
 $X\leq_{disp} Y$, then
 $L_{Q_X}^{w_1}(u)\leq L_{Q_Y}^{w_2}(u)$ for all
 $u\in (0,1)$.
Proof. Using Theorem 3.B.13(b) of Shaked and Shanthikumar [Reference Shaked and Shanthikumar42],  $X\le_{disp} Y$ implies that
 $X\ge_{st} Y$. Hence
 $Q_X(u) \ge Q_Y(u)$ for all
 $u\in (0,1)$. Since
 $w_1(x)$ is increasing and
 $w_2(x)\leq w_1(x)$, hence
 \begin{equation}
w_1(Q_X(u)) \ge w_1(Q_Y(u))\ge w_2(Q_Y(u)).
\end{equation}
Now, since  $X\leq_{disp} Y$ and using (14), we have
 \begin{equation}
w_1(Q_X(u)) \left(q_X(u)\right)^{-1}\geq w_2(Q_Y(u)) \left(q_Y(u)\right)^{-1}.
\end{equation}
 \begin{align*}
L_{Q_X}^{w_1}(u)&=-\frac{1}{2(1-u)^2} \int_{u}^{1}w_1(Q_X(p)) \left(q_X(p)\right)^{-1}dp\\
&\leq -\frac{1}{2(1-u)^2} \int_{u}^{1}w_2(Q_Y(p)) \left(q_Y(p)\right)^{-1}dp\\
&=L_{Q_Y}^{w_2}(u)
\end{align*}
Example 1. Let us consider  $X\sim\operatorname{Exp}(1)$ and
 $Y\sim\operatorname{Exp}(0.5)$ with weight functions
 $w_1(x)=x+1, \text{and} \ \ w_2(x)=x.$ We obtain the explicit functions
 \begin{equation*}
{L_{Q_X}^{w_1}(u)=\frac14\log(1-u)-\frac38},\qquad
{L_{Q_Y}^{w_2}(u)=\frac14\log(1-u)-\frac18}.
\end{equation*}
We have  $L_{Q_X}^{w_1}(u) \leq L_{Q_Y}^{w_2}(u)$ for all
 $u\in(0,1)$,
Lemma 1. (Ahmed et al. [Reference Ahmed, Alzaid, Bartoszewicz and Kochar3]; also see Qiu and Raqab [Reference Qiu and Raqab34, Lem. 4.3])
Let  $X$ and
 $Y$ be non-negative random variables with pdf’s
 $f$ and
 $g$, respectively, satisfying
 $f(0)\ge g(0) \gt 0$. If
 $X\le_{su}Y$ (or
 $X\le_{*}Y$ or
 $X\le_{c}Y$), then
 $X\le_{disp}Y$.
One may refer to Shaked and Shantikumar [Reference Shaked and Shanthikumar42] for details of convex transform order ( $\leq_c$), star order (
 $\leq_{\star}$), superadditive order (
 $\leq_{su}$), and dispersive order (
 $\leq_{disp}$). In view of Theorem 3 and Lemma 1, the following result is obtained.
Theorem 4. Let  $X$ and
 $Y$ be non-negative random variables with
 $q_X(0)\leq q_Y(0)$. If
 $w_1$ is increasing,
 $w_1(x)\geq w_2(x)$ and
 $X\le_{su} Y$ (or
 $X\le_{*}Y$ or
 $X\le_{c}Y$), then
 $L_{Q_X}^{w_1}(u)\leq L_{Q_Y}^{w_2}(u)$ for all
 $u\in (0,1)$.
3. Weighted extropy of order statistics
Let  $X_{i:n}$ denote the
 $i$th order statistic. The weighted extropy of
 $i$th order statistic with weight
 $w_1$ is given by
 \begin{equation}
J(X_{i:n})=\frac{-1}{2}\int_{S_X}w_1(x)f_{i:n}^{2}(x)dx.
\end{equation}
Now the quantile-based weighted extropy based on (16) is
 \begin{align*}
&L^{w_1}(X_{i:n})\\ &\ =
-\frac{1}{2} \int_{0}^{1}w_1(Q(u)) \frac{(n!)^2}{((i-1)!)^2 ((n-i)!)^2} u^{2i-2} (1-u)^{2n-2i}\left(q(u)\right)^{-2}dQ(u)\\
&\ =-\frac{1}{2} \int_{0}^{1}w_1(Q(u)) \frac{(n!)^2}{((i-1)!)^2 ((n-i)!)^2} u^{2i-2} (1-u)^{2n-2i}\left(q(u)\right)^{-1}du.
\end{align*}
In the following theorem, we study the property of quantile-bsed extropy of order statistics when the underlying iid random variables are symmetric.
Theorem 5. Let  $X_1,\ldots,X_n$ be a random sample from a distribution which is symmetric about mean
 $\mu$. Then
(1)
$L^{w_1}(X_{i:n})=L^{w_1}(X_{n-i+1:n})$(2)
$ \Delta L^{w_1}(X_{i:n})=-\Delta L^{w_1}(X_{n-i+1:n}), \ \forall i=1,\ldots,n-1$, where
$\Delta L^{w_1}(X_{i:n})=L^{w_1}(X_{i+1:n})-L^{w_1}(X_{i:n})$


Proof.
Let  $X_1, \dots, X_n$ be a random sample from a distribution symmetric about
 $\mu$. Then the quantile function satisfies
 \begin{equation*}
Q(1-u) = 2\mu - Q(u), \quad 0 \lt u \lt 1.
\end{equation*}
Differentiating both sides with respect to  $u$, we obtain
 \begin{equation*}
q(1-u) = q(u),
\end{equation*}
so the quantile density function is symmetric.
Now recall that the quantile-based weighted extropy of the  $i$-th order statistic is
 \begin{equation*}
L_{w_1}(X_{i:n})
=
-\frac{1}{2}
\int_0^1
w_1(Q(u))
\frac{(n!)^2}{((i-1)!)^2((n-i)!)^2}
u^{2i-2}(1-u)^{2n-2i}
(q(u))^{-1} \, du.
\end{equation*}
Let
 \begin{equation*}
C_{i,n}
=
\frac{(n!)^2}{((i-1)!)^2((n-i)!)^2}.
\end{equation*}
Then
 \begin{equation*}
L_{w_1}(X_{i:n})
=
-\frac{1}{2}
\int_0^1
w_1(Q(u))
C_{i,n}
u^{2i-2}(1-u)^{2n-2i}
(q(u))^{-1}
\, du.
\end{equation*}
Now consider  $L_{w_1}(X_{n-i+1:n})$:
 \begin{equation*}
L_{w_1}(X_{n-i+1:n})
=
-\frac{1}{2}
\int_0^1
w_1(Q(u))
C_{n-i+1,n}
u^{2n-2i}(1-u)^{2i-2}
(q(u))^{-1}
\, du.
\end{equation*}
Observe that
 \begin{equation*}
C_{n-i+1,n} = C_{i,n}.
\end{equation*}
Now make the transformation  $u = 1-v$. Then
 $du = -dv$, and the limits remain
 $(0,1)$. Using symmetry properties:
 \begin{equation*}
Q(1-v) = 2\mu - Q(v), \quad q(1-v) = q(v).
\end{equation*}
Also,
 \begin{equation*}
(1-v)^{2n-2i} v^{2i-2}
=
v^{2i-2}(1-v)^{2n-2i}.
\end{equation*}
Thus the integral for  $L_{w_1}(X_{n-i+1:n})$ becomes identical to that of
 $L_{w_1}(X_{i:n})$.
Hence,
 \begin{equation*}
L_{w_1}(X_{i:n}) = L_{w_1}(X_{n-i+1:n}).
\end{equation*}
This proves part (i).
For part (ii), define
 \begin{equation*}
\Delta L_{w_1}(X_{i:n})
=
L_{w_1}(X_{i+1:n}) - L_{w_1}(X_{i:n}).
\end{equation*}
Using part (i), we have
 \begin{equation*}
L_{w_1}(X_{i:n})
=
L_{w_1}(X_{n-i+1:n}).
\end{equation*}
Then
 \begin{equation*}
\Delta L_{w_1}(X_{n-i:n})
=
L_{w_1}(X_{n-i+1:n})
-
L_{w_1}(X_{n-i:n}).
\end{equation*}
Replacing using symmetry,
 \begin{equation*}
=
L_{w_1}(X_{i:n})
-
L_{w_1}(X_{i+1:n})
=
-
\Delta L_{w_1}(X_{i:n}).
\end{equation*}
Therefore,
 \begin{equation*}
\Delta L_{w_1}(X_{i:n})
=
-
\Delta L_{w_1}(X_{n-i+1:n}),
\quad i=1,\dots,n-1.
\end{equation*}
This completes the proof.
Let
 \begin{align*}
\phi_{2i-1:2n-1}(u)= \frac{(2n-1)!}{(2i-2)! (2n-2i)!} u^{2i-2} (1-u)^{2n-2i}, 0 \lt u \lt 1.
\end{align*}
Then  $\phi_{2i-1:2n-1}(u)$ represents the pdf of a beta-distributed random variable with parameters (2
 $i-$1) and (2
 $n-2i$+1); we denote this random variable by
 $B_{2i-1:2n-1}$.
Now we consider the quantile-based weighted residual extropy of the  $i$th order statistic based on the random variable
 $X_t$ as
 \begin{align*}
L_{Q_{i:n}}^{w_1}(u) &
=-\frac{1}{2} \int_{u}^{1}w_1(Q(p)) \frac{(n!)^2}{((i-1)!)^2 ((n-i)!)^2} p^{2i-2} (1-p)^{2n-2i}\left(q(p)\right)^{-1}dp.\\
&=-\frac{c_{i,n}(2i-1)}{4}\int_{u}^{1}w_1(Q(p))r\left(Q(p)\right)\phi_{2i:2n}(p)dp\\
&=-\frac{c_{i,n}(2i-1)}{4}P\left(M(B_{2i:2n}) \gt u\right),
\end{align*}
where  $c_{i,n}=\frac{\binom{2i-2}{i-1}\binom{2n-2i}{n-i}}{\binom{2n-1}{n-1}}$,
 $M(p)=w_1(Q(p))r\left(Q(p)\right)$ and
 $r(x)$ denote the reverse failure rate function of
 $X$. It is clear that
 $L_{Q_{i:n}}^{w_1}(u)$ is increasing in
 $u$.
Theorem 6.  $L_{Q_{i:n}}^{w_1}(u)$ is increasing in
 $u$.
Proof. The quantile-based weighted residual extropy of the  $i$-th order statistic is given by
 \begin{equation*}
L^{w_1}_{Q_{i:n}}(u)
=
-\frac{1}{2}
\int_u^1
w_1(Q(p))
\frac{(n!)^2}{((i-1)!)^2((n-i)!)^2}
p^{2i-2}(1-p)^{2n-2i}
(q(p))^{-1}
\, dp.
\end{equation*}
Let
 \begin{equation*}
C_{i,n}
=
\frac{(n!)^2}{((i-1)!)^2((n-i)!)^2}.
\end{equation*}
Define
 \begin{equation*}
g(p)
=
w_1(Q(p)) C_{i,n}
p^{2i-2}(1-p)^{2n-2i}
(q(p))^{-1}.
\end{equation*}
Since  $w_1(Q(p)) \ge 0$,
 $q(p) \gt 0$, and the beta-type term
 $p^{2i-2}(1-p)^{2n-2i} \ge 0$, we have
 \begin{equation*}
g(p) \ge 0 \quad \text{for } p\in(0,1).
\end{equation*}
Thus,
 \begin{equation*}
L^{w_1}_{Q_{i:n}}(u)
=
-\frac{1}{2}
\int_u^1 g(p)\, dp.
\end{equation*}
Now differentiate with respect to  $u$ using Leibniz rule:
 \begin{equation*}
\frac{d}{du} L^{w_1}_{Q_{i:n}}(u)
=
-\frac{1}{2} \frac{d}{du}
\left( \int_u^1 g(p)\, dp \right).
\end{equation*}
Since
 \begin{equation*}
\frac{d}{du} \int_u^1 g(p)\, dp
=
- g(u),
\end{equation*}
we obtain
 \begin{equation*}
\frac{d}{du} L^{w_1}_{Q_{i:n}}(u)
=
-\frac{1}{2}(-g(u))
=
\frac{1}{2} g(u).
\end{equation*}
Because  $g(u) \ge 0$, it follows that
 \begin{equation*}
\frac{d}{du} L^{w_1}_{Q_{i:n}}(u) \ge 0.
\end{equation*}
Therefore,
 \begin{equation*}
L^{w_1}_{Q_{i:n}}(u)
\text{ is increasing in } u.
\end{equation*}
This completes the proof.
The above theorem gives the correct general version of Theorem 17 of Krishnan et al. [Reference Krishnan, Sunoj and Sankaran25]. The following example justifies the above theorem and works as a counterexample to Theorem 17 of Krishnan et al. [Reference Krishnan, Sunoj and Sankaran25]. The following example shows that when  $X$ has a decreasing density quantile function
 $f(Q(u))$, then
 $L_{Q_{1:n}}^{w_1}(u)$ may not be decreasing in
 $u\in(0,1)$.
Example 2. Consider power-Pareto  $(c=\lambda_1=\lambda_2=1)$ distribution having quantile function
 $Q(u)=\frac{u}{1-u}$ and
 $w(x)=F(x)$, that is,
 $L_{Q_{i:n}}^{w_1}(u)=L_{Q_{i:n}}^{(1)}(u)=L_{Q_{i:n}}(u)$. Then the density quantile function
 $f(Q(u))=(1-u)^2$ is decreasing in
 $u\in (0,1)$. Now consider
 \begin{align*}
L_{Q_{1:2}}(u)&=-\frac{4}{2(1-u)^4}\int_{u}^{1}(1-p)^2(1-p)^2dp\\
&=-\frac{2}{5}(1-u).
\end{align*}
Note that  $L_{Q_{1:2}}(1/4)=-(6/20) \lt L_{Q_{1:2}}(1/2)=-(4/20)$ which is not decreasing in
 $u$.
4. Weighted cumulative residual extropy
In this section, we discuss weighted cumulative residual extropy using the distribution function and quantile approach. Weighted cumulative residual extropy of non-negative random variable  $X$ with weight
 $w_1$ is given by
 \begin{equation}
\xi^{w_1}(X)=-\frac{1}{2}\int_{0}^{\infty} w_1(x) \bar F^2(x)dx.
\end{equation}
The quantile version of Eq. (17) is
 \begin{equation}
\xi^{w_1}(X)=-\frac{1}{2}\int_{0}^{1}w_1\left(Q(p)\right) (1-p)^2q(p)dp.
\end{equation}
The weighted cumulative residual extropy of the random variable  $X_t$ with weight
 $w_1$ is given by
 \begin{equation}
\Phi^{w_1}(X_t)=-\frac{1}{2}\int_{t}^{u_X}w_1(x) \left( \frac{\bar F^2(x)}{\bar F^2(t)}\right)dx.
\end{equation}
The quantile version of Eq. (19) is
 \begin{equation}
\Phi_Q^{w_1}(u)=-\frac{1}{2(1-u)^2}\int_{u}^{1}w_1\left(Q(p)\right) (1-p)^2q(p)dp.
\end{equation}
Differentiating the above equation with respect to  $u$, we have
 \begin{equation}
q(u)=\frac{1}{w_1(Q(u))}\left(2(\Phi_Q^{w_1}(u))^{\prime}-\frac{4\Phi_Q^{w_1}(u)}{(1-u)}\right).
\end{equation}
Theorem 7. Let  $X$ and
 $Y$ be non-negative random variables. Further let
 $w_1$ is decreasing,
 $w_1(x)\leq w_2(x)$ and
 $X\leq_{disp}Y$, then
 $\Phi_{Q_X}^{w_1}(u)\geq \Phi_{Q_Y}^{w_2}(u)$.
Proof. Since  $X\le_{disp} Y$, therefore we have
 $q_Y(u)\ge q_X(u)$ for
 $u \in (0,1)$. Then, using Theorem 3.B.13(b) of Shaked and Shanthikumar [Reference Soni, Dewan and Jain38],
 $X\le_{disp} Y$ implies that
 $X\ge_{st} Y$. Hence
 $Q_X(u) \ge Q_Y(u)$ for all
 $u\in (0,1)$. Since
 $w_1$ is decreasing and
 $w_1(x)\leq w_2(x)$, then
 $w_1(Q_X(u)) \le w_1(Q_Y(u))\le w_2(Q_Y(u))$. Hence
 \begin{align}
w_2(Q_Y(u))q_Y(u) \geq w_1(Q_X(u))q_X(u)
\Rightarrow
\int_u^1 w_2(Q_Y(p))q_Y(p)(1-p)^2\,dp
\geq
\int_u^1 w_1(Q_X(p))q_X(p)(1-p)^2\,dp
\Rightarrow
\Phi_{Q_X}^{w_1}(u) \geq \Phi_{Q_Y}^{w_2}(u).
\end{align}
Hence the result.
Remark 1. Let  $X$ be a non-negative absolutely continuous random variable with survival function
 $\bar{F}(x)$, and let
 $w(x) \geq 0$ for all
 $x \geq 0$. Then the weighted cumulative residual extropy
 \begin{equation*}
\xi_w(X) = -\frac{1}{2} \int_{S_X} w(x)\, \bar{F}^2(x)\, dx \leq 0.
\end{equation*}
Example 3. Let  $X \sim \text{Exponential}(\lambda)$ and choose
 $w(x) = 1$. Then
 $\bar{F}(x) = e^{-\lambda x}$ and:
 \begin{equation*}
\xi_w(X) = -\frac{1}{2} \int_0^\infty e^{-2\lambda x} dx = -\frac{1}{2} \cdot \frac{1}{2\lambda} = -\frac{1}{4\lambda}.
\end{equation*}
Theorem 8. Let  $X$ be a non-negative continuous random variable with quantile function
 $Q(u)$ and quantile density
 $q(u) = \frac{dQ(u)}{du}$. Then the quantile-based weighted cumulative residual extropy is given by
 \begin{equation*}
\xi^w(X) = -\frac{1}{2} \int_0^1 w(Q(u))\, (1 - u)^2\, q(u)\, du.
\end{equation*}
Proof. Using the change of variable  $x = Q(u)$ and
 $dx = q(u)\, du$, and noting that
 $\bar{F}(Q(u)) = 1 - u$, we substitute into the definition of
 $\xi^w(X)$,
 \begin{equation*}
\xi^w(X) = -\frac{1}{2} \int_0^\infty w(x) \bar{F}^2(x)\, dx = -\frac{1}{2} \int_0^1 w(Q(u))\, (1 - u)^2\, q(u)\, du.
\end{equation*}
Example 4. Let  $X \sim \text{Uniform}(0,1)$, so
 $Q(u) = u$,
 $q(u) = 1$, and choose
 $w(x) = x$. Then,
 \begin{equation*}
\xi^w(X) = -\frac{1}{2} \int_0^1 u(1 - u)^2\, du = -\frac{1}{2} \cdot \frac{1}{12} = -\frac{1}{24}.
\end{equation*}
Theorem 9. Let  $\Phi^w_{Q}(u) = -\frac{1}{2(1 - u)^2} \int_u^1 w(Q(p)) (1 - p)^2 q(p)\, dp$ be the residual form of WCRE. Then the quantile density function
 $q(u)$ satisfies
 \begin{equation*}
q(u) = \frac{2\, \Phi_Q^{w\,\prime}(u) - \frac{4}{1 - u} \Phi^w_{Q}(u)}{w(Q(u))}.
\end{equation*}
Proof. Differentiate both sides of the definition of 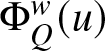 $\Phi^w_{Q}(u)$ with respect to
 $u$ using Leibniz’s rule, and rearranging terms gives us the required expression.
Example 5. Let  $w(x)=1$ and
 $\Phi^w_Q(u)=-\frac14(1-u)^2.$ Then
 $
\Phi_Q^{w\,\prime}(u)=\frac12(1-u).
$ By Theorem 9,
 \begin{equation*}
q(u)
=
2\Phi_Q^{w\,\prime}(u)-\frac{4}{1-u}\Phi^w_Q(u)
=2(1-u).
\end{equation*}
Hence,  $Q(u)=2u-u^2,$ which is the quantile function of
 $ X\sim\operatorname{Beta}\left(1,\frac12\right).$ Thus,
 $q(u)=Q'(u)=2(1-u)$, verifying Theorem 9.
Example 6. Let  $X\sim\mathrm{Uniform}(0,1)$ and
 $w(x)=1$. Then the quantile function and quantile density are
 \begin{equation*}
Q(u)=u,\qquad q(u)=Q'(u)=1,\qquad 0 \lt u \lt 1.
\end{equation*}
From the definition of  $\Phi_Q^w(u)$, we have
 \begin{equation*}
\begin{aligned}
\Phi_Q^w(u)
&=
-\frac{1}{2(1-u)^2}
\int_u^1 (1-p)^2q(p)\,dp=
-\frac{1-u}{6}.
\end{aligned}
\end{equation*}
Therefore,  $\Phi_Q^{w\,\prime}(u)=\frac{1}{6}.$ Now, using the result of Theorem 9,
 \begin{equation*}
\begin{aligned}
q(u)
&=
\frac{
2\Phi_Q^{w\,\prime}(u)
-\dfrac{4}{1-u}\Phi_Q^w(u)
}{
w(Q(u))
}=1.
\end{aligned}
\end{equation*}
On the other hand, directly from the quantile function  $Q(u)=u$, we have
 $ q(u)=Q'(u)=1.$ Thus, both sides agree, verifying Theorem 9.
Theorem 10. Let  $Y = aX$, where
 $a \gt 0$. Then:
 \begin{equation*}
\xi^w(Y) = a \cdot \xi^{w(a\cdot)}(X),
\end{equation*}
where  $w(a\cdot)$ denotes the weight function scaled accordingly.
Proof. We know that if  $Y = aX$, then
 $Q_Y(u) = a Q_X(u)$ and
 $q_Y(u) = a q_X(u)$. Then:
 \begin{equation*}
\xi^w(Y) = -\frac{1}{2} \int_0^1 w(Q_Y(u)) (1 - u)^2 q_Y(u)\, du = -\frac{1}{2} \int_0^1 w(a Q_X(u)) (1 - u)^2 a q_X(u)\, du = a \xi^{w(a\cdot)}(X).
\end{equation*}
Example 7. Let  $X \sim \text{Uniform}(0,1)$ and
 $Y = 2X$, so
 $Q_X(u) = u$,
 $Q_Y(u) = 2u$, and
 $w(x) = x$. Then:
 \begin{equation*}
\xi^w(Y) = 2 \cdot \xi_{w(2x)}(X) = 2 \cdot \left(-\frac{1}{2} \int_0^1 2u (1 - u)^2\, du\right) = 2 \cdot \left(-\frac{1}{2} \cdot \frac{1}{6} \right) = -\frac{1}{6}.
\end{equation*}
Theorem 11. Let  $X$ and
 $Y$ be two non-negative continuous random variables with hazard quantile functions
 $H_X(u)$ and
 $H_Y(u)$, respectively. If
 $H_X(u) \geq H_Y(u)$ for all
 $u \in (0,1)$, and
 $w(\cdot)$ is non-decreasing, then:
 \begin{equation*}
\Phi^w_{Q}(X) \geq \Phi^w_{Q}(Y).
\end{equation*}
Proof. Recall that
 \begin{equation*}
\Phi^w_{Q}(u) = -\frac{1}{2(1 - u)^2} \int_u^1 w(Q(p)) (1 - p)^2 q(p)\, dp.
\end{equation*}
From the definition of the hazard quantile function:
 \begin{equation*}
H(u) = \frac{1}{(1 - u) q(u)} \Rightarrow q(u) = \frac{1}{(1 - u) H(u)}.
\end{equation*}
Hence, larger  $H(u)$ implies smaller
 $q(u)$ and thus a smaller integrand inside
 $\Phi^w_{Q}(u)$, since
 $q(p)$ appears multiplied with
 $w(Q(p))(1 - p)^2$ (which is non-negative). Since the integrand carries a minus sign. Therefore,
 $\Phi^w_{Q}(X) \geq \Phi^w_{Q}(Y)$.
Example 8. Let  $X \sim \text{Exp}(1)$ and
 $Y \sim \text{Exp}(0.5)$. Then
 $H_X(u) = 1$,
 $H_Y(u) = 0.5$, so
 $H_X(u) \gt H_Y(u)$. Taking
 $w(x) = 1$, we get:
 \begin{equation*}
\Phi_Q(X) = -\frac{1}{2} \int_0^1 (1 - u)^2 q(u)\, du.
\end{equation*}
For the exponential case,  $q(u) = \frac{1}{\lambda(1 - u)}$, so
 \begin{equation*}
\Phi_Q(X) = -\frac{1}{2\lambda} \int_0^1 (1 - u)\, du = -\frac{1}{4\lambda}.
\end{equation*}
Thus
 \begin{equation*}
\Phi_Q(X) = -\frac{1}{4}, \quad \Phi_Q(Y) = -\frac{1}{2}, \quad \Rightarrow \Phi_Q(X) \gt \Phi_Q(Y).
\end{equation*}
Definition 3. (Krishnan et al. [Reference Krishnan, Sunoj and Sankaran25])
Let  $X$ be a random variable with cumulative residual quantile extropy
 $\Phi_Q(u)$. We say that
 $X$ has increasing (decreasing) cumulative residual quantile extropy, abbreviated as ICRQE (DCRQE), if
 $\Phi_Q(u)$ is increasing (decreasing) in
 $u$.
The following result extends Theorem 27 of Krishnan et al. [Reference Krishnan, Sunoj and Sankaran25] to the weighted setting.
Theorem 12. Let  $M(u)$ denote the mean residual quantile function. If
 $X$ has increasing cumulative residual quantile extropy (ICRQE) and
 $w(.)\geq 0 $ is a non-decreasing function, then
 \begin{equation*}
\Phi^w_Q(u)
\leq
\frac{1}{4}
\left[(1-u)M'(u)-M(u)\right]w(Q(u)),
\qquad 0 \lt u \lt 1.
\end{equation*}
Proof. By Theorem 27 of Krishnan et al. [Reference Krishnan, Sunoj and Sankaran25], if  $X$ has increasing cumulative residual quantile extropy, then
 \begin{equation*}
\Phi_Q(u)
\leq
\frac{1}{4}
\left[(1-u)M'(u)-M(u)\right].
\end{equation*}
On the other hand, by the definition of the weighted cumulative residual quantile extropy,
 \begin{equation*}
\Phi^w_Q(u)
=
-\frac{1}{2(1-u)^2}
\int_u^1 (1-p)^2q(p)w(Q(p))\,dp.
\end{equation*}
Since  $Q(p)$ is non-decreasing and
 $w(\cdot)$ is non-decreasing, we have
 \begin{equation*}
w(Q(p))\geq w(Q(u)),
\qquad p\in[u,1].
\end{equation*}
Furthermore,  $w(Q(u))\geq0$. Hence,
 \begin{equation*}
\begin{aligned}
\Phi^w_Q(u)
&=
-\frac{1}{2(1-u)^2}
\int_u^1 (1-p)^2q(p)w(Q(p))\,dp\\
&\leq
-\frac{w(Q(u))}{2(1-u)^2}
\int_u^1 (1-p)^2q(p)\,dp\\
&=
w(Q(u))\Phi_Q(u).
\end{aligned}
\end{equation*}
Using Theorem 27 of Krishnan et al. [Reference Krishnan, Sunoj and Sankaran25], we therefore obtain
 \begin{equation*}
\begin{aligned}
\Phi^w_Q(u)
&\leq
w(Q(u))
\frac{1}{4}
\left[(1-u)M'(u)-M(u)\right].
\end{aligned}
\end{equation*}
Thus,
 \begin{equation*}
\Phi^w_Q(u)
\leq
\frac{1}{4}
\left[(1-u)M'(u)-M(u)\right]w(Q(u)).\end{equation*}
This completes the proof.
Example 9. Let  $X \sim \text{Exp}(1)$ and
 $w(x) = 1$, so
 $M(u) = 1$,
 $M'(u) = 0$,
 $Q(u) = -\log(1 - u)$ for
 $u\in(0,1)$. Then from Eq. (20),
 $\Phi_Q^{w}(u)=-\frac{1}{2(1-u)^2}\int_{u}^{1}w\left(Q(p)\right) (1-p)^2q(p)dp= -\frac{1}{2(1-u)^2} \int_u^1 (1 - p)^2 \cdot \frac{1}{1 - p} dp = -\frac{1}{4},$ and
 $\frac{1}{4} \left[ (1 - u) M'(u) - M(u) \right] w(Q(u))=-\frac{1}{4}.$ So, the bound of Theorem 12 is satisfied with equality.
Example 10. Let  $X \sim \mathrm{Exp}(1)$ and
 $w(x)=x$, which is non-decreasing. Then
 $Q(u)=-\log(1-u)$,
 $q(u)=1/(1-u)$,
 $M(u)=1$,
 $M'(u)=0$, and
 $w(Q(u))=Q(u)=-\log(1-u)$ for
 $u\in(0,1)$. Let us compute
 \begin{equation*}
\Phi_Q^w(u)
= -\frac{1}{2(1-u)^2}\int_u^1 w(Q(p))(1-p)^2q(p)\,dp.
\end{equation*}
Substituting  $w(Q(p))=-\log(1-p)$ and
 $q(p)=1/(1-p)$ gives
 \begin{equation*}
\Phi_Q^w(u)
= -\frac{1}{2(1-u)^2}\int_u^1 (-\log(1-p))(1-p)\,dp.
\end{equation*}
Let  $a=1-u$ and
 $t=1-p$. Then
 $p=1-t$,
 $dp=-dt$, and when
 $p=u$,
 $t=a$; when
 $p=1$,
 $t=0$. Hence
 \begin{equation*}
\int_u^1 (-\log(1-p))(1-p)\,dp
= \int_0^a (-\log t)t\,dt
= -\int_0^a t\log t\,dt.
\end{equation*}
Using  $\int t\log t\,dt = \frac{t^2}{2}\log t - \frac{t^2}{4}$, we get
 \begin{equation*}
\int_0^a t\log t\,dt = \frac{a^2}{2}\log a - \frac{a^2}{4}.
\end{equation*}
Thus
 \begin{equation*}
\int_u^1 (-\log(1-p))(1-p)\,dp
= -\frac{a^2}{2}\log a + \frac{a^2}{4}.
\end{equation*}
Substituting back gives
 \begin{equation*}
\Phi_Q^w(u)
= -\frac{1}{2a^2}\left(-\frac{a^2}{2}\log a + \frac{a^2}{4}\right)
= \frac{1}{4}\log a - \frac{1}{8}
= \frac{1}{4}\log(1-u) - \frac{1}{8}.
\end{equation*}
Now, let us compute
 \begin{equation*}
\frac{1}{4}\big[(1-u)M'(u)-M(u)\big]w(Q(u))
= \frac{1}{4}(-1)\cdot [-\log(1-u)]
= \frac{1}{4}\log(1-u).
\end{equation*}
Clearly,
 \begin{equation*}
\Phi_Q^w(u) = \frac{1}{4}\log(1-u) - \frac{1}{8}
\;\le\; \frac{1}{4}\log(1-u),
\end{equation*}
because  $-\frac{1}{8} \lt 0$. Therefore, the upper bound is satisfied strictly for all
 $u\in(0,1)$.
Theorem 13. Let  $X$ be a non-negative continuous random variable and
 $w(Q(u))=a \gt 0,\ 0 \lt u \lt 1.$ Then,
 $\Phi^w_{Q}(u) = c, \quad \text{for all } u \in (0,1)$ for some constant
 $c \lt 0$, if and only if
 $X$ has an exponential distribution.
Proof. We know from Theorem 9,
 \begin{equation*}
q(u) = \frac{2\Phi_Q^{w\,\prime}(u) - \frac{4}{1 - u} \Phi^w_{Q}(u)}{w(Q(u))}.
\end{equation*}
If  $\Phi^w_{Q}(u) = c$ is constant, then
 $\Phi_Q^{w\,\prime}(u) = 0$, and
 \begin{equation*}
q(u) = -\frac{4c}{(1 - u) w(Q(u))} = - \frac{4c}{a(1 - u)} \Rightarrow Q(u) = \frac{4c}{a} \log(1 - u).
\end{equation*}
Then  $X$ has an exponential distribution with mean
 $\frac{-4c}{a}.$
Conversely, suppose that  $X\sim\operatorname{Exp}(\lambda)$ with mean
 $\lambda \gt 0$. Then
 \begin{equation*}
Q(u)=-\lambda\log(1-u),
\qquad
q(u)=\frac{\lambda}{1-u}.
\end{equation*}
Since  $w(Q(u))=a$,
 \begin{equation*}
\begin{aligned}
\Phi_Q^w(u)
&=
-\frac{a}{2(1-u)^2}
\int_u^1(1-p)^2
\frac{\lambda}{1-p}\,dp= -\frac{a\lambda}{4},
\end{aligned}
\end{equation*}
which is constant in  $u$. Hence,
 $\Phi_Q^w(u)=c=-\frac{a\lambda}{4}.$ Thus, the result follows.
Example 11. Let  $X\sim\operatorname{Exp}(1)$ and
 $w(x)=1$. Then
 \begin{equation*} Q(u)=-\log(1-u), \ q(u)=Q'(u)=\frac{1}{1-u}.\end{equation*}
Hence,
 \begin{equation*}
\begin{aligned}
\Phi_Q^w(u)
&=-\frac{1}{2(1-u)^2}
\int_u^1 (1-p)^2q(p)\,dp\\
&=-\frac{1}{2(1-u)^2}
\int_u^1(1-p)\,dp=-\frac14.
\end{aligned}
\end{equation*}
Thus,  $\Phi_Q^w(u)=c=-1/4$ is constant. Conversely, using Theorem 13,
 \begin{equation*}
q(u)
=
-\frac{4c}{(1-u)w(Q(u))}
=
\frac{1}{1-u},
\end{equation*}
which gives
 \begin{equation*}
Q(u)=\int_0^u\frac{1}{1-t}\,dt=-\log(1-u).
\end{equation*}
Therefore,  $X\sim\operatorname{Exp}(1)$, verifying Theorem 13.
5. Estimation of quantile-based weighted extropy
Recent developments have highlighted the growing importance of extropy-based and quantile-based information measures in reliability and lifetime-data analysis. In particular, Irshad et al. [Reference Irshad, Archana, Maya and Longobardi19] considered estimation of weighted extropy, Chakraborty and Pradhan [Reference Chakraborty and Pradhan10, Reference Chakraborty and Pradhan11] studied cumulative residual extropy and its estimation in reliability systems, Alrewely and Kayid [Reference Alrewely and Kayid5] investigated extropy measures for consecutive  $r$-out-of-
 $n$:G systems, and Abdul Sathar and Vijayan [Reference Abdul Sathar and Vijayan2] developed a quantile-based approach to cumulative residual extropy of record values. Nonparametric estimation of quantile density functions has also been studied by Falk [Reference Falk14], Soni et al. [Reference Soni, Dewan and Jain38], Yang et al. [Reference Yang, Hutson and Wang41], and Kayal and Balakrishnan [Reference Kayal and Balakrishnan21]. These developments motivate the estimation of the proposed quantile-based weighted extropy directly from observed data.
Let  $X_1,X_2,\ldots,X_n$ be a random sample from a non-negative absolutely continuous random variable
 $X$ having distribution function
 $F$, quantile function
 \begin{equation*}
Q(u)=F^{-1}(u), \qquad 0 \lt u \lt 1,
\end{equation*}
and quantile density function
 \begin{equation*}
q(u)=Q'(u).
\end{equation*}
Recall that the quantile-based weighted extropy is defined by
 \begin{equation}
L^{w}(X)
=
-\frac{1}{2}
\int_0^1
\frac{w(Q(u))}{q(u)}\,du.
\end{equation}
For the particular weight function
 \begin{equation*}
w(x)=\{F(x)\}^{\alpha-1}, \qquad \alpha \gt 0,
\end{equation*}
we have  $w(Q(u))=u^{\alpha-1}$, and hence
 \begin{equation}
L^{(\alpha)}(X)
=
-\frac{1}{2}
\int_0^1
\frac{u^{\alpha-1}}{q(u)}\,du.
\end{equation}
Thus, nonparametric estimation of  $L^{(\alpha)}(X)$ essentially reduces to estimation of the quantile density function
 $q(u)$.
5.1. Empirical spacing-based estimator
Let
 \begin{equation*}
X_{(1)}\leq X_{(2)}\leq\cdots\leq X_{(n)}
\end{equation*}
denote the order statistics corresponding to  $X_1,\ldots,X_n$, and consider the quantile levels
 \begin{equation}
u_j=\frac{j-\frac{1}{2}}{n},
\qquad j=1,2,\ldots,n.
\end{equation}
A simple empirical approximation to the quantile density function can be constructed from consecutive order-statistic spacings. For a non-negative random variable, taking  $X_{(0)}=0$, define
 \begin{equation}
\widehat q(u_j)
=
n\left(X_{(j)}-X_{(j-1)}\right).
\end{equation}
Using the midpoint approximation to the integral in (24), the corresponding empirical estimator is
 \begin{equation}
\widehat L^{(\alpha)}(X)
=
-\frac{1}{2n}
\sum_{j=1}^{n}
\left(\frac{j-\frac{1}{2}}{n}\right)^{\alpha-1}
\left[
n\left(X_{(j)}-X_{(j-1)}\right)
\right]^{-1}.
\end{equation}
The estimator in (27) is straightforward to calculate. However, it involves reciprocals of individual spacings and may therefore be sensitive to very small differences between consecutive order statistics. Consequently, substantial finite-sample bias and variability may occur, particularly for skewed and heavy-tailed distributions.
5.2. Smoothed
$k$-spacing estimator

To reduce the instability associated with individual spacings, we consider an averaged spacing over a window of  $k=k_n$ order statistics. For
 $j=1,2,\ldots,n-k$, define
 \begin{equation}
\widehat q_k(u_j)
=
\frac{n}{k}
\left(X_{(j+k)}-X_{(j)}\right).
\end{equation}
The corresponding smoothed estimator of  $L^{(\alpha)}(X)$ is defined as
 \begin{equation}
\widehat L_S^{(\alpha)}(X)
=
-\frac{1}{2(n-k)}
\sum_{j=1}^{n-k}
\left(\frac{j-\frac{1}{2}}{n}\right)^{\alpha-1}
\left[\widehat q_k(u_j)\right]^{-1}.
\end{equation}
Compared with (27), the estimator in (29) uses information from several neighboring order statistics and is therefore less sensitive to exceptionally small individual spacings.
A standard asymptotic choice of the window size satisfies
 \begin{equation*}
k=k_n\longrightarrow\infty,
\qquad
\frac{k_n}{n}\longrightarrow0,
\qquad n\longrightarrow\infty.
\end{equation*}
For numerical implementation, we use the practical choice
 \begin{equation}
k=\lfloor\sqrt{n}\rfloor.
\end{equation}
This choice provides a simple compromise between local variability and excessive smoothing.
5.3. Regularized
$k$-spacing estimator

Although smoothing substantially reduces the effect of small individual spacings, an estimated quantile density may still become small in finite samples. To improve numerical stability, we introduce the regularized quantile-density estimator
 \begin{equation}
\widetilde q_k(u_j)
=
\widehat q_k(u_j)+\epsilon_n,
\end{equation}
where  $\epsilon_n \gt 0$ and
 $\epsilon_n\rightarrow0$ as
 $n\rightarrow\infty$.
The resulting regularized estimator is
 \begin{equation}
\widehat L_R^{(\alpha)}(X)
=
-\frac{1}{2(n-k)}
\sum_{j=1}^{n-k}
\left(\frac{j-\frac{1}{2}}{n}\right)^{\alpha-1}
\left[\widetilde q_k(u_j)\right]^{-1}.
\end{equation}
The regularization term prevents division by values of  $\widehat q_k(u_j)$ that are very close to zero and thereby improves numerical stability. In the numerical analysis below, we take
 \begin{equation}
\epsilon_n=\frac{0.1}{n}.
\end{equation}
5.4. Simulation study
We now investigate the finite-sample performance of the proposed estimators. For illustration, we consider  $\alpha=2$, so that
 \begin{equation}
L^{(2)}(X)
=
-\frac{1}{2}\int_0^1\frac{u}{q(u)}\,du.
\end{equation}
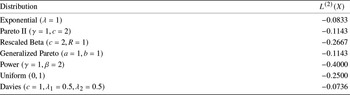
The theoretical values of  $L^{(2)}(X)$ for the selected distributions are in Table 3, and are considered for the simulation studies in Tables 4–8.
Theoretical values of  $L^{(2)}(X)$ for selected distributions.

Table 3 Long description
Two columns list distribution names and their L second values. Exponential with lambda 1 has minus 0.0833. Pareto two with gamma 1 and c 2 has minus 0.1143, and generalized Pareto with a 1 and b 1 also has minus 0.1143. Rescaled Beta with c 2 and R 1 has minus 0.2667. Uniform from 0 to 1 has minus 0.2500. Davies with c 1, lambda one 0.5, and lambda two 0.5 has minus 0.0736.
Simulation results for the adjacent-spacing estimator for the Uniform  $(0,1)$ distribution.

Table 4 Long description
Simulation results are listed by sample size n, with columns for Mean, Variance, Bias, and MSE. For n 10, mean is minus 0.275166, variance 0.001391, bias minus 0.025166, and MSE 0.002023. For n 30, mean is minus 0.258220, variance 0.000321, bias minus 0.008220, and MSE 0.000389. For n 50, mean is minus 0.255097, variance 0.000183, bias minus 0.005097, and MSE 0.000209. For n 100, mean is minus 0.252576, variance 0.000100, bias minus 0.002576, and MSE 0.000106. For n 500, mean is minus 0.250541, variance 0.000018, bias minus 0.000541, and MSE 0.000018.
Simulation results for the adjacent-spacing estimator for the Exponential  $(\lambda=1)$ distribution.

Table 5 Long description
Simulation results are listed for an adjacent spacing estimator with columns for n, Mean, Variance, Bias, and MSE. For n 10, Mean is -0.642145, Variance 0.044122, Bias -0.558811, and MSE 0.356348. For n 30, Mean is -0.629870, Variance 0.015506, Bias -0.546537, and MSE 0.314193. For n 50, Mean is -0.619524, Variance 0.008834, Bias -0.536191, and MSE 0.296326. For n 100, Mean is -0.617187, Variance 0.004099, Bias -0.533854, and MSE 0.289095. For n 500, Mean is -0.612111, Variance 0.000851, Bias -0.528778, and MSE 0.280456.
Simulation results for the adjacent-spacing estimator for the Pareto II  $(\gamma=1,c=2)$ distribution.

Table 6 Long description
Simulation results are listed by sample size, n, with columns for Mean, Variance, Bias, and MSE. For n 10, mean is minus 0.748809, variance 1.152113, bias minus 0.665475, and MSE 1.593818. For n 30, mean is minus 0.768190, variance 0.510159, bias minus 0.684857, and MSE 0.978678. For n 50, mean is minus 0.717433, variance 0.140208, bias minus 0.634100, and MSE 0.542151. For n 100, mean is minus 0.745770, variance 0.100381, bias minus 0.662437, and MSE 0.539103. For n 500, mean is minus 0.731222, variance 0.018537, bias minus 0.647889, and MSE 0.438279.
Simulation results for the smoothed  $k$-spacing estimator
 $\widehat L_S^{(2)}(X)$.

Table 7 Long description
Simulation results are reported for three distributions, Uniform, Exponential, and Pareto II, with columns for n, Mean, Variance, Bias, and MSE. For Uniform, n values 10, 30, 50, 100, and 500 have means negative 0.262728, negative 0.260406, negative 0.249993, negative 0.249704, and negative 0.250231; variances 0.013830, 0.002443, 0.000911, 0.000380, and 0.000057; biases negative 0.012728, negative 0.010406, 0.000007, 0.000296, and negative 0.000231; and MSE values 0.013989, 0.002551, 0.000911, 0.000380, and 0.000057. For Exponential, the means are negative 0.096857, negative 0.092502, negative 0.087930, negative 0.086605, and negative 0.085102; variances 0.002985, 0.000584, 0.000259, 0.000116, and 0.000019; biases negative 0.013524, negative 0.009169, negative 0.004597, negative 0.003272, and negative 0.001768; and MSE values 0.003168, 0.000668, 0.000280, 0.000127, and 0.000022. For Pareto II, the means are negative 0.132937, negative 0.123069, negative 0.118248, negative 0.116731, and negative 0.115517; variances 0.011896, 0.001520, 0.000804, 0.000338, and 0.000062; biases negative 0.018651, negative 0.008784, negative 0.003962, negative 0.002446, and negative 0.001231; and MSE values 0.012242, 0.001597, 0.000819, 0.000344, and 0.000064. Across all three distributions, variance and MSE decrease as n increases from 10 to 500, while the mean values change more gradually within each distribution.
Simulation results for the regularized  $k$-spacing estimator
 $\widehat L_R^{(2)}(X)$.

Table 8 Long description
Simulation results are reported for three distributions, Uniform, Exponential, and Pareto II, with columns for n, Mean, Variance, Bias, and MSE. For Uniform, Mean is minus 0.256164 at n 10 and minus 0.250176 at n 500; Variance drops from 0.011130 to 0.000057, Bias ranges from minus 0.009010 to 0.000686, and MSE drops from 0.011166 to 0.000057. For Exponential, Mean is minus 0.095668 at n 10 and minus 0.085092 at n 500; Variance drops from 0.002720 to 0.000019, Bias goes from minus 0.012334 to minus 0.001759, and MSE drops from 0.002871 to 0.000022. For Pareto II, Mean is minus 0.129133 at n 10 and minus 0.115496 at n 500; Variance drops from 0.008069 to 0.000062, Bias goes from minus 0.014848 to minus 0.001210, and MSE drops from 0.008287 to 0.000064. At n 100, Variance is 0.000378 for Uniform, 0.000116 for Exponential, and 0.000337 for Pareto II, with corresponding MSE values 0.000378, 0.000126, and 0.000342. Values are listed for n 10, 30, 50, 100, and 500 for each distribution.
To examine the behavior of the estimators, Monte Carlo simulations are performed for different sample sizes. For each distribution and each sample size,  $B$ independent random samples are generated. If
 $\widehat L_b^{(2)}$ denotes the estimate obtained from the
 $b$th replication, the empirical mean, variance, bias, and mean squared error (MSE) are calculated as
 \begin{equation}
\operatorname{Mean}
=
\frac{1}{B}
\sum_{b=1}^{B}\widehat L_b^{(2)},
\end{equation}
 \begin{equation}
\operatorname{Variance}
=
\frac{1}{B-1}
\sum_{b=1}^{B}
\left(
\widehat L_b^{(2)}
-\overline{\widehat L}^{(2)}
\right)^2,
\end{equation}
 \begin{equation}
\operatorname{Bias}
=
\frac{1}{B}
\sum_{b=1}^{B}\widehat L_b^{(2)}
-
L^{(2)}(X),
\end{equation}
 \begin{equation}
\operatorname{MSE}
=
\frac{1}{B}
\sum_{b=1}^{B}
\left(
\widehat L_b^{(2)}-L^{(2)}(X)
\right)^2.
\end{equation}
We first examine the behavior of the ordinary adjacent-spacing estimator in (27). The results for the Uniform, Exponential, and Pareto II distributions are presented below.
The results reveal an important limitation of the estimator based on individual spacings. For the Uniform distribution, both the bias and MSE decrease as  $n$ increases. In contrast, substantial bias persists for the Exponential and Pareto II distributions even for relatively large sample sizes. This behavior is mainly caused by the reciprocal of individual order-statistic spacings, since a small spacing can make a disproportionately large contribution to the estimator. This observation motivates the use of the smoothed estimator
 $\widehat L_S^{(2)}(X)$ and the regularized estimator
 $\widehat L_R^{(2)}(X)$. To assess their finite-sample performance, the simulation experiment is repeated for
 $
n=10, 30, 50, 100, \text{and }500,$ using
 $
k=\lfloor\sqrt n\rfloor\ \text{and}\ \epsilon_n=\frac{0.1}{n}.
$
For each distribution and sample size,  $B=5000$ independent Monte Carlo samples are generated. The empirical mean, variance, bias, and MSE of
 $\ \widehat L_S^{(2)}(X)$ and
 $\ \widehat L_R^{(2)}(X)$ are computed in the same manner as above.
The simulation results demonstrate that the smoothed and regularized  $k$-spacing estimators substantially improve the finite-sample performance of the adjacent-spacing estimator. In general, the bias, variance, and MSE decrease as the sample size increases, with particularly notable improvements for the Exponential and Pareto II distributions. The smoothed and regularized estimators yield similar results for moderate and large sample sizes, while regularization provides additional stability for smaller samples.
Overall, the results support the use of the  $k$-spacing estimators for reliable estimation of quantile-based weighted extropy. These estimators are subsequently applied to the real lifetime datasets in Section 6, using the same choices of
 $k$ and
 $\epsilon_n$.
6. Real data applications
In this section, we illustrate the practical applicability of the proposed quantile-based weighted extropy using three real lifetime datasets arising in reliability studies. The analysis is carried out using the nonparametric estimators introduced in Section 5.
Throughout this section, we take  $\alpha=2$. First, we compute the adjacent-spacing estimator
 \begin{equation}
\widehat{L}^{(2)}(X)
=
-\frac{1}{2n}
\sum_{j=1}^{n}
u_j
\left[
n\left(X_{(j)}-X_{(j-1)}\right)
\right]^{-1},
\end{equation}
where
 \begin{equation*}
u_j=\frac{j-0.5}{n}.
\end{equation*}
Since the simulation study indicates that the estimator based on individual spacings may be sensitive to very small spacings, we also use the smoothed  $k$-spacing estimator
 \begin{equation}
\widehat{L}^{(2)}_S(X)
=
-\frac{1}{2(n-k)}
\sum_{j=1}^{n-k}
u_j
\left[
\frac{n}{k}
\left(X_{(j+k)}-X_{(j)}\right)
\right]^{-1},
\end{equation}
where  $k=\lfloor\sqrt{n}\rfloor$.
For completeness, the regularized estimator
 \begin{equation}
\widehat{L}^{(2)}_{R}(X)
=
-\frac{1}{2(n-k)}
\sum_{j=1}^{n-k}
u_j
\left[
\frac{n}{k}
\left(X_{(j+k)}-X_{(j)}\right)
+\epsilon_n
\right]^{-1}
\end{equation}
is also considered, with  $\epsilon_n=0.1/n$.
6.1. Dataset 1: Failure times of electric carts
The first dataset consists of the times to first failure, measured in months, for 20 small electric carts. These data were originally reported by Zimmer et al. [Reference Zimmer, Keats and Wang43] and subsequently analyzed by Krishnan et al. [Reference Krishnan, Sunoj and Sankaran25]. The observations are
 \begin{equation*}
\begin{array}{rrrrrrrrrr}
0.9&1.5&2.3&3.2&3.9&5.0&6.2&7.5&8.3&10.4\\
11.1&12.6&15.0&16.3&19.3&22.6&24.8&31.5&38.1&53.0.
\end{array}
\end{equation*}
For this dataset,  $n=20$ and hence
 $k=\lfloor\sqrt{20}\rfloor=4$. Application of the three estimators gives
 \begin{equation*}
\widehat L^{(2)}(X)=-0.006865,
\end{equation*}
 \begin{equation*}
\widehat L_S^{(2)}(X)=-0.004888,
\qquad
\widehat L_{R}^{(2)}(X)=-0.004888.
\end{equation*}
The value obtained from the adjacent-spacing estimator agrees with the value reported earlier in the manuscript. The smoothed estimate is slightly smaller in magnitude, reflecting the reduction in the influence of unusually small individual spacings. Moreover, the smoothed and regularized estimates are almost identical, indicating that the  $k$-spacing procedure itself provides adequate numerical stability for these data.
6.2. Dataset 2: Bearing cage failure times
The second dataset consists of failure times, measured in millions of revolutions, of 23 bearing cages from a high-speed textile machine. These data were reported by Lieblein and Zelen [Reference Lieblein and Zelen27]:
 \begin{equation*}
\begin{array}{rrrrrrrr}
0.14&0.22&0.24&0.27&0.32&0.33&0.35&0.37\\
0.38&0.42&0.45&0.47&0.49&0.52&0.54&0.58\\
0.62&0.67&0.73&0.81&0.89&1.01&1.23&
\end{array}
\end{equation*}
Here  $n=23$, so that
 $k=\lfloor\sqrt{23}\rfloor=4$. We obtain
 \begin{equation*}
\widehat L^{(2)}(X)=-0.314632,
\end{equation*}
while the smoothed and regularized estimates are
 \begin{equation*}
\widehat L_S^{(2)}(X)=-0.243395,
\qquad
\widehat L_{R}^{(2)}(X)=-0.241840.
\end{equation*}
The difference between the adjacent-spacing and smoothed estimates is more pronounced for this dataset. This may be attributed to the presence of several relatively small spacings among the ordered failure times. Since the estimator involves reciprocals of spacings, such observations can have a substantial effect on the unsmoothed estimate. The  $k$-spacing estimator reduces this sensitivity by combining information from several consecutive order statistics.
Again, the regularized estimate is close to the smoothed estimate, suggesting that the  $k$-spacing approximation provides sufficient stabilization for the present dataset.
6.3. Dataset 3: Failure times of electrical cables
The third dataset consists of the failure times, measured in hours, of 50 electrical cables under accelerated voltage stress originally reported by Meeker and Escobar [Reference Meeker and Escobar29]. The observations are
 \begin{equation*}
\begin{array}{rrrrrrrrrr}
1.1&1.9&2.2&2.5&2.8&3.2&3.5&4.0&4.3&5.0\\
5.2&5.7&6.1&6.5&7.0&7.6&8.2&8.8&9.5&10.3\\
11.0&11.8&12.6&13.5&14.3&15.2&16.1&17.0&18.0&19.2\\
20.5&21.8&23.1&24.5&26.0&27.6&29.3&31.0&32.8&34.7\\
36.7&38.8&41.0&43.3&45.7&48.2&50.8&53.5&56.3&59.2.
\end{array}
\end{equation*}
For this dataset, 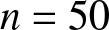 $n=50$ and
 $k=\lfloor\sqrt{50}\rfloor=7$. The estimates are
 \begin{equation*}
\widehat L^{(2)}(X)=-0.004509,
\end{equation*}
 \begin{equation*}
\widehat L_S^{(2)}(X)=-0.003703,
\qquad
\widehat L_{R}^{(2)}(X)=-0.003702.
\end{equation*}
As in the electric-cart example, the smoothed and regularized estimators are nearly identical. The adjacent-spacing estimator is somewhat larger in magnitude, which is consistent with the sensitivity of the reciprocal-spacing estimator to local variation in consecutive failure times.
6.4. Comparison of the empirical estimates
For convenience, the estimates obtained from the three datasets are summarized in Table 9. The real-data analyses demonstrate the practical applicability of the proposed quantile-based weighted extropy. The estimator based on individual adjacent spacings is more sensitive to local variations, whereas the  $k$-spacing estimator provides smoother and more stable estimates by combining consecutive spacings. The small differences between
 $\widehat L_S^{(2)}$ and
 $\widehat L_R^{(2)}$ further indicate that regularization has only a minor effect once smoothing is applied. Moreover, these estimators are straightforward to implement using observed order statistics without assuming a specific parametric distribution. The weighting scheme
 $u^{\alpha-1}$ provides additional flexibility over classical unweighted extropy, making the proposed approach a useful nonparametric tool for uncertainty quantification in lifetime and reliability analysis.
Estimated quantile-based weighted extropy for the three reliability datasets ( $\alpha=2$).

Table 9 Long description
Quantile based weighted extropy estimates are listed for three datasets, alongside n, k, and three estimated measures labeled L hat squared, L hat S squared, and L hat R squared. Electric carts reports n 20 and k 4, with values minus 0.006865, minus 0.004888, and minus 0.004888. Bearing cages reports n 23 and k 4, with values minus 0.314632, minus 0.243395, and minus 0.241840. Electrical cables reports n 50 and k 7, with values minus 0.004509, minus 0.003703, and minus 0.003702. For each dataset, the L hat squared value is more negative than the corresponding L hat S squared and L hat R squared values. L hat S squared and L hat R squared are identical for Electric carts and differ slightly for Bearing cages and Electrical cables.
7. Conclusion
In this paper, we introduced and studied quantile-based weighted extropy and its residual version as extensions of existing quantile-based extropy measures. By incorporating a non-negative weight function depending on the quantile, the proposed measures account for the magnitude of observations and provide a flexible framework for uncertainty quantification in reliability and lifetime analysis. Several theoretical properties of the proposed measures were established, including analytical expressions for important lifetime distributions, monotonicity and ordering results, characterization results based on quantile density and hazard quantile functions, and extensions to order statistics. In particular, the residual weighted extropy provides a differential characterization of the underlying quantile density. The proposed weighted measure can also distinguish distributions having the same classical extropy, demonstrating its additional discriminatory ability. Furthermore, nonparametric estimators based on order-statistic spacings were considered, and their applicability was illustrated through simulation studies and real lifetime datasets.
Overall, the proposed framework extends quantile-based extropy by incorporating value-dependent weighting and provides useful theoretical and empirical tools for reliability analysis. Future research may focus on establishing the asymptotic properties of the proposed estimators, developing data-driven procedures for selecting the smoothing parameter, and exploring applications in reliability engineering, survival analysis, insurance, and risk analysis.
Acknowledgments
The authors thank the reviewers, associate editor, and editor for their insightful comments, which significantly improved this manuscript.
Funding statement
P.K.S. would like to thank the Quality Improvement Program (QIP), All India Council for Technical Education, Government of India (Student Unique ID: FP2200759) for financial assistance.
Conflict of interest
No conflicts of interest are disclosed by the authors.




 Open access

