INTRODUCTION
Brazil is the largest producer of maize in the world and the total area occupied by summer and winter maize is currently around 17 million ha, with an average annual yield of 5.3 Mg ha−1. During the last few years, the agricultural sector has faced the challenge of producing more food with less water by increasing crop-water productivity. Matching water supply and demand can contribute to meeting this challenge and can enhance productivity and sustainability of any irrigation scheme. With regard to maize, recent studies have shown that in well-managed crops grain yield and biomass production increased by up to 350% and 50%, respectively (Djaman et al., Reference Djaman, Irmak, Rathje, Martin and Eisenhauer2013; Irmak et al., Reference Irmak, Djaman and Rudnick2016). Climate change and variability (Carvalho et al., Reference Carvalho, Assad, Evangelista and Pinto2013) have also presented challenges for maize growers, mainly during the winter season (usually sown from January to March), which is now responsible for 28% of Brazilian total crop production (CONAB, 2017).
Currently, only 10% of the total irrigated area in Brazil is allocated to maize production. However, an impressive growth in the area of crops irrigated in Brazil has been noticed during the last decade, increasing at a rate of 7% of the total maize cultivation area each year (ANA, 2016). However, despite the improvement in technologies for water supply, irrigation management is inadequate in most areas because of the lack of basic information about water requirement; this may limit expansion of the irrigated areas (González et al., Reference González, Ramos, Carlesso, Paredes, Petry, Martins, Aires and Pereira2015; Marin et al., Reference Marin, Angelocci, Nassif, Costa, Vianna and Carvalho2016). Normally, the large amount of water applied exceeds crop requirements, wasting water and energy and making irrigation techniques a nonbeneficial use of water (Pereira et al., Reference Pereira, Cordery and Iacovides2012).
One useful method for assessing the consumptive water use by irrigated crops is using the crop coefficient-reference evapotranspiration (Kc–ETo) approach. In this procedure, ETo is computed for a reference crop and multiplied by an empirical crop coefficient (Kc) to generate an estimate of crop evapotranspiration (ETc; Allen et al., Reference Allen, Pereira, Raes and Smith1998). This approach has been universally adopted as a procedure for planning and quantifying the amount of water to be applied in the field and has been supported by data over the years; however, the data frequently indicate the need for systematic improvement (Rosa et al., Reference Rosa, Paredes, Rodrigues, Fernando, Alves, Pereira and Allen2012; Taylor et al., Reference Taylor, Mahohoma, Vahrmeijer, Gush, Allen and Annandale2015). Previous studies have shown that Kcs for citrus orchards, coffee and sugarcane crops (Marin et al., Reference Marin, Angelocci, Righi and Sentelhas2005; Marin and Angelocci, Reference Marin and Angelocci2011; Marin et al., Reference Marin, Angelocci, Nassif, Costa, Vianna and Carvalho2016; Nassif et al., Reference Nassif, Marin and Costa2014) have changed as a function of ETo as a consequence of species physiology, planting arrangements and transpiration coupling to the atmosphere. Based on this, Marin et al. (Reference Marin, Angelocci, Nassif, Costa, Vianna and Carvalho2016) suggested that studies should focus on ETc responses to weather under highly canopy-atmosphere coupled crops of economic importance.
In this study, we measured evapotranspiration of an irrigated maize crop in two experiments in Southern Brazil to derive the Kc values and to evaluate how the degree of canopy-atmosphere coupling affects crop water requirements and irrigation management.
MATERIAL AND METHODS
The experiment was conducted in an experimental area at “Luiz de Queiroz” College of Agriculture (ESALQ), University of São Paulo (USP), Piracicaba, São Paulo State, Brazil (22°42ʹS; 47°30ʹW; 546 m a.s.l.). Winter (Exp. 1) and summer (Exp. 2) maize crops were grown from May to September 2016 and from October 2016 to March 2017, respectively. According to Köppen's classification, the local climate is Cwa (high-altitude tropical climate), with rainy summers, dry winters and annual temperature and precipitation averages of 22 °C and 1280 mm, respectively. Both experiments were irrigated using a centre pivot method. The irrigation frequency and amount of water was scheduled based on an agrometeorological water balance model that ensured soil moisture content which exceeded 80% of field capacity and prevented formation of a shallow root system that would lead to a water supply insufficient to match atmospheric demand. The effective root depth was assumed to be 0.7 m. In winter, the 3-ha experiment field (a Chromic Acrisol) was planted with hybrid P4285YH at a spacing of 0.28 × 0.45 m. In summer, a 0.05-ha experimental field (a Eutric Rhodic Ferralic Nitisol) was planted with the same hybrid at the same density.
ETc was determined during the growing season by the surface energy balance using the Bowen ratio (β) method, based on vertical differences in air temperature (∆T) and vapour pressure (∆eS). The reliability of the method was tested following Perez et al. (Reference Perez, Ibanez and Rosell1999), as this method can show some measurement variation. When the measurements had such variability exceeding 2 hours, these periods were discarded and interpolations for gap filling were conducted. Also, data for the whole day were discarded when periods of such undesirable variability exceeded 2 hours.
A Bowen ratio system was installed in the centre of both experimental areas. The system measured the following weather variables: surface radiation balance (Rn) (REBS Inc., model Q7.1-L); soil heat flux (G) (REBS Inc., model HFT3-L), measured at two points 0.05 m below ground; and vertical gradients of air temperature and partial vapour pressure (Vaisala Inc., model HMP155), measured 0.80 m between the sensors and 0.20 m above the canopy. Data were recorded daily at 10-s intervals and stored as 15-min averages by a data logger (Campbell Scientific, Inc., model CR7). Equations (1)–(3) were used to estimate ETc as follows:
 $$\begin{equation}
{e_S} & = & \left( {0.6108{\rm{ }}{e^{\frac{{17.3T}}{{237.3T}}}}} \right){\rm{RH,}}
\end{equation}$$\\
 $$\begin{equation}
\beta & = & \gamma \frac{{\Delta T}}{{\Delta {e_S}}},
\end{equation}$$\\
 $$\begin{equation}
{\rm{ETc}} & = & \frac{{{\rm{Rn}} - G}}{{\lambda \left( {1 + \beta } \right)}},
\end{equation}$$
Daily ETo was estimated based on the Penman–Monteith equation as parameterized by Allen et al. (Reference Allen, Pereira, Raes and Smith1998), using weather data collected from an automatic standard weather station (Campbell Scientific, Inc., model CR1000) located near the experimental field.
Diurnal courses of leaf diffusive resistance (rS) were determined during 2 and 3 days in the vegetative and grain filling stages, respectively, with a cycling porometer (Delta-T. Inc., model AP4). The rS was measured in three exposed leaves from three different plants from 09h00 to 17h00 (local time). Mean rS values were used to compute the decoupling factor (Ω) for a hypostomatous leaf, which was defined by Equation (4) as described by McNaughton and Jarvis (Reference McNaughton, Jarvis and Koslowski1983). The bulk aerodynamic resistance (ra) was calculated by Equation (5) (Jones, Reference Jones1992).
 $$\begin{equation}
\Omega & = & 1/\left\{ {1 + \left[ {\gamma /\left( {s + \gamma } \right).{{\bf r}_S}/{{\bf r}_a}} \right]} \right\},
\end{equation}$$\\
 $$\begin{equation}
{{\bf r}_a} & = & {\left\{ {\ln \left[ {\left( {z - d} \right)/{z_0}} \right]} \right\}^2}/u.{k^2},
\end{equation}$$
Conceptually, Ω can be interpreted by the analysis of its extreme values. As Ω tends to unity (Ω→1 as rS/ra→0), this means that the net radiation is the only contributor to the evapotranspiration process and the crop is considered to be decoupled from the atmospheric conditions. If Ω tends to zero (Ω→0 as rS/ra→∞), this indicates the complete coupling of the crop to the atmosphere, that is, the evapotranspiration process is greatly influenced by the vapour pressure deficit (VPD) and the wind speed (McNaughton and Jarvis, Reference McNaughton, Jarvis and Koslowski1983).
RESULTS
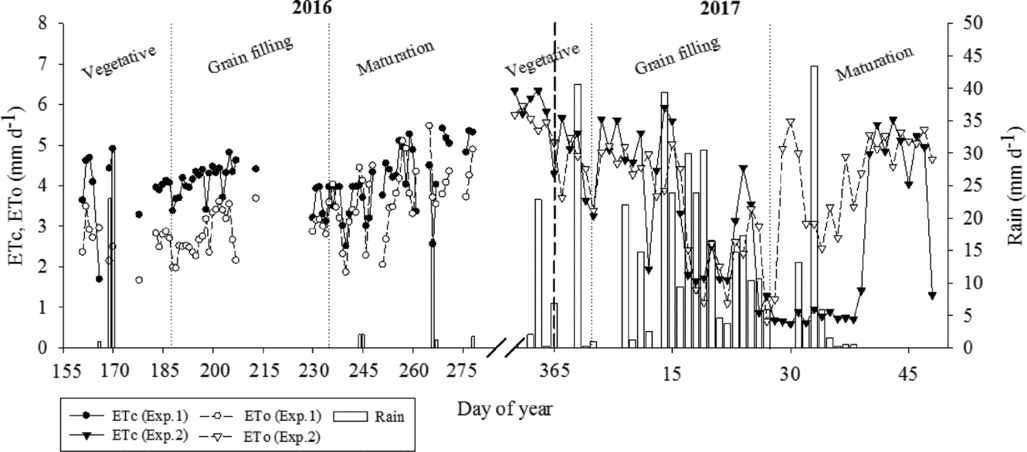
Figure 1 shows the daily variation of ETc and ETo throughout the two well-irrigated experiments, with some gaps due to failures in the measurement system. In both experiments, irrigation was managed to meet the crop water requirements. Based on the water balance and the possibility of water uptake from deeper layers, evapotranspiration in both crops was nonlimited, ensuring maximum ETc rates. During the winter maize crop (Exp. 1), ETc was usually higher than ETo, with average values of 4.18 ± 0.48 and 3.20 ± 0.83 mm d−1, respectively. These values are due to the availability of water associated with a high atmospheric demand from the prevailing dry air mass, with temperatures ranging from 19 to 35 °C and mean air relative humidity lower than 67%. ETc reached a peak of 5.4 mm d−1 and remained above 4 mm d−1 during a 50-day period (70% of total length) of Exp. 1.
Daily variation of winter (Exp.1) and summer (Exp.2) maize evapotranspiration (ETc), reference evapotranspiration (ETo), and measured rainfall (Rain) throughout the experimental period.

With regard to the summer maize experiment (Exp. 2), average values of ETc and ETo were 4.01 ± 0.42 and 3.53 ± 1.21 mm d−1, respectively. ETc was only lower than ETo from the end of January until the middle of February, a period in which the atmospheric demand was relatively low due to higher relative air humidity (>80%) and average air temperature of 25 °C (Figure 1). For the remaining period of Exp. 2, both ETc and ETo were high due to high air temperature and solar radiation. Under these conditions, ETc reached a peak level of 6.2 mm d−1 and was above 4.0 mm d−1 during a 32-day period (55% of total length) of Exp. 2.
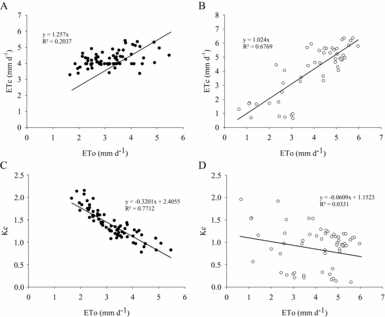
As shown in Figure 2A and B, the ratio between ETc and ETo represents the Kc value and it is determined from the slope of the straight line forced to pass through the origin. Over the period of Exp. 1, the mean value of ETo was 78% of ETc, resulting in an average Kc of 1.31 ± 0.32 (ranging from 0.57 to 2.15). For summer maize, the mean value of ETc was 87% of ETo, which resulted in a Kc value of 0.90 ± 0.45 (ranging from 0.11 to 1.62) across the entire period of Exp. 2. The results also suggest that Kc decreases under high ETo in both seasons (Figure 2C and D), mainly due to the decrease in transpiration.
Maize evapotranspiration (ETc, A and B) and crop coefficient (Kc, C and D) as function of reference evapotranspiration (ETo) during the winter (A and C) and summer (B and D) seasons.

DISCUSSION
The summer Kc value compared well with other Kc values reported for humid climates (Allen et al., Reference Allen, Pereira, Raes and Smith1998; Doorenbos and Pruitt, Reference Doorenbos and Pruitt1977; Facchi et al., Reference Facchi, Gharsallah, Corbari, Masseroni, Mancini and Gandolfi2013; Kang et al., Reference Kang, Gu, Du and Zhang2003; Piccinni et al., Reference Piccinni, Ko, Marek and Howell2009). For dry periods, such as during the winter in Southern Brazil, the Kc value was 14 and 9% higher than those reported by Doorenbos and Pruitt (Reference Doorenbos and Pruitt1977) and Allen et al. (Reference Allen, Pereira, Raes and Smith1998), respectively. The decrease in Kc with ETo (Figure 2C and D) is a consequence of the highly coupled plant–atmosphere conditions, as previously reported by Marin et al. (Reference Marin, Angelocci, Righi and Sentelhas2005), Marin and Angelocci (Reference Marin and Angelocci2011) and Nassif et al. (Reference Nassif, Marin and Costa2014) for coffee, citrus and sugarcane crops, respectively. The relationship between Kc and ETo seems to be weaker in summer than in winter maize (Figure 2C and D) because of the higher data dispersion observed during summer season, and the relatively stability of ETc in relation to ETo during the winter, which reflects the weak agreement of plant transpiration to evapotranspiration process.
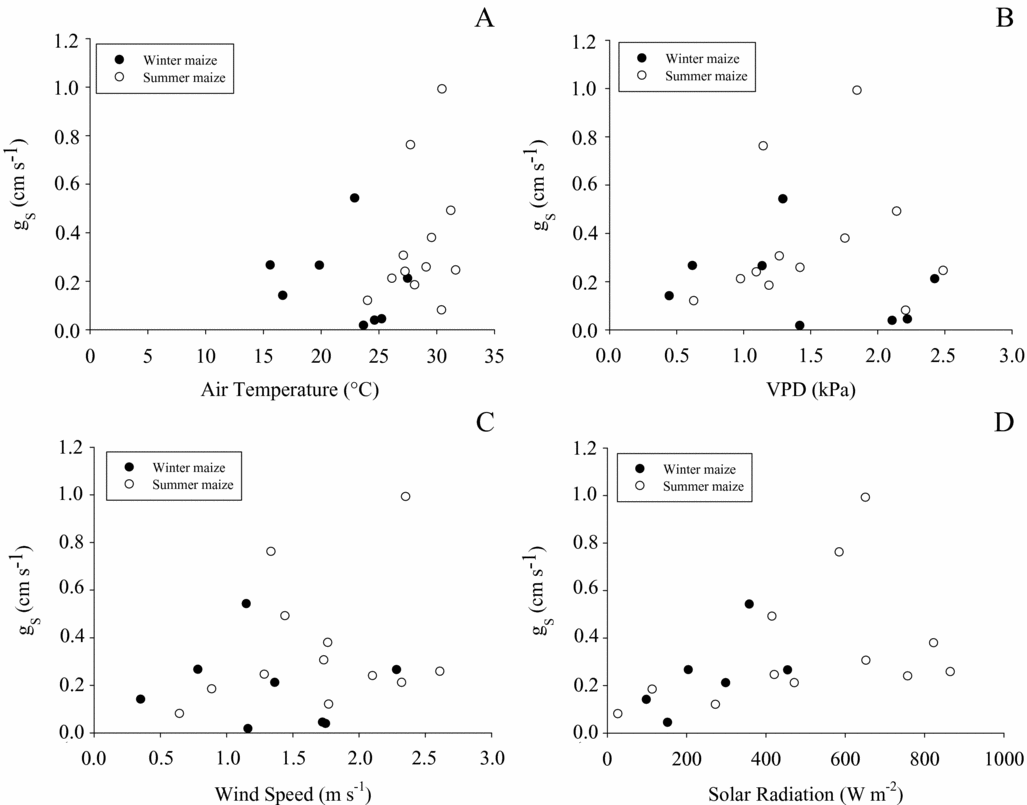
It is well-known that crop leaf diffusion conductance (gS) responds in a nonlinear manner to air temperature, wind speed, air VPD and solar radiation. In such a way, gS reaches a maximum value with some optimum values for these weather variables, rapidly decreasing when the atmosphere demands high evapotranspiration rates (Choudhury, Reference Choudhury1983; Tardieu et al., Reference Tardieu, Zhang and Gowing1993; Turner, Reference Turner1968; Turner, Reference Turner1974). Denmead and Shaw (Reference Denmead and Shaw1962) and Hirasawa and Hsiao (Reference Hirasawa and Hsiao1999) reported that with high atmospheric demand for water, even with high soil water content, the relationship between leaf diffusion conductance and environmental variables demonstrated that leaves restrict water loss, mainly through stomatal closure. Therefore, the relationship between ETc and ETo for the two experiments seems to be due to an increase of inner resistance to water transport in plants when subjected to conditions of high atmospheric demand for water due to an opposing tendency for transpiration and stomatal movement in relation to increased free-air VPD (McNaughton and Jarvis, Reference McNaughton, Jarvis and Koslowski1983). Based on the relationship among gs and weather variables (Figure 3), we selected 23 °C, 1.3 kPa, 1.15 m s−1 and 360 W m−2, respectively for air temperature, VPD, wind speed and solar radiation as corresponding values for the highest gs , for winter maize. Using these values to estimate ETo (Allen et al., Reference Allen, Pereira, Raes and Smith1998), a daily rate of 5.5 mm d−1 was reported. With regard to summer maize, we found values of 30 °C, 1.8 kPa, 2.3 m s−1 and 650 W m−2 for those variables, which resulted in an ETo of 10 mm d−1. These estimations were based on the assumption that net radiation was 50% of solar radiation. Despite the poor correlations and the high gS variability, we can notice that gS decreases when the atmospheric demand is high, corroborating the hypothesis that plants control transpiration as ETo increases, which could support the use of different Kc values for discrete ETo ranges.
Relationship between hourly maize leaf diffusion conductance (gS) and air temperature (A), vapour pressure deficit (VPD, B), wind speed (C) and solar radiation (D).

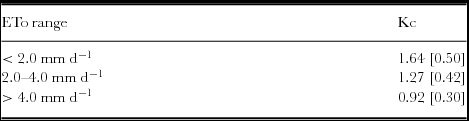
Based on this, we proposed values for Kc in different ETo ranges for the two experiments (Table 1). As previously mentioned, Kc values decreased as ETo values increased, which may present an interesting way of improving water management in extensively irrigated maize fields. By comparing the Kc values for ETo < 2 and ETo > 4 mm d−1, crop water requirements decreased by 44% (Table 1).
Crop coefficient (Kc) and ranges of reference evapotranspiration (ETo) for winter and summer maize crops. Values in parentheses represent the standard deviation.

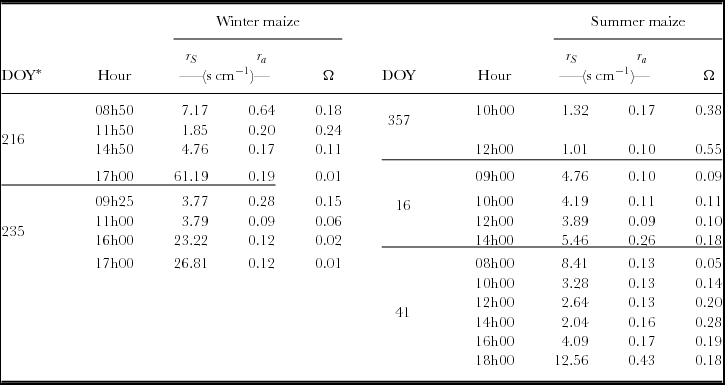
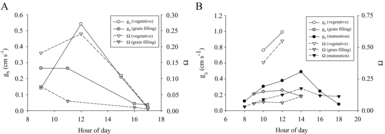
The decoupling factor (Ω) was calculated using aerodynamic and canopy resistance data collected during the experimental period (Table 2). Due to the increase of aerodynamic resistance or stomatal closure, Ω tends to be higher in vegetation with less roughness because of an increase in the aerodynamic resistance of the canopy. As a result of this, mean Ω values were 0.09 and 0.20 for winter and summer maize, respectively, supporting the idea that there is coupling with the atmosphere conditions. This indicates that crop transpiration is influenced by aerodynamic conditions, such as wind speed and VPD, instead of radiation, imposing a trend of larger rates of ETc (Table 2). gS values lower than canopy boundary layer conductance (the inverse of bulk aerodynamic resistance – ra) mean that stomata act as the dominant controller of water loss, and a decrease in gS would result in a nearly proportionate decrease in transpiration (Figure 4). According to Martin et al. (Reference Martin, Hinckley, Meinzer and Sprugel1999), vegetation in this state has a Ω value near 0 and is well-coupled.
Stomatal resistance (rS), bulk aerodynamic resistance (ra) and decoupling factor (Ω) for winter and summer maize crops.

*DOY = day of year with porometric measurements.
Hourly variation of measured leaf diffusion conductance (gS) and decoupling factor (Ω) in winter (A) and summer (B) maize.

Allen et al. (Reference Allen, Pereira, Raes and Smith1998) claimed that Kc values must be used under standard climatic conditions (sub-humid climate, minimum relative humidity of 45% and wind speeds averaging 2 m s−1) and that variations in wind speed may alter aerodynamic resistance and, hence, Kcs. They also pointed out that Kc tends to increase under conditions of high wind speed and low relative humidity. However, maize crops were slightly different from those postulated by Allen et al. (Reference Allen, Pereira, Raes and Smith1998). First, we noted that high VPD, wind speed and air temperature tended to restrict maize transpiration and changing Kc as ETo varied. Second, we measured ETc throughout two irrigated maize cycles to update Kc values specifically for Brazilian cultivars and discuss water requirements, which takes into account the role of Ω in maize irrigation management. Irrigation management based on conventional Kc values, such as those postulated by Allen et al. (Reference Allen, Pereira, Raes and Smith1998), may lead to crop water requirement higher than necessary. This is because a high Kc value may be used when considering the crop phenological phase, which does not take into account the agronomic, biometrics and ecophysiology aspects of crops, such as the atmosphere-coupling (i.e., disregarding the ETo variation). Consequently, reliable estimation of ETc enables the development of and appropriate irrigation schedule and determination of the correct amount of water to be applied in field conditions.
Herein, the canopy was mostly coupled to the atmosphere, which corroborates previous results for other crops under the same environmental conditions. Considering this coupled canopy-atmosphere relationship, Kc varied inversely as a function of ETo. Therefore, we propose that the maize Kc recommendation for practical purposes should be a function of ETo.
Acknowledgements
We thank FAPESP (2014/50023-0, 2014/12406-4, 2016/17008-2, 2016/06363-6, 2017/20925-0,) and CNPq (301424/2015, 401662/2016) for fellowships granted and for financial support of this research.