1 Introduction
Item response theoretic (IRT) models are now standard tools for measurement tasks in political science across substantive domains including survey research (e.g., Caughey and Warshaw Reference Caughey and Warshaw2015; Treier and Hillygus Reference Treier and Hillygus2009), courts (e.g., Bafumi et al. Reference Bafumi, Gelman, Park and Kaplan2005; Martin and Quinn Reference Martin and Quinn2002), legislators (e.g., Clinton, Jackman, and Rivers Reference Clinton, Jackman and Rivers2004; Jackman Reference Jackman2001), international bodies (Bailey, Strezhnev, and Voeten Reference Bailey, Strezhnev and Voeten2017), democratic institutions (e.g., Treier and Jackman Reference Treier and Jackman2008), and more (e.g., Quinn Reference Quinn2004). However, a common problem with these models is that individuals can respond to some survey item or roll-call vote in an identical fashion while having differing motivations. Two survey respondents may indicate that they “strongly disagree” with an item, but do so for opposite reasons. Both liberal and conservative justices may dissent from the same Supreme Court decision, but provide ideologically contradictory rationales. Moreover, in legislative settings, ideological opposites may join together to oppose moderate legislation in pursuit of antithetical goals.
When this happens, and it often does, standard models can produce estimates for latent traits that are misleading or just wrong (e.g., Spirling and McLean Reference Spirling and McLean2007). This is because IRT models—as well as related techniques (e.g., Poole Reference Poole2000; Tahk Reference Tahk2018)—assume that response functions are monotonic. Monotonicity means that the probability of any given response must be increasing (or decreasing) as a function of the latent space.Footnote 1 More concretely, the probability of choosing “strongly disagree” should be associated with individuals who are either high or low on the latent trait, but not both. If two justices vote the same way on a case, monotonicity implies that they share a common ideological motivation. Furthermore, if a member of Congress often votes with conservative Republicans, monotonicity assumes that it must be because she is a conservative. In short, monotonicity assumes that similar observed responses also have similar motivations—an assumption not always consonant with the true data-generating process.
In this article, we introduce a modification to traditional IRT models that allows for “ends against the middle” behavior while recovering near identical estimates as standard IRT models when such behavior is absent. The method, the generalized graded unfolding model (GGUM), was first proposed by Roberts, Donoghue, and Laughlin (Reference Roberts, Donoghue and Laughlin2000) to accommodate moderate survey items. We introduce the method to political science, develop a novel estimation method that outperforms existing algorithms in the GGUM literature, and provide an open-source R package, bggum, for applied scholars (Duck-Mayr and Montgomery Reference Duck-Mayr and Montgomery2020). We apply the model to survey data, voting data from the U.S. Supreme Court, and roll calls from the 116th Congress, and show that it outperforms standard IRT models in important settings and can provide superior measures of latent constructs.
In the next section, we provide a basic intuition about the GGUM and then contextualize it within the constellation of existing measurement models. We then present the GGUM and provide a novel parameter estimation method, Metropolis-coupled Markov chain Monte Carlo (MC3), which significantly outperforms existing routines for estimating the GGUM model (e.g., de la Torre, Stark, and Chernyshenko Reference de la Torre, Stark and Chernyshenko2006) in terms of accuracy and convergence to the proper posterior. We then test the robustness of the method via simulation. We show that MC3-GGUM gives essentially identical estimates as standard scaling methods in the absence of ends against the middle responses. We also address the potential (but incorrect) criticism that the MC3-GGUM is simply picking up on a second dimension and provide a brief discussion of the advantages and disadvantages of our approach relative to standard IRT models. Finally, we apply MC3-GGUM to survey responses as well as voting data in two settings. We conclude with a discussion of future directions for this research as well as the substantive interpretation of the resulting estimates.
2 Ends Against the Middle
For over four decades, political methodologists have worked to accurately measure latent traits for voters, legislators, and other political elites based on categorical responses. The broad goal is to take a large amount of data (e.g., survey responses or roll calls) and reduce it to a low-dimensional representation of some latent concept.
After gaining wide acceptance in the 1990s and 2000s, this work expanded to accommodate dynamics (Bailey Reference Bailey2007; Martin and Quinn Reference Martin and Quinn2002), ordered responses (Treier and Jackman Reference Treier and Jackman2008), nominal data (Goplerud Reference Goplerud2019), and bridging institutions (Shor and McCarty Reference Shor and McCarty2011) and voters (Caughey and Warshaw Reference Caughey and Warshaw2015). Methodologically, approaches span the spectrum of statistical philosophies including Bayesian inference (Jackman Reference Jackman2001), parametric (Poole and Rosenthal Reference Poole and Rosenthal1985), and nonparametric models (Duck-Mayr, Garnett, and Montgomery Reference Duck-Mayr, Garnett, Montgomery, Peters and Sontag2020; Poole Reference Poole2000; Tahk Reference Tahk2018). As data sources expanded, researchers incorporated more kinds of evidence including social media activity (Barbará Reference Barbará2015), campaign giving (Bonica Reference Bonica2013), and word choice (Kim, Londregan, and Ratkovic Reference Kim, Londregan and Ratkovic2018; Lauderdale and Clark Reference Lauderdale and Clark2014).
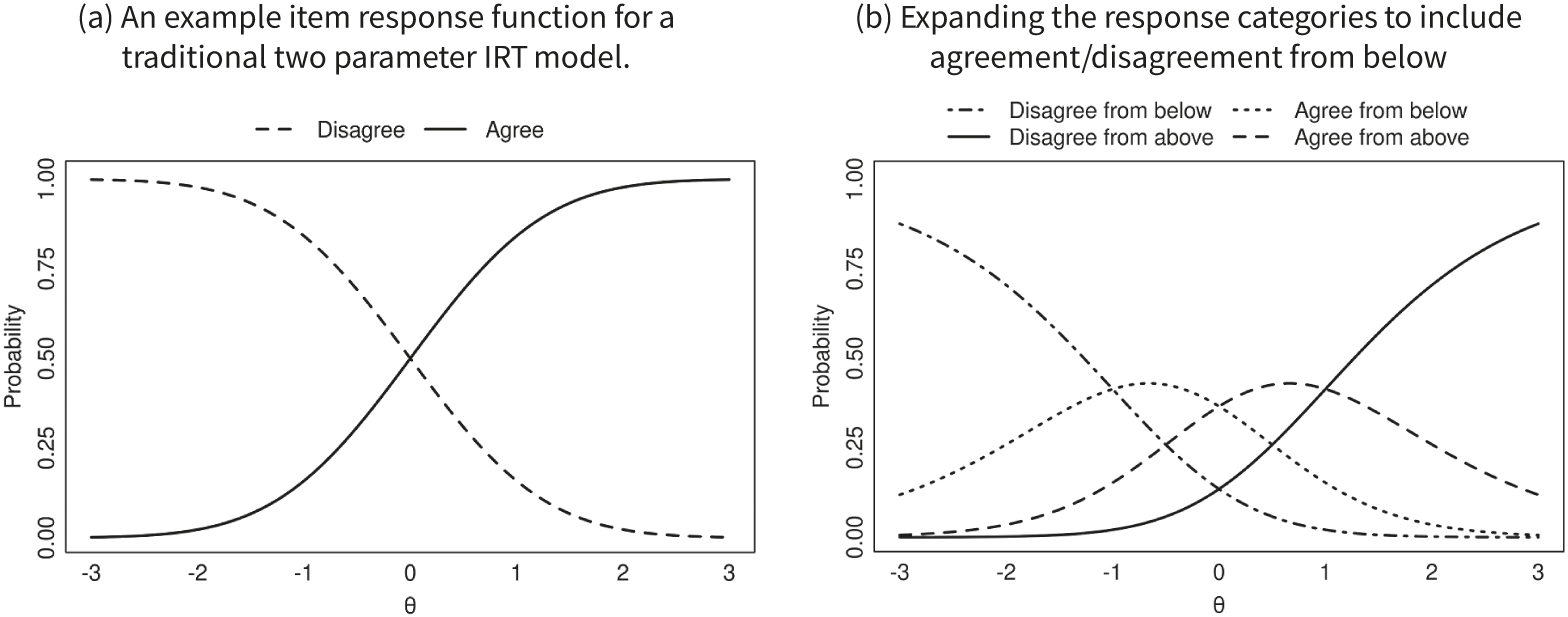
The GGUM fits into this dizzying array of methods by providing an unfolding model designed for use with categorical data. To understand this intuitively, consider a survey respondent asked to indicate her support or disapproval for a set of survey items. Most survey items ask respondents about extreme statements. For instance, in a battery measuring immigration attitude, we might ask respondents if they agree or disagree with the statement, “All undocumented immigrants currently living in the United States should be required to return to their home country.” For this item, responses are unambiguous; agreement indicates a more conservative position on immigration. We would thus expect to see response patterns like Figure 1a, where the probability of an “agree” response increases monotonically from liberal (left) to conservative (right).
Example response functions linking standard IRT model to the GGUM.

However, for some kinds of questions, the meaning of observed responses can be far from plain. For example, we might ask respondents whether or not they agree with the statement, “I am fine with the current level of enforcement of U.S. immigration laws.” From the analyst’s perspective, question items like this are problematic. We can safely assume that respondents who agree with the statements are probably moderates. But what can we say about individuals who disagree?Footnote 2 Conservatives might reject the status quo on the grounds that we need stronger borders and more aggressive internal enforcement. Liberal respondents, on the other hand, might disagree on the grounds that current enforcement is already too stringent and deportations should be dramatically reduced. Thus, we can get “disagreement from above” and “disagreement from below” such that the same observed response corresponds with opposite rationales. Indeed, as illustrated in Figure 1b, we might think of all respondents as falling into one of four categories: disagreeing from below, agreeing from below, agreeing from above, and disagreeing from above. Here, we are mapping out the probability of each of these four hypothetical responses as a function of ideology.
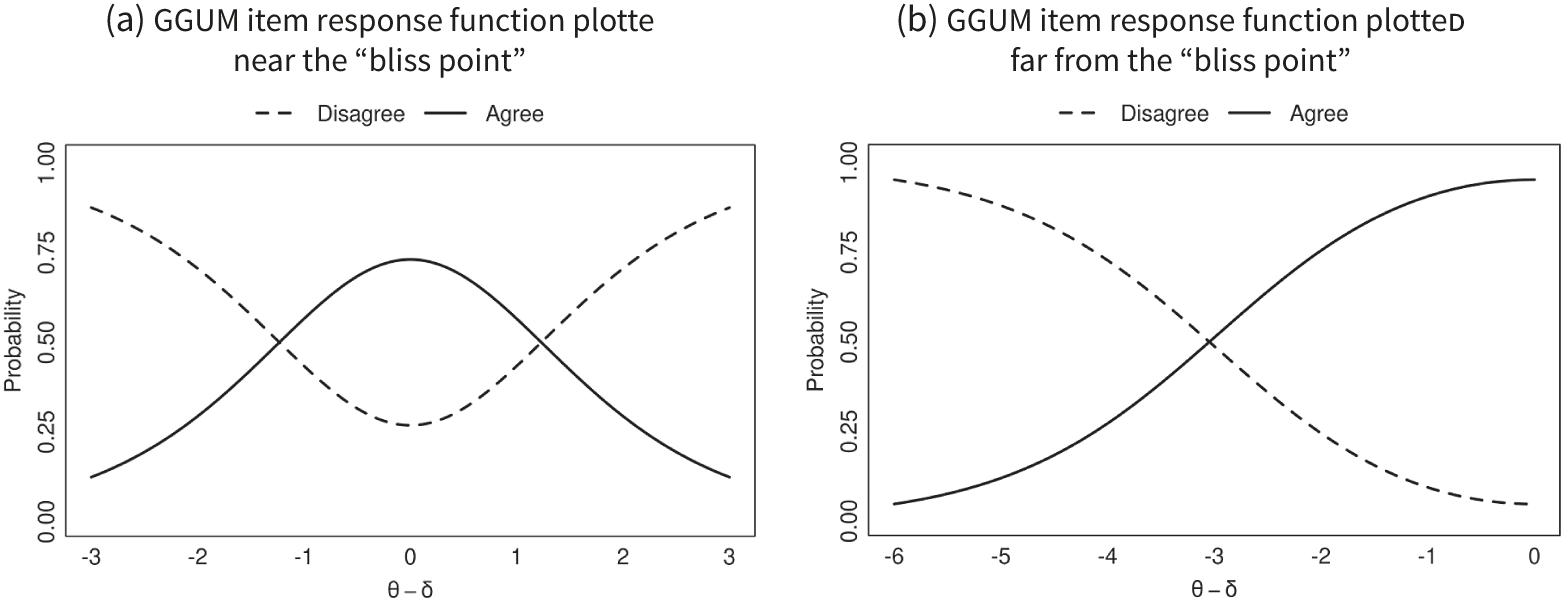
The key intuition of the GGUM is that we can combine these four hypothetical responses into the two observed responses as depicted in Figure 2a.Footnote
3
Here, we see that the probability of agreeing with the item is nonmonotonic and reaches a maximum at the so-called “bliss point,”
 $\delta $
. The closer a respondent’s ideology is to this point, the more likely they are to “agree.” Meanwhile, respondents who are far from this point (whether to the left or to the right) are increasingly likely to disagree.
Example item response functions for the GGUM.

Unfolding models such as the GGUM date back at least to Coombs (Reference Coombs1950) and assume that responses reflect a single-peaked (symmetric) preference function. That is, facing any particular stimuli, respondents prefer options that are “closer” to themselves in the latent space. A common form of data that exhibits this feature is “rating scales,” where respondents are asked to evaluate various politicians, parties, and groups on a 0–100 thermometer. Unfolding models for ratings scales date back to Poole (Reference Poole1984). Indeed, unfolding models generally capture the intuitions and assumptions behind spatial voting (Enelow and Hinich Reference Enelow and Hinich1984), wherein individuals prefer policy options that are closer to their ideal point in policy space. The response function in Figure 2a is an example of a response function consistent with an unfolding model. In this case, it is individuals near
 $\delta $
who are most likely to “agree” and individuals at the most extreme are expected to behave the same (“disagree”) despite being dissimilar on the underlying trait.
Unfolding models stand in contrast to “dominance models,” which are more common in both psychology and political science. Figure 1a provides an example of a monotonic response function common to dominance models (in this case, a two-parameter logistic response model). These models assume that there is a monotonic relationship between the latent trait and observed responses. In Figure 1a, the probability of agreement always increases as respondents’ ideology measure increases. Thus, the least likely individuals to “disagree” are those at the extreme right. Examples of dominance models include factor analysis, Guttman scaling, and the various forms of IRT models discussed above.
One reason many scholars are unaware of the distinction between dominance and unfolding models is that single-peaked preferences, the basis for the unfolding models, result in monotonic response functions consistent with dominance models in one important situation: when individuals with concave (e.g., quadratic) preferences make a choice between two options. A key example of when this equivalence holds is a member of Congress deciding between a proposed policy change and the status quo (Armstrong II et al. Reference Armstrong, Bakker, Carroll, Hare, Poole and Rosenthal2014).Footnote 4
It is for this reason that standard models of roll-call behavior that derived from the unfolding tradition result in monotonic response functions nearly identical to dominance models. So, optimal classification (Poole Reference Poole2000) is motivated theoretically via single-peaked preferences consistent with the unfolding tradition, but assumes monotonicity. Therefore, in our discussion below, we include all models that result in monotonic item response functions as dominance models regardless of their theoretical motivation. We provide additional discussion of the NOMINATE model, which is a special case of an unfolding model based on Gaussian preference functions, in Appendix E of the Supplementary Material.Footnote 5
Thus, the value of the GGUM is in settings where (i) we anticipate single-peaked preferences, but (ii) where actors may not (always) perceive they are choosing between exactly two alternatives and (iii) where responses are categorical. Furthermore, the method will be most appropriate in settings where it is the behavior of extreme individuals who are poorly explained by more traditional dominance models. As in our immigration battery example above, identifying the position of moderates is (relatively) unproblematic. For items with extreme bliss points (as shown in Figure 2b), responses are unambiguous for all respondents and correspond nearly identically to monotonic response functions. (Indeed, as we illustrate below, the GGUM is able to easily accommodate monotonic items by estimating the
 $\delta $
parameters to be relatively extreme.) The ambiguity only arises for moderate items—and the resulting disagreement arises primarily for extreme individuals.
Where in practice might this occur? As already discussed, GGUM might be useful for survey batteries where two-sided disagreement can occur. However, GGUM may also be valuable in studies of political elites where the choice set is not always between two options. For instance, in Supreme Court decision-making, justices are not always presented with a binary choice, but instead can select among several options to either join opinions, join dissents, concur, or write their own opinions. Indeed, it is widely understood that votes relate only to the disposition of the lower court ruling, while justices may be more interested in doctrine. So we observe responses (votes) to either support or oppose the lower court opinion. However, the motivations behind identical votes often do not match up at all—something we know from the written opinions themselves.
Another motivation for GGUM is illustrated by the U.S. House of Representatives. Here, it may seem unneeded given our discussion of the strong link between dominance and unfolding models in legislative voting. However, recent history suggests that members do not always vote in ways consistent with monotonic response functions (cf. Kirkland and Slapin Reference Kirkland and Slapin2019). Members do not seem to be simply comparing the status quo and the proposal before them. Instead, members—especially ideologically extreme members—may refuse to support bills that move the status quo in their direction because they are still “too far” from their ideal point (Slapin et al. Reference Slapin, Kirkland, Lazzaro, Leslie and O’Grady2018).
Finally, a significant portion of the methodological work on latent scaling has focused on the U.S. context characterized by a strong two-party tradition that extends across institutions. In other settings, scholars have noted that models assuming binary agenda setting perform poorly (Spirling and McLean Reference Spirling and McLean2007; Zucco and Lauderdale Reference Zucco and Lauderdale2011). In the online appendix, we therefore also consider the model’s performance in a comparative setting building on the analysis of Mexico’s Instituto Federal Electoral in Estévez, Magar, and Rosas (Reference Estévez, Magar and Rosas2008).
3 MC3-GGUM
More formally, we begin by modeling the full set of “hypothetical” response options as described above. GGUM is itself an extension of the general partial credit model (GPCM) (Bailey et al. Reference Bailey, Strezhnev and Voeten2017; Muraki Reference Muraki1992), which extends the dichotomous IRT models for categorical responses where the order is not known a priori. For respondent
 $i \in \{1, \ldots , n\}$
on item
 $j \in \{1, \ldots , m\}$
, let
 $k^\ast \in \{0, \ldots , K^\ast _j-1\}$
indicate the hypothetical choice set where
 $K^\ast _j$
is the number of hypothetical categories available for item j including, for example, agreeing from above and below.
Specifically, we denote the probability of i choosing option
 $k^\ast $
for item j as
 $P(z_{ij}=k^\ast |\theta _i) = P_{jk^\ast }(\theta _i)$
, where
 $z_{ij}$
are the hypothetical response categories, and
 $$ \begin{align} P_{jk^\ast}(\theta_i) = \frac{\exp (\alpha_j [k^\ast (\theta_i - \delta_j) - \sum_{l=0}^{k^\ast} \tau_{jl}])}{\sum_{{k^\ast}=0}^{{K_j^\ast}-1}\exp (\alpha_j [k^\ast (\theta_i - \delta_j) - \sum_{l=0}^{k^\ast} \tau_{jl}])}.\\[-22pt] \nonumber \end{align} $$
This response probability derives directly from Muraki’s graded response model (GRM). Here,
 $\alpha _j$
is the usual “discrimination” parameter common to IRT model, and indicates the degree to which the item corresponds to the underlying dimension (similar to a factor loading). As described above,
 $\delta _j$
is the “bliss point,” which indicates the point in the latent space around which the item response function will be folded.
Finally, the
 $\tau _{jk}$
parameters determine where the hypothetical response probabilities cross.Footnote
6
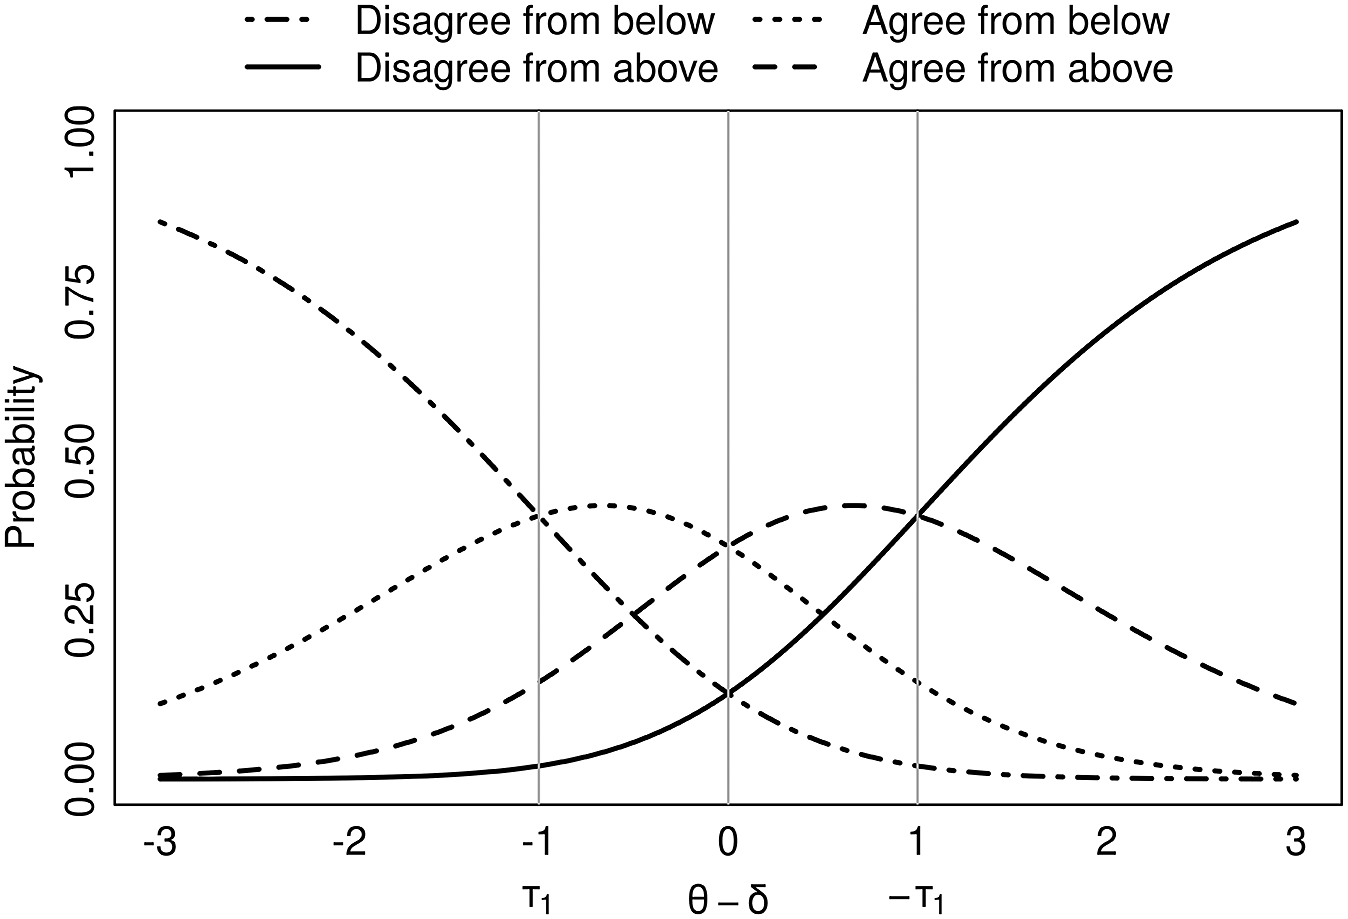
Figure 3 shows a two-category item, which implies four hypothetical categories. Assuming
 $\alpha _j=1$
,
 $\tau _{jk}$
values determine how far away from
 $\delta _j$
the item response functions for each hypothetical category of response will cross. The model is identified by setting
 $\tau _{j0}=0$
and
 $\sum _{k^\ast =1}^{K_j^\ast } \tau _{jk^\ast } =0$
.
Probability of hypothetical responses as a function of
 $ \theta - \delta $
where
 $ \alpha = 1 $
and
 $ \boldsymbol \tau = (0, -1)$
.

The final step is to also combine the probabilities for hypothetical response options into the observed response categories. Thus, the probability that a respondent will “agree” is the sum of the probability they will “agree from below” and “agree from above.” We also assume that the
 $\tau $
parameters are symmetric around the point
 $(\theta _i-\delta _j)=0$
. Thus, for each
 $\tau _{jk}$
parameter in the model, there exists an equivalent hypothetical response corresponding with
 $-\tau _{jk}$
. Substantively, this assumption means that we assume preferences to be symmetric and single-peaked around
 $\delta _j$
.
This last step involves some tedious algebra as explicated in Roberts et al. (Reference Roberts, Donoghue and Laughlin2000), but the result is
 $$ \begin{align} P(y_{ij}=k|\theta_i) = \frac{\exp (\alpha_j [k (\theta_i - \delta_j) - \sum_{m=0}^k \tau_{jm}]) + \exp (\alpha_j [(2K_j - k - 1) (\theta_i - \delta_j) - \sum_{m=0}^k \tau_{jm}])} {\sum_{l=0}^{K-1} [\exp (\alpha_j [l (\theta_i - \delta_j) - \sum_{m=0}^l \tau_{jm}]) + \exp (\alpha_j [(2K_j - l - 1) (\theta_i - \delta_j) - \sum_{m=0}^l \tau_{jm}])]}, \end{align} $$
where
 $P(y_{ij}=k|\theta _i)=P_{jk}(\theta _i)$
is the probability for the observed response
 $y_{ij}$
and
 $K_j$
is the number of observed response options. While unwieldy, this equation is actually a modest modification of the GPCM IRT model to allow for the “folding” of various hypothetical responses around
 $\delta _j$
to create the observed responses. Appendix A of the Supplementary Material provides additional discussion on how to interpret each parameter. We emphasize here, however, that although this parameterization appears ungainly, the total number of parameters estimated increases by only one parameter per item relative to standard IRT models. The primary difference is the assumed functional form.
With this equation, the likelihood for a set of responses
 ${\mathbf Y}$
is
 $$ \begin{align*}L({\mathbf Y}) = \prod_i \prod_j \sum_k P_{jk}(\theta_i)^{I(y_{ij} = k)}. \end{align*} $$
Note that the summation here is over all possible responses to item j. Roberts et al. (Reference Roberts, Donoghue and Laughlin2000) outline a procedure whereby item parameters are estimated using a marginal maximum likelihood (MML) approach and the
 $\theta $
parameters are then calculated by an expected a posteriori estimator. de la Torre et al. (Reference de la Torre, Stark and Chernyshenko2006) provide a Bayesian approach to estimation via Markov chain Monte Carlo (MCMC).
However, there are a few aspects to the surface of the likelihood (and posterior) that make parameter estimation difficult. First, the construction of the model allows the likelihood to be multimodal. The model is designed, after all, to reflect the fact that the same behavior (e.g., voting against the bill) can be evidence of two underlying states of the world (e.g., being extremely conservative or extremely liberal). Example profile likelihoods are shown in Appendix B of the Supplementary Material.
Second, like many IRT models, the GGUM is subject to reflective invariance; the likelihood of a set of responses
 $\mathbf {Y}$
given
 $\boldsymbol \theta $
and
 $\boldsymbol \delta $
vectors is equal to the likelihood of
 $\mathbf {Y}$
given vectors
 $-\boldsymbol \delta $
and
 $-\boldsymbol \theta $
(Bafumi et al. Reference Bafumi, Gelman, Park and Kaplan2005). However, unlike standard IRT models, simply restricting the sign of one (or even several)
 $\theta $
or
 $\delta $
parameters is not sufficient to shrink the reflective mode and identify the model. That is, because the likelihood is multimodal, constraining a few parameters will not eliminate the reflective invariance.
The consequence of these two facts together mean that both maximum likelihood models and traditional MCMC approaches struggle to fully characterize the likelihood/posterior surface absent the imposition of many strong a priori constraints. Furthermore, both are sensitive to starting values and may focus on one mode—sometimes a reflective mode.
3.1 Estimation via Metropolis-Coupled Markov Chain Monte Carlo
To handle these issues, we offer a new Metropolis-coupled MC3 approach, and implement this algorithm in our R package.Footnote 7 To begin, we follow de la Torre et al. (Reference de la Torre, Stark and Chernyshenko2006) in using the following priors:
 $$ \begin{align*}\begin{array}{rclrcl} P(\theta_i) & \sim & \mathcal{N}(0, 1), & P(\alpha_j) & \sim & \mathit{Beta}(\nu_\alpha, \omega_\alpha, a_\alpha, b_\alpha), \\ P(\delta_j) & \sim & \mathit{Beta}(\nu_\delta, \omega_\delta, a_\delta, b_\delta), & P(\tau_{jk}) & \sim & \mathit{Beta}(\nu_\tau, \omega_\tau, a_\tau, b_\tau), \end{array} \end{align*} $$
where
 $\mathit{Beta}(\nu , \omega , a, b)$
is the four-parameter Beta distribution with shape parameters
 $\nu $
and
 $\omega $
, with limits a and b (rather than
 $0$
and
 $1$
as under the two-parameter Beta distribution). These priors have been shown to be extremely flexible in a number of settings allowing, for instance, bimodal posteriors (Zeng Reference Zeng1997). However, the priors censor the allowed values of the item parameters to be within the limits a to b. As discussed in Appendix C of the Supplementary Material, researchers must take care that the prior hyperparameters are chosen, so they do not bias the posterior via censoring.
We utilize an MC3 algorithm (Gill Reference Gill2008, 512–523; Geyer Reference Geyer and Keramides1991) for drawing posterior samples, and the complete algorithm is shown in Appendix C of the Supplementary Material. In MC3 sampling, we use N parallel chains at inverse “temperatures”
 $\beta _1 = 1> \beta _2 > \cdots > \beta _N > 0$
. Parameter updating for each chain is done via Metropolis–Hastings steps, where new parameters are accepted with some probability p that is a function of the current value and the proposed value (e.g.,
 $p\left (\theta _{bi}^*, \theta _{bi}^{t-1}\right )$
). The “temperatures” modify this probability by making the proposed value more likely to be accepted in chains with lower values of
 $\beta _b$
. Formally, the probability p of accepting a proposed parameter value becomes
 $p^{\beta _b}$
, so that chains become increasingly likely to accept all proposals as
 $\beta \rightarrow 0$
.
The goal here is to have higher temperature chains that will more quickly explore the posterior and therefore be more likely to move between the various modes in the posterior. We then allow adjacent chains to “swap” states periodically as a Metropolis update. Since only draws from the first “cold” chain are recorded for inference, the result is a sampler that will simultaneously be able to efficiently sample from the posterior around local modes while also being able to jump between modes that are far apart. Intuitively, the idea is to use the “warmer” chains to fully explore the space to create a somewhat elaborate proposal density for a standard Metropolis–Hastings procedure.
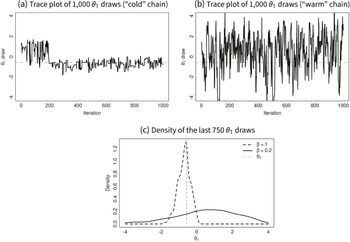
To illustrate the difference in propensity to accept proposals between colder and hotter chains, we simulated data from 100 respondents and 10 items with four options each and ran two chains for 1,000 iterations from the MC3 sampler, one with an inverse temperature of 1, the other with an inverse temperature of 0.2 (no swapping between chains was permitted).Footnote
8
The results are shown in Figure 4.Footnote
9
Figure 4a shows the draws for the latent trait parameter for the first respondent for the “cold” chain and Figure 4b for the “hot” chain, and Figure 4c shows the density plots for the last 750 draws. You can see that the hotter chain explores the posterior space more freely, and more proposals are accepted; the acceptance rates were 0.29 and 0.73 for the cold and hot chains, respectively. While the density of draws for the cold chain is a single peak concentrated around a small range of values in one posterior mode, the heated chain freely explores a “melted” posterior surface. Critically, these “warm” chains are not preserved for inference. Rather, they simply propose new values for colder chains and only the proper chain
 $(\beta =1)$
is ultimately used.
 $\theta _1$
draws for chains with inverse temperatures 1 and 0.2. Panel (a) shows draws from the cold chain with inverse temperature of 1, panel (b) shows draws from the hot chain with inverse temperature of 0.2, and in all panels the dashed gray line shows the true value of
 $\theta _1$
.

In Appendix C of the Supplementary Material, we compare our proposed estimation methods with both the MML routine proposed in Roberts et al. (Reference Roberts, Donoghue and Laughlin2000) and the MCMC approach outlined in de la Torre et al. (Reference de la Torre, Stark and Chernyshenko2006). We find that the MC3 algorithm significantly reduces the root-mean-squared error for key parameters in finite samples relative to the MML algorithm and avoids becoming stuck in single modes as is common with the extant MCMC algorithm.
3.2 Identification
Most Bayesian IRT models rely on constraints placed on specific parameters to achieve identification during the actual sampling process. We follow this procedure in part by identifying the scale of the latent space via a standard normal prior on
 $\theta $
. For the reasons discussed above, however, standard constraints will not prevent an MCMC or MC3 sampler from visiting reflective modes. To avoid this problem, we instead allow the MC3 algorithm to sample the posterior without restriction, then impose identification constraints post-processing.Footnote
10
Since for this model the only source of invariance is rotational invariance, restricting the sign of one relatively extreme item location or respondent latent trait parameter is sufficient to separate samples from the reflective mode.
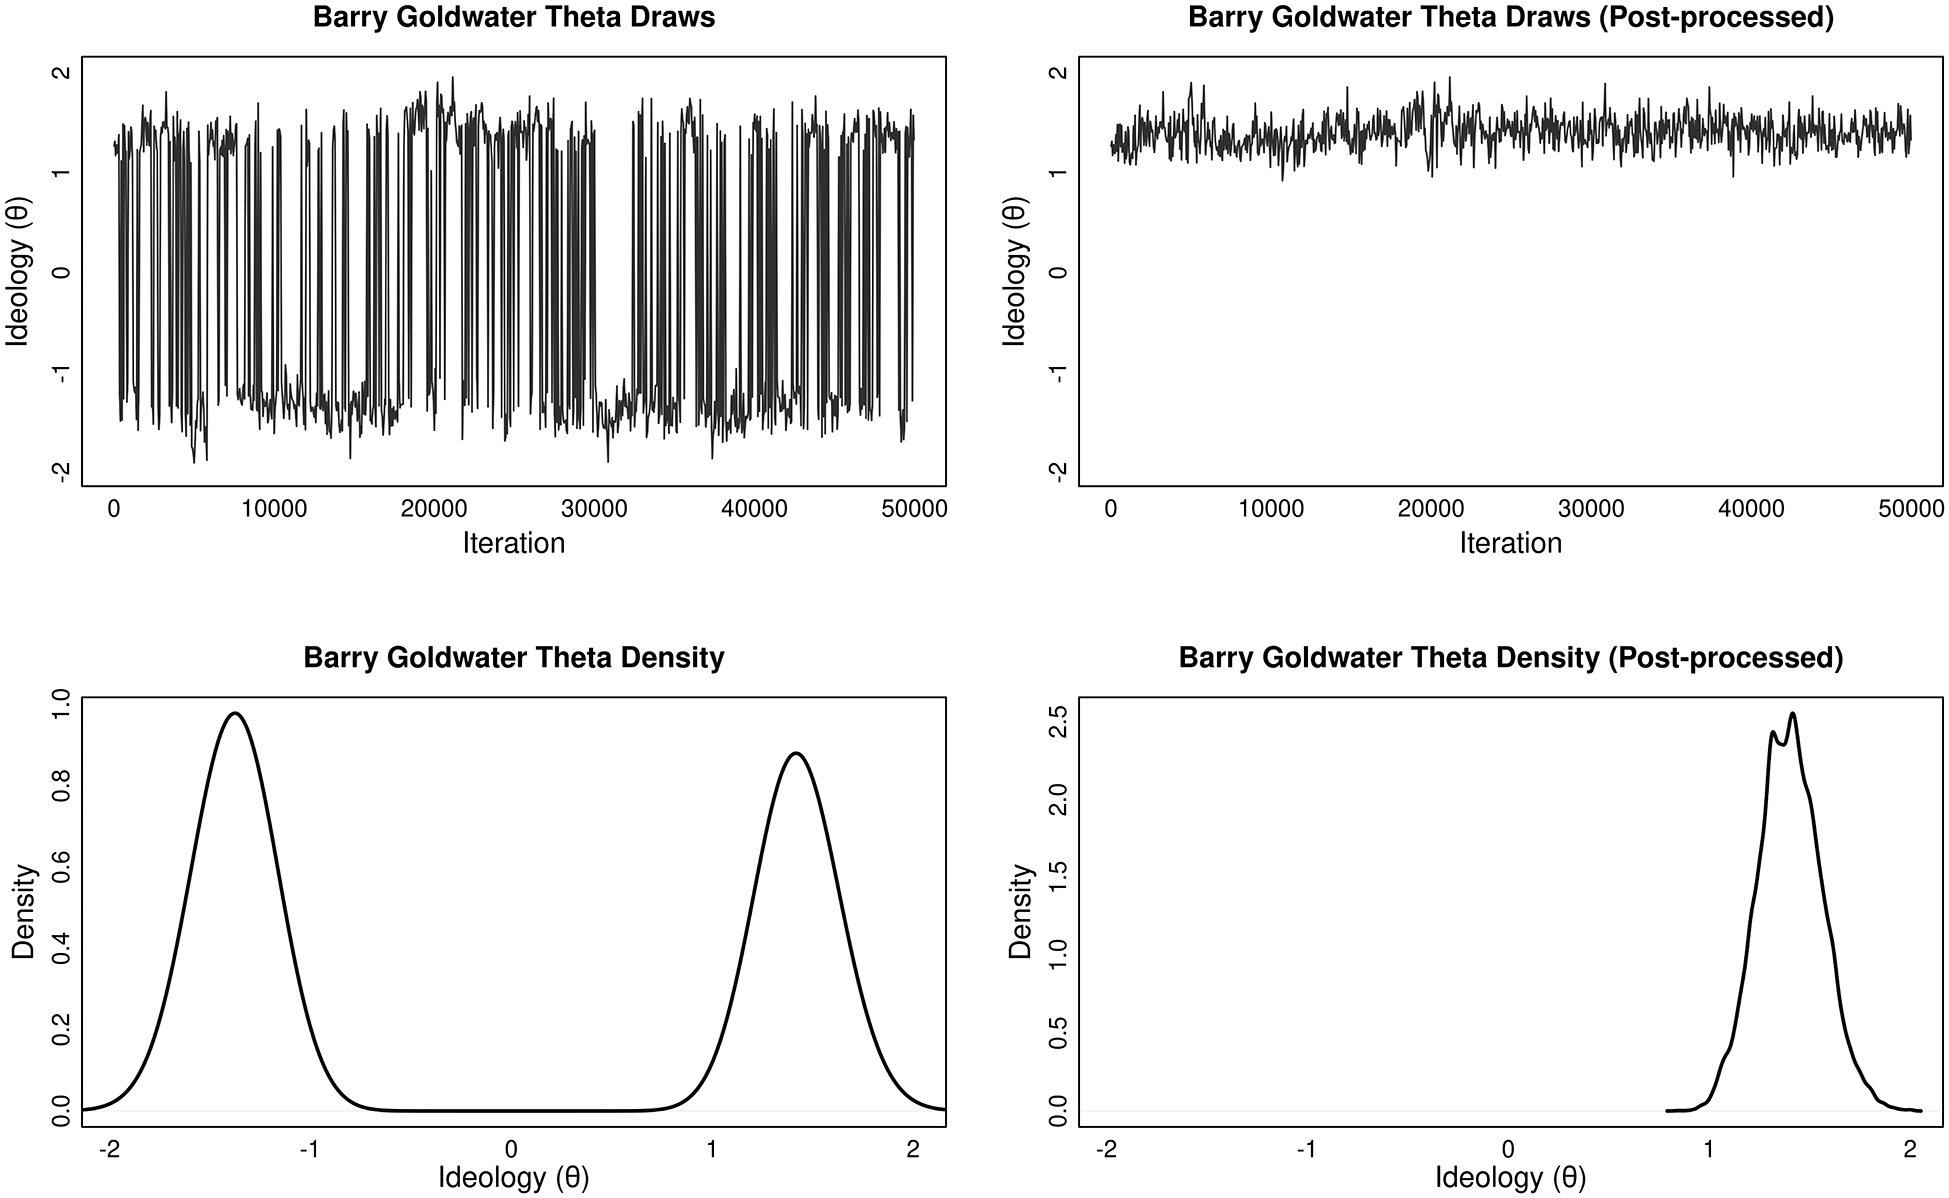
For example, we post-process the output of our MC3 algorithm on the voting data from the 92nd Senate (see Appendix F of the Supplementary Material) using Sen. Ted Kennedy’s
 $\theta $
parameter (restricting its sign to be negative). Figure 5 shows the traceplot and posterior density for two independent chains for the famous conservative Sen. Barry Goldwater (R-Arizona). Before post-processing, the chains jump across reflective modes. Once we impose our constraint on Ted Kennedy, the posterior for Goldwater is restricted to the positive (conservative) side.
Posterior
 $\theta $
draws for Sen. Goldwater (R - AZ) before and after post-processing.

4 Advantages and Disadvantages of MC3-GGUM
In the next section, we turn to three applications to illustrate the advantages of the method in a variety of settings. However, it is worth pausing first to briefly consider the potential limitations of our approach relative to alternative methods already in the literature.
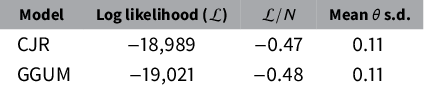
First, we may be worried that while the MC3-GGUM performs well when its assumptions are met, it may perform worse than standard methods in cases where the usual monotonicity assumptions hold. While it is true that standard models will always perform better when their assumptions are met, in practice the MC3-GGUM performs well (if not identically) even when a standard IRT model is exactly correct. To show this, we simulated responses from 100 individuals to 400 binary items according to the model described in Clinton et al. (Reference Clinton, Jackman and Rivers2004) and estimated using the R package MCMCpack Martin, Quinn, and Park Reference Martin, Quinn and Park2011. We then estimate the GGUM from these data and compare the in-sample fit statistics in Table 1.Footnote 11
Comparing log likelihood for the Clinton–Jackman–Rivers (CJR) monotonic IRT model and the MC3-GGUM for responses simulated under the Clinton–Jackman–Rivers model. The log likelihoods are near-identical for monotonic response functions; the respondent parameters correlate at 0.999.

Note: N is the number of nonmissing responses in the data (here,
 $ N = n m $
as no responses were simulated as missing).
The results show that in the presence of monotonic response functions, the MC3-GGUM recovers ideological estimates that are nearly (if not exactly) identical in terms of fit. Indeed, the
 $\theta $
estimates from the two approaches are correlated at 0.999. This is because for items with strictly increasing response functions, the nonmonotonic gradient is estimated to occur outside of the support of the
 $\theta $
estimates meaning that the nonmonotonicity has no effect. An example of this case is shown in Figure 2b, which shows the IRF far from the “bliss point”
 $\delta _j$
.
A second consideration is that the MC3-GGUM is a unidimensional model, and we are aware of no implementations that allow for more than one dimension. As we show below, the model is still very useful for better understanding political behaviors in many important settings, but the GGUM would not be an appropriate choice in settings where we anticipate multiple dimensions a priori.
A related concern is conflating nonmonotonic responses with a second (monotonic) dimension. This is salient to our application to Congress below. To explore this, we simulate a roll-call record with 100 respondents and 400 items from a standard IRT model assuming the presence of a second dimension. We fit both an MC3-GGUM model and a two-dimensional CJR model to these data. Estimates from both the MC3-GGUM and a two-dimensional IRT model are essentially identical (correlations are greater than 0.99), indicating that the mere presence of a second dimension should not lead MC3-GGUM to confuse ends against the middle voting with two-dimensional voting.Footnote 12 Thus, it is not true that the GGUM is simply picking up on a latent second dimension. We demonstrate this further in Appendix F of the Supplementary Material with simulated and real-world data. If there is no GGUM-like behavior and member ideologies are two-dimensional, MC3-GGUM simply measures the first dimension. It is not so easily confused.
One can of course construct instances where the MC3-GGUM would mistake a second dimension for ends against the middle voting. A particularly salient example might be if there was a second dimension correlated with extremity on the first dimension. So, for instance, we could imagine a second dimension representing “party loyalty” that declines for extreme members of a caucus. This argument is similar in flavor to arguments proposed by Spirling and McLean (Reference Spirling and McLean2007) and Zucco and Lauderdale (Reference Zucco and Lauderdale2011). But the general argument that the GGUM and a multidimensional model are in some way equivalent representations of the same data-generating process is simply untrue.
Furthermore, there are obvious computational costs associated with running multiple chains at differing temperatures that work to increase the computational burden and the time the model takes to run. This is particularly true considering the much faster implementations of standard models proposed in Imai, Lo, and Olmsted (Reference Imai, Lo and Olmsted2016) that do not rely on sampling. However, our custom implementation of MC3-GGUM generates posterior samples in a reasonable amount of time given the additional computational overhead. For example, in our Supreme Court application in Section 5.2, the MCMCpack Martin et al. Reference Martin, Quinn and Park2011 implementation of the Martin and Quinn (Reference Martin and Quinn2002) model generated approximately 246 posterior samples per second, whereas our MC3-GGUM implementation produced 87 posterior samples per second despite running six chains; that is, despite doing six times the work, we were able to streamline our implementation enough so that it only required a little less than three times the run time as the Martin and Quinn (Reference Martin and Quinn2002) model. (This resulted in a 14-minute 56-second run time for the Martin and Quinn (Reference Martin and Quinn2002) model and a 42-minute 8-second run time for the MC3-GGUM model in this application.)
Finally, as noted above, researchers need to examine the posteriors to ensure that there is no censoring at the outer bounds for the item parameters resulting from the Beta priors. For instance, we found this to be an issue for some of the more extreme (lopsided) votes in our analysis of congressional voting below. In these cases, researchers will need to try alternative hyperparameters.
In general, MC3-GGUM is most appropriate and useful when attempting to scale political actors in a unidimensional ideological space when ends against the middle behavior is present for at least some of the votes (or cases, or survey items). In the next section, we show that this behavior is indeed present in a wide variety of political contexts and using MC3-GGUM in those cases improves the substantive insights we glean from our data.
5 Applications
In this section, we provide three applications of MC3-GGUM to political science data. These examples serve to illustrate the strengths of the method and highlight the substantive insights that the model can provide. We begin simply by analyzing a survey battery where some items exhibit two-sided disagreement. Then we analyze votes by justices in the U.S. Supreme Court and finally the study of voting in the U.S. House of Representatives.Footnote 13 While we do note that MC3-GGUM offers superior model fit to the data, our primary motivation remains offering superior substantive insights. That is, we argue that the substantive conclusions reached based on the item characteristic curves and ability estimates are more in line with the empirical realities and thus more valid.
5.1 Immigration Survey Battery
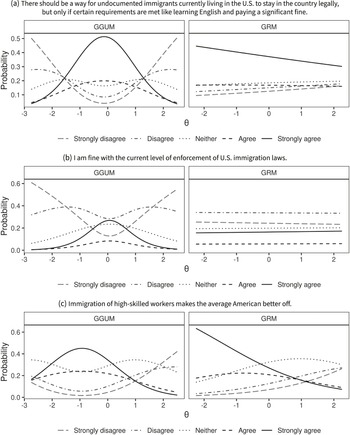
To illustrate the basic properties of MC3-GGUM, we developed and fielded a 10-item battery consisting of statements related to immigrants and immigration policy and offering respondents a standard five-item Likert scale with options ranging from “strongly disagree” (1) to “strongly agree” (5).Footnote 14 Some items represented extreme statements designed to elicit “one-sided” disagreement. However, we also included items that could draw “two-sided” disagreement in a way that is inconsistent with traditional IRT models (see Figure 6). The complete inventory and additional information about this survey are shown in Appendix G of the Supplementary Material.
Item response functions for two moderate items and one more extreme item measuring immigration attitudes. The full inventory is shown in Appendix G of the Supplementary Material.

We fit our MC3-GGUM modelFootnote 15 and compare it to a graded response model (the GRM is a standard IRT model for ordered categorical data) using the ltm package in R. Figure 6 shows item response functions for two moderate survey items in the battery and one extreme item. It shows that while MC3-GGUM identifies the two-sided disagreement in the survey responses, the GRM views them as essentially providing no information about the underlying latent trait (shown by the flat slopes for the lines). The final figure shows that the GGUM also identifies the more extreme items as being one-sided (although there is some nonmonotonicity on the far left of the distribution).
As a consequence, the MC3-GGUM provides a slightly different measure of respondents’ latent position on immigration policy. While they are strongly (if imperfectly) correlated with each other (
 $r=0.936$
), the MC3-GGUM was more strongly correlated with self-reported ideology than the GRM measure (
 $r=0.627$
vs.
 $r=0.618$
, respectively) and more predictive of the underlying responses.Footnote
16
5.2 The U.S. Supreme Court
For our Supreme Court application, we analyze all nonunanimous cases from the 1704 natural court, or the period beginning when Justice Elena Kagan was sworn in and ending with the death of Justice Antonin Scalia. We treat each case as a single “item” with two observable responses: voting for the outcome supported by the majority, or with the dissent. Under this coding scheme, we have 203 nonunanimous cases.Footnote 17
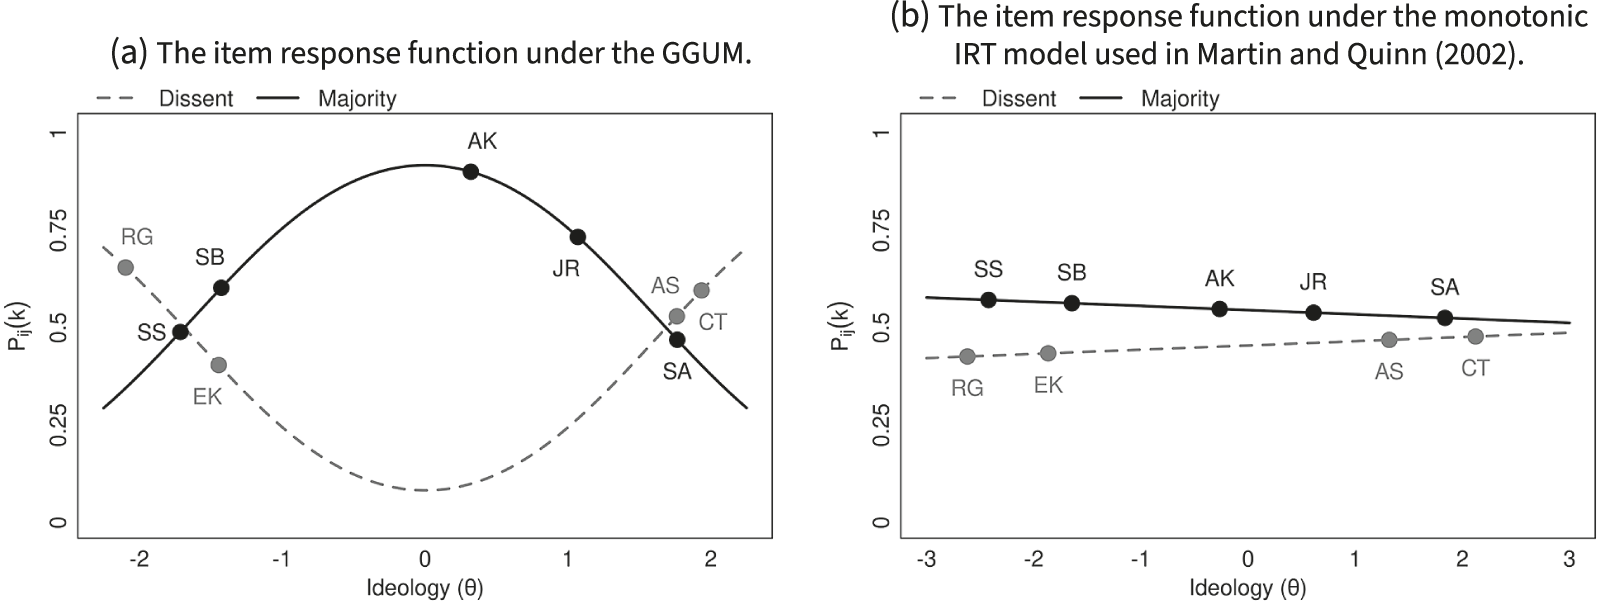
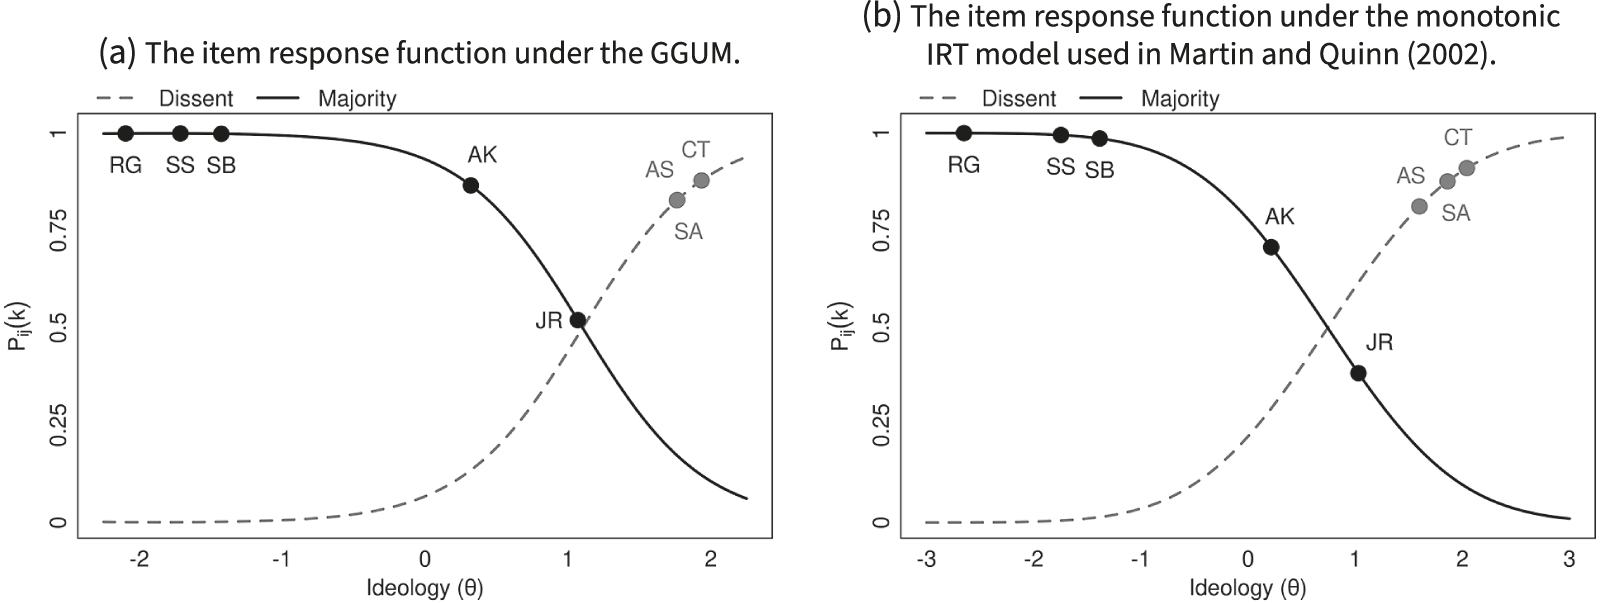
The results illustrate several advantages of the GGUM over monotonic IRT models (Clinton et al. Reference Clinton, Jackman and Rivers2004; Martin and Quinn Reference Martin and Quinn2002) commonly used to analyze Supreme Court voting. Most importantly, we gain the ability to concisely explain disjoint voting coalitions. An example is Comptroller of the Treasury of Maryland v. Wynne, a case about the dormant Commerce Clause of the Constitution as applied to a tax scheme by the state of Maryland. A centrist majority opinion drew dissents from both sides of the Court. The majority opinion ruled the law was unconstitutional as it violated existing jurisprudence by discriminating against interstate commerce. Justices Scalia and Thomas authored a dissents on the grounds that the dormant Commerce Clause does not exist. At the other end, Justice Ruth Bader Ginsburg authored a separate dissent (joined by Justice Elena Kagan) that while the dormant Commerce Clause does exist, it should not be interpreted so stringently as to disallow Maryland’s tax scheme.
Figure 7 shows the item response functions from both the Martin–Quinn model and GGUM with the estimated positions of the Justices. Due to the monotonicity assumption, the standard IRT model treats this case as if it provides essentially no information about ideology; voting in the case appears to be entirely nonideological. This is shown by the flat lines shown in Figure 7(b). On the other hand, the GGUM item response function, shown in Figure 7(a), indicates that the model can learn from such disagreement since the dissents are joined by two ideologically opposed but (somewhat) coherent groups. That is, we are able to adequately account for these voting coalitions based on justices’ ideologies and provide more accurate predictions for their voting decisions.
Item response functions for Comptroller of the Treasury of Maryland v. Wynne (2015). The probability of each justice’s actual response is marked and labeled with the justice’s initials.

However, for many decisions, a monotonic item response function is completely appropriate. This is exemplified by Arizona v. United States, where the majority coalition consisted of Justices Roberts, Kennedy, Ginsburg, Breyer, and Sotomayor, with partial dissents coming from Justices Scalia, Thomas, and Alito. In this case, with a clear left–right divide on the court, Figure 8 shows that both GGUM and Martin–Quinn scores result in very similar monotonic response functions.
Item response functions for Arizona v. United States (2012). The probability of each justice’s actual response is marked and labeled with the justice’s initials.

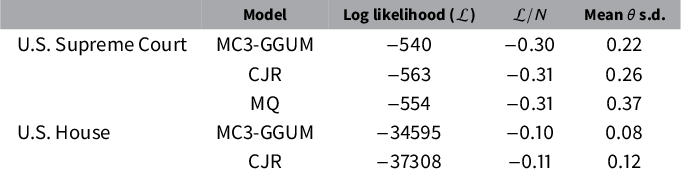
We also compare fit in Table 2. The result shows that GGUM provides a modest improvement over standard methods, meaning we get estimates that are both more precise and more accurate.Footnote 18 It also shows that the posterior variance for our estimates is lower, resulting from the higher amount of information (in a statistical sense) that we derive from items when the IRFs are less flat. In summary, we are able to simultaneously provide more accurate predictions, with less uncertainty, while also being more consonant with our substantive understanding of the data-generating process.
Log likelihood for all models in the U.S. House of Representatives and Supreme Court applications.

Note:
 $ N $
is the number of nonmissing responses in the data.
5.3 The House of Representatives
During the 116th Congress, scholars began to notice an irregularity. Even after the entire Congress was over, ideology estimates for several of the newest members of the Democratic caucus seemed unusually inaccurate. As of this writing, for instance, Poole and Rosenthal’s DW-NOMINATE identifies Rep. Alexandria Ocasio-Cortez (D-NY) as one of the most conservative Democrats in the chamber (the 90th percentile, just to the left of the chamber median; Lewis et al. Reference Lewis, Poole, Rosenthal, Boche, Rudkin and Sonnet2019). This contrasts strongly with her wider reputation as an extreme liberal. She is not alone in having unusual estimates. Three members of the so-called “squad” (Reps. Ilhan Omar, Ayanna Pressley, and Rashida Tlaib) are estimated as being on the conservative side of the Democratic caucus.
This is because ends against the middle voting confuses many standard scaling methods. In the case of Rep. Ocasio-Cortez, the problem is that she regularly voted against the majority of the Democratic party and with Republican members. From public statements, it is clear that she does this because the proposals being considered are not liberal enough, while Republicans oppose the same bills because they are not conservative enough.
To show this, we use all nonunanimous roll-call votes in the 116th House for which the minority vote was at least 1% of the total vote. We omit from analysis members who participated in less than 10% of these roll calls.Footnote 19 This results in 438 total “respondents” (House members) and 846 “items” (roll-call votes); we used as observable response categories “Yea” votes and “Nay” votes. We obtained member ideology and item parameters using our MC3 algorithm for the MC3-GGUM, producing two recorded chains, each obtained by running six parallel chains for 10,000 burn-in iterations and 100,000 recorded iterations.Footnote 20 We compare our estimates to the standard two-parameter IRT model (Clinton et al. Reference Clinton, Jackman and Rivers2004).Footnote 21
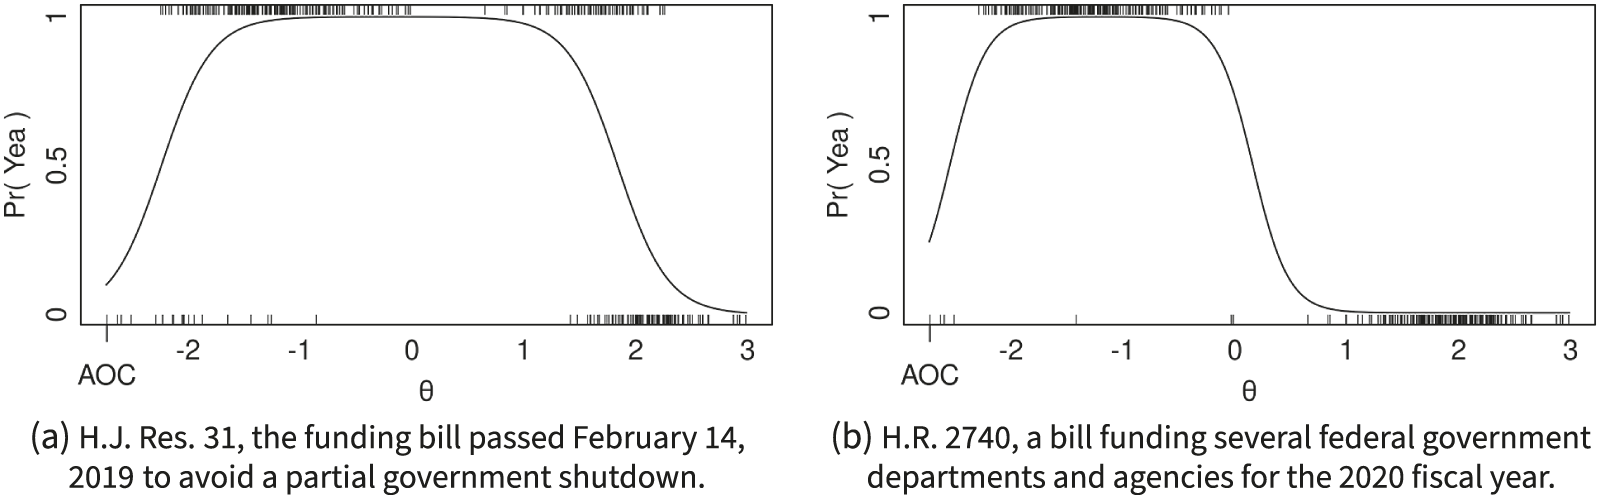
The results of the MC3-GGUM analysis indicate that while ends against the middle votes are not the modal case, they are nonetheless common. One example occurs about 1 month into the 116th Congress, on a vote designed to prevent a(nother) partial government shutdown. Republicans opposed the bill because it did not include funding for the border wall. Liberal Democrats, however, opposed it because it did not sufficiently reduce funding for border detention facilities (McPherson Reference McPherson2019). In both cases, the proposed bill was not sufficiently proximate to members’ preferences. The item response function from the MC3-GGUM is shown in Figure 9a. As it clearly shows, MC3-GGUM captures the tendency of some members to vote in objectively similar ways (in this case Nay) for subjectively different reasons (opposition from the right and from the left).
Item response functions for two votes in the 116th House of Representatives. The solid line indicates the item response function for this vote. The rugs indicate the estimated ideology (
 $\theta $
) for all members where “Yea” votes are shown at the top and “Nay” votes are shown at the bottom.

Figure 9b shows the item response function for a bill to appropriate funds for fiscal year 2020. For Republicans, it provided too much domestic spending, representing “an irresponsible and unrealistic $176 billion increase above our current spending caps” while “imposing cuts to our military” (Flores Reference Flores2019). Extreme Democrats did not support it because it gave the “military industrial complex another $733B windfall” while not bringing “economic opportunities we need” (Tlaib Reference Tlaib2019). Members at both ideological extremes opposed the bill while providing exactly opposite rationales. Detailed discussions of additional examples of nonmonotonic item response functions on key bills in the 116th Congress are shown in Appendix I of the Supplementary Material.
The ability of the MC3-GGUM to capture ends against the middle behavior allows it to outperform IRT in terms of fit. Table 2 shows that while both models fit the data very well, MC3-GGUM has lower log-likelihood scores while at the same time providing narrower posterior standard deviations. It is again, therefore, both more accurate and more precise.
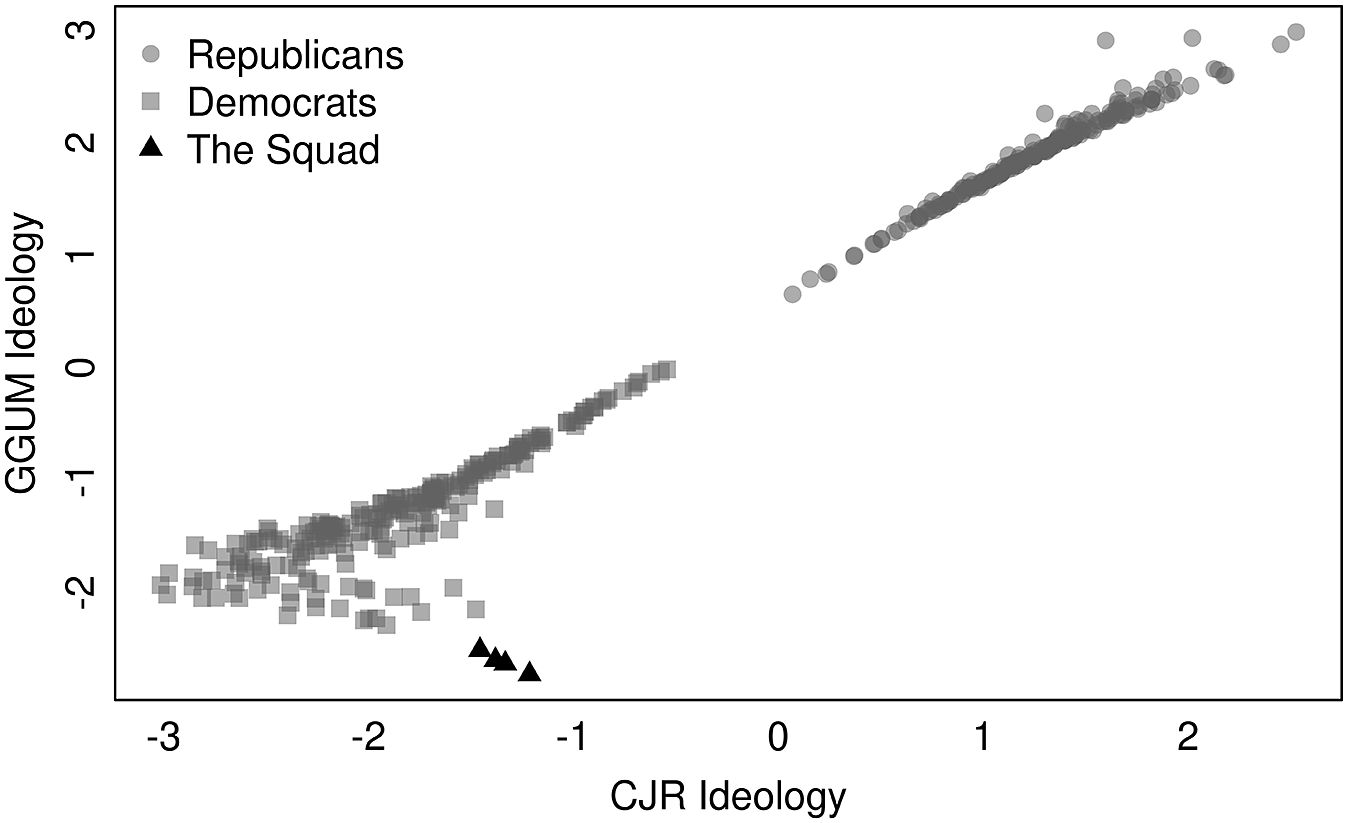
Perhaps more importantly, because it can accommodate votes that should have nonmonotonic item response functions, we can more accurately scale extremists who vote against their party. As shown in Figure 10, ideology estimates from MC3-GGUM and the CJR IRT model largely agree, but the dominance model scales the Squad as moderates, while MC3-GGUM correctly identifies them as the most liberal House members.Footnote 22 They also disagree on other notable progressives. The next three largest disagreements are for Rep. Pramila Jaypal, the chair of the Congressional Progressive Caucus (CPC), Rep. Peter DeFazio (founding member of the CPC), and Rep. Rohit Khanna (CPC member and national co-chair of the Bernie Sanders presidential campaign). In each case, MC3-GGUM identifies them as being far to the left, whereas CJR identifies them as moderates.
Comparing ideology estimates for members of the 116th House of Representatives from the MC3-GGUM and CJR IRT models. Estimates for Republicans are depicted with circles, and estimates for Democrats with squares, except that estimates for Reps. Ocasio-Cortez, Omar, Pressley, and Tlaib are depicted with triangles.

Before moving on, it is worth briefly discussing why this is occurring. While we cannot provide a comprehensive answer to this question here, the evidence suggests that some members—especially ideologically extreme members—may refuse to support bills that move the status quo in their direction because the proposal is still “too far” from their ideal point (Gilmour Reference Gilmour1995). For instance, in discussing the Republican bill to replace the Affordable Care Act in 2017, Rep. Andy Biggs (R-AZ) explained that he opposed the bill (thus joining every Democrat) because it fell short of his promise of full repeal (Biggs Reference Biggs2019). In short, the bill was not conservative enough.
The literature explaining this behavior is unsettled. Kirkland and Slapin (Reference Kirkland and Slapin2019) argue extreme members “rebel” against leadership as an electoral strategy to mark themselves as ideologues. They hypothesize that ideological extremity should be paired with voting against party leadership, but largely within the majority party. Or, perhaps members are engaged in a dynamic strategy holding out for more favorable eventual policy outcomes (in the flavor of Buisseret and Bernhardt Reference Buisseret and Bernhardt2017). Spirling and McLean (Reference Spirling and McLean2007) offer a differing argument in the context of Westminster systems, arguing majority-party rebels vote sincerely against policies they dislike, whereas the opposition party votes strategically against nearly all government proposals. This debate cannot be resolved here. However, if these questions are to be pursued, at the very least, we need a measurement technique that does not conflate expressive disagreement with ideological moderation.
6 Conclusion
In this paper, we introduce the MC3-GGUM to the political science literature. The model accounts for and leverages ends against the middle responses—disagreement from both sides—when estimating latent traits. We provide a novel estimation and identification strategy for the model that outperforms existing routines for estimating the GGUM as well as open-source software, so researchers can implement the MC3-GGUM in their own work.
We illustrate this method with survey data, and votes in two institutional settings. We show that we gain the ability to treat survey responses with two-sided disagreement, court cases with discontinuous sets of dissenting justices, or roll-call votes with nay votes from both sides of the ideological spectrum, as informative for estimating latent traits. As a consequence, we recover more accurate estimates that better capture the underlying data.
However, it is worth noting that GGUM will not always be the correct choice in all settings. To our knowledge the GGUM model has not been extended to handle multidimensional latent scales. Furthermore, although the model is more flexible, in some settings (e.g., a multiparty legislature such as Brazil), the multimodal posteriors can make identification and summary challenging. Like all measurement models, the GGUM will be more or less suitable in different settings depending on the structure of the data and the appropriateness of its assumptions.
Yet, as we show in our examples above, it can be useful in many important empirical settings. It may allow for more flexible development of survey batteries where disagreement may come from “both sides” of a latent dimension. As noted in our Supreme Court example above, judicial decision-making often involves disjoint ideological coalitions. Indeed, almost one out of four (45/203) nonunanimous cases in our analysis resulted in more than one dissent, indicating that the same behavior may arise from differing (if not always antithetical) ideological motivations. In Appendix J of the Supplementary Material, we also estimate that nearly 17% of all roll calls in the 116th House resulted in nonmonotonic item response functions. Broadening the scope of our analysis to the 110th–116th congresses (both House and Senate), this proportion ranges from approximately 1 in 10 to 1 in 3 roll calls. Other future application areas might include voting in the United Nations (Bailey et al. Reference Bailey, Strezhnev and Voeten2017) or co-sponsorship decisions where members can choose from a menu of bills to support.
Finally, it is worth considering what the latent trait estimates mean, especially when applied to voting data. After all, dominance models are embedded in a clear theoretical framework, especially as they pertain to Congress and the Court. They are, in some sense, structural parameters based on standard theories of voting. In moving away from this, one may worry the resulting measures are less valid indicators of the theoretical concept of ideology. We argue that MC3-GGUM is not a measure of a different concept, but a better measure of the same concept. When dominance models are appropriate, MC3-GGUM does a fine job, recovering the same latent parameters as dominance models. However, when individuals behave more expressively, GGUM also works to uncover their latent ideology. These are cases where votes serve to signal approval of (or proximity to) a specific policy or opinion; these are cases where spatial theories deviate from dominance models because actors are not just considering the status quo and proposal. Thus, we view MC3-GGUM not as a measure of a different ideology, but a more valid measure of the same ideology. To this end, we have provided evidence (both empirical and qualitative) that where dominance and unfolding models disagree, GGUM conforms better with our substantive understanding of where actors are in the ideological space and why they behave as we observe.
Acknowledgments
A previous version of this paper was presented as a poster at the 2018 summer meeting of the Society for Political Methodology at BYU. We are grateful for useful comments from Justin Kirkland, Kevin Quinn, Arthur Spirling, and helpful audiences at MIT, Stanford, and the University of Georgia. We also wish to thank members of the Political Data Science Lab at Washington University in St. Louis and especially thank Patrick Silva and Luwei Ying for their programming assistance.
Data Availability Statement
Replication code for this article is available in Duck-Mayr and Montgomery (Reference Duck-Mayr and Montgomery2022) at https://doi.org/10.7910/DVN/HXORK9.
Funding
Funding for this project was provided by the National Science Foundation (SES-1558907).
Supplementary Material
For supplementary material accompanying this paper, please visit https://doi.org/10.1017/pan.2022.33.