

1 Introduction
COVID-19 has revealed the critical role that data are playing and will increasingly play in the exercise of social control. Most governments around the world defined the key policy objective during the peak of the pandemic in statistical terms, namely to ‘flatten the curve’ of infections (Arshed et al., Reference Arshed, Meo and Farooq2020), and adopted draconian measures affecting individuals’ rights and civil liberties to achieve said objective. The characteristics of SARS-CoV-2 (the virus causing the COVID-19 disease) and its effects on the health of individuals and the socio-economic conditions of communities prompted governments to try new methods of data collection and analysis – such as the Internet of Things (IoT) and big-data analytics – to secure epidemiological surveillance. For instance, governments responded to the call of some scholars to use mobile and cell-tower-location data to inform policy decisions during the pandemic (Oliver et al., Reference Oliver2020; Grantz et al., Reference Grantz2020; Schlosser et al., Reference Schlosser2020). Health agencies and research institutes in, inter alia, Belgium, Germany, France, the UK and the US drew on these data to predict the way in which the virus spreads as a consequence of the movement of the population and to identify geographical areas at risk and needing enhanced health-care support (Inserm, 2020; Reynolds, Reference Reynolds2020; Oliver et al., Reference Oliver2020, p. 2). Yet, contact-tracing apps (CTAs) are possibly the most innovative data-driven tool that governments have developed as a response to the pandemic.Footnote 1 CTAs were designed to implement the test–trace–isolate (TTI) tryptic – which became the cornerstone of the response to SARS-CoV-2 (Rajan et al., Reference Rajan, Cylus and Mckee2020) – by expanding the range of sources that health authorities use to collect epidemiological data, and by tracking and analysing in real time the contacts between infected and exposed segments of the population.
This paper investigates the data life-cycle of CTAs – namely the collection, collation and analysis of data – as a tool of epidemiological surveillance in light of the International Health Regulations (IHR). It highlights the socio-legal implications resulting from the design and technology choices that software developers inevitably make. These choices are often neglected by policy-makers due to the inherent technical complexity of algorithmic decisions systems (Restrepo Amariles, Reference Restrepo Amariles and Barfield2021) and to a certain naive belief in technological solutionism (Morozov, Reference Morozov2013). In particular, this paper shows, first, that technology-harvested data do not reflect an objective representation of reality, and therefore require an additional context within which to be understood and interpreted for policy and legal purposes; and, second, that the use of data analytics to extract insights from these data enables the production of computational indicators and of novel computational applications in the legal domain (law into technologies).
The paper is divided in three sections. Section 2 analyses the first two phases of the data life-cycle in CTAs: data collection and collation. It shows that, as a consequence of the models and technologies underpinning CTAs, the resulting data are inevitably prescriptive and technology-charged – which ultimately underlines the data–technology nexus as a mode of regulation by design (Yeung, Reference Yeung2017). Section 3 analyses the third phase of the data life-cycle (data analysis) and highlights the distinct features of computational indicators. In particular, it illustrates how encoding and data representation enable novel computational forms of social control, such as through the use of social graphs. More precisely, by looking at how governments use CTAs to implement pandemic-mitigation restrictions (PMRs) such as lockdowns, quarantines, social distancing and testing, it brings forth the ways in which technologies – and thus their bias and ways of framing social reality – become embedded in the law. Section 4 concludes.
2 Technology-charged data in COVID-19 contact-tracing apps
The IHR of the World Health Organization (WHO), a binding instrument under international law, defines surveillance in Article 1 as the ‘systematic ongoing collection, collation and analysis of data for public health purposes and the timely dissemination of public health information for assessment and public health response as necessary’. SARS-CoV-2 challenges the traditional SIR model of epidemiological surveillance used for the collection and analysis of data that is based on a threefold epidemiological status – susceptible, infected and recovered (SIR). The new SEIR model includes the exposed as a new epidemiological status to account for the fact that the SARS-CoV-2 spreads through asymptomatic carriers (Tang et al., Reference Tang2020, pp. 3–4). As Winkler and I argue elsewhere, the SEIR model requires the collection and real-time use of large amounts of data from individuals, health facilities and disease clusters to be effective (Winkler and Restrepo Amariles, Reference Winkler and Restrepo Amarilesforthcoming). This has led some scholars to argue that COVID-19 epidemiological surveillance eventually became a data-science issue (Callaghan, Reference Callaghan2020; Xu et al., Reference Xu2020).
The use of CTAs gained traction among policy-makers to respond to the new SEIR model and support strategies to exit from lockdowns (Ferretti et al., Reference Ferretti2020; Hinch et al., Reference Hinch2020). As Hinch et al. note, ‘[a] measure of success for digital contact tracing is the extent to which it reduces onwards transmission of the virus whilst simultaneously minimising the number of people in quarantine’ (Hinch et al., Reference Hinch2020, p. 2). To achieve these objectives, developers make choices between multiple technologies and methods to collect, collate and analyse data, and, as a consequence, the resulting data are technology-charged. They are shaped by the capabilities and limitations of the technologies and models chosen, and therefore require a context within which to be turned into meaningful information.
The prescriptive effects of the data–technology nexus underpinning CTAs can be analysed in terms of ‘hypernudge’ and regulation by design, as defined by Yeung (Reference Yeung2017). CTAs are a type of algorithmic decision system (ADS) to the extent that they rely on computer programming to process extensive amounts of data and automate decision-making (Restrepo Amariles, Reference Restrepo Amariles and Barfield2021, p. 273). The choices that designers and developers of CTAs make constitute the architecture of the ADS, which shapes the collection of data and the models used to ultimately orient the behaviour of individuals towards pre-defined objectives. If one may indeed distinguish between the phases of data collection and regulatory action in policy-making (Yeung, Reference Yeung2017, p. 120), CTAs collapse this distinction. They convey a form of design-based regulation by ‘embed[ding] standards into their design at the standard-setting stage in order to foster social outcomes deemed desirable’ (Yeung, Reference Yeung2017, p. 120, emphasis in original). As a consequence, additional context – such as information about the technologies and models used, the target users, the stakeholders involved in the production and the risks of function creeping – is necessary to fully understand and assess the objectives pursued by a CTA and its concrete implications for law and policy.
2.1 Data collection through the IoT
In addition to collecting medical data directly from individuals (as in the case of manual tracing and hospital records), CTAs also rely on the IoT, which makes data collection ubiquitous. The IoT enables a large number of ‘things’ equipped with wireless technologies and sensors such as phones, appliances and wearables to capture data from the environment without the aid of human intervention and to transfer it through the Internet and networks of interconnected objects (Gubbi et al., Reference Gubbi2013, p. 1646). CTAs encode data out of the interrelation between mobile phones and use them as a proxy for human interaction. Encoding allows the selection of relevant information from raw data and metadata, and its conversion into a representation that is suitable for subsequent computational applications. The result is output data that are prescriptive because they encapsulate information shaped by the built-in models and technologies. For instance, the information contained in encounter data registered by encounter IDs reflects a set of choices in terms of the epidemiological model (e.g. fifteen minutes’ exposure to create a data point), system design (e.g. choice between GPS location vs. Bluetooth handshake) and software (e.g. decentralised vs. centralised processing). Therefore, scrutinising the back-end processes through which these epidemiological data are collected and encoded casts light on how technologies are imperceptibly shaping social control during the pandemic.
CTAs collect data through the app and the operating system (OS) of the mobile device in which it is installed. The majority of tracing apps developed in response to COVID-19 were designed to use the so-called ‘Bluetooth handshake’ (Bradford et al., Reference Bradford, Aboy and Liddell2020, p. 9) – a quick and energy-efficient exchange of data (e.g. timestamps and encounter IDs) through Bluetooth between two devices with the tracing app installed. This proximity-triggered approach enables tracing by recording encounters between infected and exposed individuals without needing self-reported data and constant access to the Internet and the geolocation information of individuals.
2.2 System design and legal implications
The design of the system affects both the type of data that are collected and users’ rights, such as privacy and data protection. Take the case of encryption. When users install the app, their phone is given a unique ID that is used to generate untraceable encounter IDs approximately every fifteen minutes (to prevent tracking in the streets). This encounter ID is transmitted to other users, together with timestamp and signal strength (a proxy for distance), and equivalent information is received by the user. Once an infection is confirmed and the user shares the data in their phone with authorities, the impact of differences in design on individuals’ rights to privacy and data protection become apparent (Bradford et al., Reference Bradford, Aboy and Liddell2020). There are two main approaches: centralised and decentralised data processing (Criddle and Kelion, Reference Criddle and Kelion2020). This distinction will be described in more detail later, but the key difference is that decentralised solutions upload anonymous decryption keys and distribute them to all phones. Evaluation to assess whether an exposure has occurred is then triggered. Centralised solutions upload encounter data (including metadata) to a central server and the server sends exposure notifications. Centralised versions are less privacy-preserving because they enable the central server to associate the unique ID with encounter IDs and metadata, ultimately allowing social graph creation – that is, graphs representing social relations between entities and with high function creep potential.
However, certain CTAs do not use the Bluetooth handshake. They are designed to work based on GPS or other location data. Such apps are mostly regional (e.g. the Care19 app in the US) (Nellis and Dave, Reference Nellis and Dave2020) or used in countries with low data-protection and privacy standards (e.g. China). Google and Apple considered this design choice to be highly invasive and incompatible with the privacy-preserving design of their application programming interface (API). Apple and Google's Exposure Notification (GAEN) API incorporates a restriction on the collection of any kind of location data (Google, 2020). Since both companies are the developers of the most common mobile-phone OSs worldwide, they have full control over the ability of app software to break such a rule. Therefore, as long as the rule is in place, governments cannot use the GAEN protocol to get location data. This led countries like France and the UK to publicly call for a softening of the privacy standards built into their API to allow more flexibility in the design of the CTAs and the collection of data for their epidemiological surveillance strategies (Hern, Reference Hern2020). Google and Apple replied negatively (Kelion, Reference Kelion2020).
MIT SafePaths (Raskar et al., Reference Raskar2020) is a good example of how software shapes the data that CTAs produce and, en passant, the rights and obligations of its users under the PMRs. MIT SafePaths, software designed at the MIT, is an open-source technology that seeks to increase the accuracy of the data collection of CTAs by adding geolocation information to the encounter data without revealing the precise location of the user. Encoding this location allows CTAs to filter false exposures, to better inform users about their exposures, to better trace exposures in mobile users when timestamps are not enough to track their interactions (e.g. drivers, deliverers, police officers, etc.) and to filter the number of daily unique IDs processed by every phone.Footnote 2 In other words, it would enrich the information embedded in the output data of CTAs to determine whether a person is to be considered or not exposed with higher precision. This ultimately has a direct influence on their epidemiological status and on their rights and obligations under the PMRs, such as whether or not to get tested and to quarantine.
2.3 Data collation
Generally, CTAs work as a closed data system. They collate data produced out of an encounter. For instance, the data collated by CTAs implementing the Bluetooth handshake generally consist of some sort of encrypted package, containing exposure ID, date, time and signal strength. The data exchanged in most CTAs are changed regularly to prevent on-the-street tracking based on exposure ID and signal strength. While this improves data protection, it also prevents two phones from recognising each other for longer durations. Thus, if multiple users are living in apartment buildings, their phones will constantly encounter each other, producing large quantities of useless data and draining the power of their phones (unless users actively turn the app on and off). Such an issue is actually part of a much bigger problem with location-less Bluetooth handshake solutions, that being the lack of control – trolling attitudes such as misreporting and behaviours of users seeking attention might, and probably would, become problematic.
If CTAs adopt the software solution offered by MIT SafePaths, it would add quantised GPS location into the handshake. This is a rounded area of certain size evaluated based on citizen density (Raskar et al., Reference Raskar2020, p. 3). The authors claim that such data are of low risk to individual privacy but would encode very valuable metadata for contact tracing, as they give a context to exposure notifications that is otherwise missing (Berke et al., Reference Berke2020). An example can be situations in which two users get an exposure notification based on a handshake that happened while stuck on a highway without leaving a car or in a public space while wearing a mask or separated by a wall. The location context would give the user of the app enough information to evaluate the notification as harmless. Yet, for this solution to effectively preserve privacy, it needs, on the one hand, to ensure that the ‘location quantum’ size works effectively based on population density and, on the other, that this property is verifiable. Otherwise, CTAs could end up putting privacy rights behind a technical wall and/or inside a black box.
Despite CTAs working generally as a closed data system, data collation is not limited to the data collected directly through the app. They can integrate external data with potentially no limits. In fact, in several countries (most notably in Korea), CTAs can mine data from websites (such as social media), acquire data through API from other apps or databases (such as CCTV or credit cards) and even adjust the system design to integrate data that have been already collected by the OS of phones (such as contact details or location data) (Norton Rose Fulbright, 2020a). These data can be added alongside data collected from traditional sources of epidemiological surveillance such as call centres, hospital records, emergency-call registries, passenger information and national health indexes to generate aggregate indicators (Chen et al., Reference Chen, Zeng and Yan2010, pp. 33–44).
The phases of data collection and collation reveal the role that the back end of CTAs plays in shaping the resulting data. Therefore, to interpret these data in a meaningful manner, more context is needed: the choices in terms of technologies and models in the back end need to be known and understood. For instance, the technologies and their capabilities determine the aspects of social reality that are captured and may be subsequently used for policy purposes. As discussed earlier, apps record differently physical encounters to generate exposure notifications depending on whether they use the Bluetooth handshake or GPS technology (Ahmed et al., Reference Ahmed2020, pp. 134577–134601). Thus, a notification from these systems reflects different information in terms of social interaction, such as proximity and length of the encounters. Finally, developers also make decisions regarding the concrete specifications and features of the software – such as GAEN deactivating the option to collect geolocation data – and which data sources are collated. This should remind us that technology-harvested data, just like the ‘raw data’ collected through traditional social-science methods, do not provide an objective representation of reality (Restrepo Amariles and McLachlan, Reference Restrepo Amariles and McLachlan2018; Desrosières, Reference Desrosières1998, pp. 1–3). It is a representation conditioned by the technological settings that makes it possible.
3 Unpacking computational indicators in COVID-19 CTAs
CTAs enable the production of indicators with computational features because of the data they collect and encode. Encoded data are rich and multidimensional because they encapsulate different sorts of metadata gathered during data collection. As mentioned earlier, encounter IDs contain, for instance, information such as proximity, time and location, and could even include personal information if the application is granted access to the OS. This information enables CTAs to generate computational indicators in real time and with personalised information of risk exposure and infection (Alsdurf et al., Reference Alsdurf2020, p. 12). Although, for the time being, these indicators do not seem to be accessible to users or the public, they run already in the back end of most CTAs.
COVI, an AI-supported app developed at the MILA Institute to fight COVID-19 in Canada, explicitly acknowledges the production of computational indicators as one of the purposes of data analysis:
‘The data, apart from the analytics information, will be used for improving the risk prediction and epidemiological models. It will also form the basis for generating aggregated, population-level data to be shared with government actors and other third parties, solely for purposes relating to efforts to understand or combat COVID-19.’ (Alsdurf et al., Reference Alsdurf2020, p. 15)
More concretely, the ROBERT protocol supporting TousAntiCovid, the French CTA, generates a notification of ‘at risk of exposure’ to each individual based on a risk score calculated in the back end of the app (Castelluccia et al., Reference Castelluccia2020, p. 2). Similarly, the GAEN protocol provides an exposure-notification framework that allows health authorities to configure exposure-notification risk-scoring behaviour based on an exposure risk value (ERV) (Apple, 2021). This value allows ‘Health Authorities to define when to alert a user that they may have been exposed to someone diagnosed with COVID-19’ (Apple, 2021). Hence, contrary to popular belief, a notification of exposure is not the direct consequence of an encounter with an infected person, but the result of the consolidation of the data according to a predefined risk model.
The GAEN exposure-notification framework is based on the calculation of an ERV. Health authorities can change the way in which the ERV is calculated by setting different weights and values to the predefined variables, namely Bluetooth attenuations, infectiousness of the affected individual and diagnosis report type (Figure 1), and they can also determine what threshold of ERV will lead to a user notification. Nonetheless, it is Apple and Google alone who pre-set the variables that health authorities can further configure to calculate the scores and trigger the notifications.
Calculation of exposure risk value (ERV) in GAEN. Source: This graph is based on Apple's ENExposure Configuration (Apple, 2021).

For the French app, the developers do not specify the scoring methodology because they consider ‘it is the responsibility of the health authorities and epidemiologists to provide input to such an algorithm’ (Castelluccia et al., Reference Castelluccia2020, p. 5). When the app queries the exposure status, TousAntiCovid shares with the server the proximity contacts that it has collected during the estimated contagious period, typically the last fourteen days:
‘The server then checks how many times the App's EBIDs [encounter IDs] were flagged as “exposed” and computes a risk score from this information (and possibly other parameters, such the exposure duration or the user's speed/acceleration during the contact). If this score is larger than a given threshold, the bit “1” (“at risk of exposure”) is sent back to the App and her account is deactivated, otherwise the bit “0” is sent back. Upon reception of this message, a notification is displayed to the user that indicates the instructions to follow (e.g., go the hospital for a test, call a specific phone number, stay in quarantine, etc.).’ (Castelluccia et al., Reference Castelluccia2020, p. 4)
This means that users of TousAntiCovid, as with users of most CTAs, receive only the end result of the data analysis by the server (‘at risk’ or not ‘at risk’) and do not have access to the disaggregated data and models (including variables and weights) that are used to determine their epidemiological status. However, the app could have been designed to provide individuals with access to the computational indicators in the back end and leave each of them to calculate their own risk of exposure. In such a case, the app would need to avoid subjecting users to an information overload (Jacoby, Reference Jacoby1984), such as by ensuring that the interaction is based on information and models that are intelligible and actionable. Finally, the TousAntiCovid's server maintains the list of exposed users (through anonymous pseudonyms) with their risk scores. According to the developers, these can be adapted according to the evolution of the pandemic or the new knowledge available to epidemiologists (Castelluccia et al., Reference Castelluccia2020, p. 4).
3.1 Characterising computational indicators
As the examples of CTAs show, computational indicators draw predominantly on the automated collection of multi-faceted dataFootnote 3 and sophisticated methods of statistical analysis. They rely on software to extract data from a variety of sources, including documents, images, human behaviour, telecommunication devices, the Internet and the IoT. Therefore, the resulting data are heterogenous, with high variations in types and formats, including structured and unstructured data (Restrepo Amariles, Reference Restrepo Amariles and Barfield2021, p. 277). The analysis of these data requires a combination of computational models and advanced data analysis, while the results are often represented through encoding, such as encryption and social graphs. As opposed to traditional indicators, these characteristics make computational indicators ready for ‘plug and play’ into new software developments and computational applications.
Feng et al. note that traditional social indicators are characterised by three main features: labour-intensive data collection, data insufficiency and expert-relied data fusion (Reference Feng2017, pp. 455–464). These features contrast starkly with those of computational indicators.
First, data collection is labour-intensive, as traditional indicators usually rely on user studies like questionnaires and surveys that are time-consuming and require significant human resources (Restrepo Amariles, Reference Restrepo2017, p. 170; Siems and Nelken, Reference Siems and Nelken2017, pp. 437–438; Merry, Reference Merry2011). In contrast, computational indicators draw on automated methods of data collection such as the IoT and data mining, and can extract information from wider ranges of sources such as large relational databases, structured and unstructured data, and the Internet. As mentioned earlier, all these options are either already used or available to CTAs. But what information could computational indicators use, for instance, to rank the rule of law of countries compared to existing indicators such as the Rule of Law Index and the World Bank Governance Indicators (Davis, Reference Davis2014; Kaufmann et al., Reference Kaufmann, Kraay and Mastruzzi2011)? Through automatic extraction, they could explore large-scale and unstructured information sources, such as parliamentary debates, newspapers, court and police records, and citizens’ opinions from social media. In brief, computational indicators could arguably provide a more accurate representation of the entities they rank, as they can draw on a potentially limitless pool of data rather than only on representative samples.
Second, traditional indicators provide insufficient data, as they tend to account only for a limited number of the targeted entities. For example, Feng et al. report that the QS World University Rankings cover only 800 out of the 2,553 universities in China (Reference Feng2017, p. 455). This is in part due to the difficulty in conducting large-scale data collection for each entity and processing large amounts of data. Computational indicators can instead rely on techniques such as natural language processing to extract data from documents, the IoT to collect data from objects and big-data analytics to draw insights from large datasets. This can allow computational indicators to cover a larger number of entities and people, such as every mobile-phone user around the world.
Finally, data aggregation and analysis in traditional indicators rely on categories crafted based on the opinion of experts, which can be resource-consuming and subject to controversy (Restrepo Amariles and McLachlan, Reference Restrepo Amariles and McLachlan2018, pp. 187–189). Although computers cannot replace human expertise and judgment, they can implement novel methods to analyse data and rank them. As the team of MILA puts it: ‘[t]he use of ML [machine learning] to integrate complex clues which would otherwise require human intuition mitigates the absence of direct human intervention into a fully automatic contact tracing app’ (Alsdurf et al., Reference Alsdurf2020, p. 12). The combination of computational models and data analytics enables the extraction of insights from multi-faceted data through approaches like ML to address problems for which mathematical and traditional modelling work poorly, due among others to the ‘high complexity, uncertainty and stochastic nature of processes’ (Iqbal et al., Reference Iqbal2020, p. 2). ML approaches such as associate rule learning, artificial neural networks, deep-learning support vector machines and Bayesian networks could thus be used to identify hidden patterns and to cluster data, while algorithms like PageRank and the graph-based multichannel ranking scheme proposed by Feng et al. (Reference Feng2017, p. 456) can be used to rank entities.
Nonetheless, CTAs do allow at the stage of data analysis the possibility of including a ‘human-in-the-loop’ to parameterise different settings that eventually have a bearing on the results. The ROBERT protocol, for instance, specifies that while a user is qualified as being ‘at risk of exposure’ if she has been in the vicinity of a certain number of infected user(s) during the past CT days, additional criteria such as proximity to the infected user or the duration of the contact can be defined by the health authority, and further used to define the risk-scoring function running in the back end of the application (Castelluccia et al., Reference Castelluccia2020, p. 2).
3.2 Encoding and data analysis
Encoded information such as that produced by CTAs can only be read and analysed by a computer program that supports the specific type of encoding, depending on the app's software and system design. Take the two types of computing capabilities that CTAs use to analyse data, namely centralised (e.g. central servers) or decentralised (users’ phones) solutions. The main distinction between centralised and decentralised CTAs is the ability of central-authority access to encounter data when using a centralised approach. In centralised solutions, there are no technological barriers that could reliably block someone with sufficient developer access and permission from the owner from accessing the data. As mentioned earlier, this is because pairings of unique IDs, encounter IDs and phone numbers are known to the central server, even if they are pseudonymised. Therefore, an inquisitive database admin person could find out a personal identifier (phone number) of a person who was infected and everyone they met.
In contrast, in decentralised systems like the GAEN protocol, the system design ensures that there is no risk of identification of the person met (Apple and Google, 2020). There still is the risk that the person uploading data can be identified from server connections through IP addresses, but this is a smaller risk. Moreover, since every user of the app receives unique IDs (that change daily and are anonymous) of every other user, the knowledge of ‘who met whom’ is essentially inaccessible (Apple and Google, 2020). Hence, the information obtained from the data encoded into the central servers is limited in decentralised systems. The metadata about server connections (e.g. the IP address of the phone sending the data) are supposed to be scrubbed clean and not stored. The only data being saved are therefore a set of unique IDs that are sent to every user daily. As a result, server operators do not have special information (compared to users) as long as they are honest about metadata erasing. This being said, centralised systems offer much more to the owner of the server. Since data about encounters are uploaded and servers track who met whom, this allows the server owner to create representations of information, such as through social graphs and heat maps.
3.3 Computational indicators and graph representations
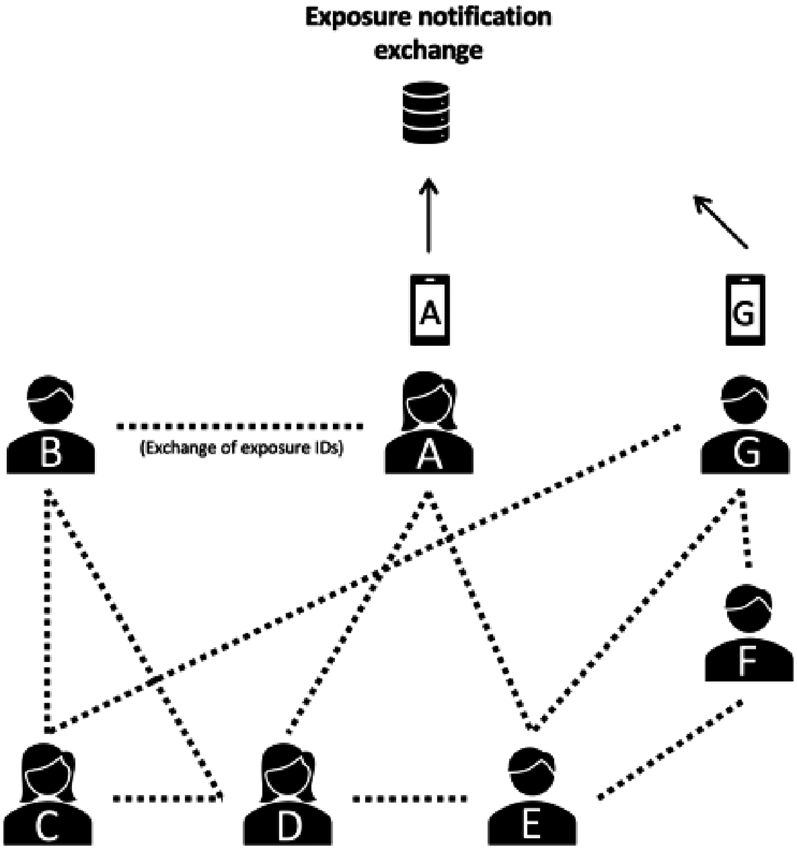
Computational indicators enable and facilitate the representation of information through social graphs. The computational capabilities of centralised CTAs allow them to extract information from large amounts of data and represent it through graphs, unveiling patterns and relations between entities that would otherwise be difficult to identify. Figure 2 depicts an example of a scenario in which persons A and G upload their exposure data (indicated as a dotted line) to a central exposure-notification server. This is a scenario depicting a centralised system based on a Bluetooth handshake without any location data.
Central exposure notification

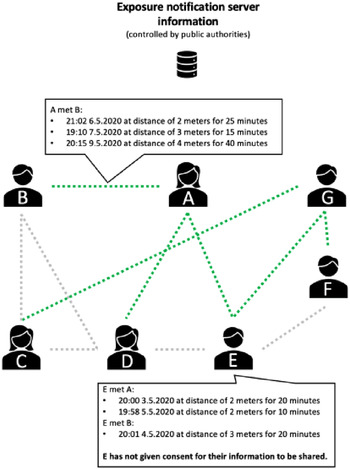
In contrast, Figure 3 shows the insights gathered by a central server based on the scenario in Figure 2. Since the metadata of exposure and exposure keys are sent, it means that the server can track all users that met with A or G, the timestamps and approximate durations of their meetings, and a proxy for a distance (based on the Bluetooth signal strength). Thus, the central server has information about person E, who uses the app, but has not given permission to upload their data. Yet, the central server can collect and track person E based on data provided by others (who met them). Moreover, if four people (B, D, E, G) upload their data, the whole network will be known by the server. Generalising this idea means that users uploading their data ‘uncover’ a disproportionate area on the social graph (i.e. a network of all handshakes happening) to the central server with some users never uploading anything themselves. The underlying issue is the access of the server to the identity of people not uploading the data and the ability to combine datasets from various uploaders (e.g. persons A and G).
Insights gathered by the central server

Moreover, if the data of CTAs are aggregated with mobile and tower-location data, as in the COVID-19 mass surveillance programme in Israel (Amit et al., Reference Amit2020, pp. 1167–1169), social graphs can be used to provide unique insights into movements of populations. This poses a serious threat to the rights and freedoms of individuals – because it allows the identification at a very granular level of the trajectories of persons and their encounters – and to the rule of law – because it can easily function creep into tools of mass surveillance (Zuboff, Reference Zuboff2019; Reference Zuboff2015, pp. 75–89). In the UK, 177 scholars and security experts issued a joint letter to warn the government about the dangers resulting from the design of the app originally proposed by the National Health System service NHSX, which used a centralised solution. They warned that ‘with access to the social graph, a bad actor (state, private sector, or hacker) could spy on citizens’ real-world activities’ (Albrecht et al., Reference Albrecht2020, p. 1). Finally, social graphs could be subject to a ratchet effect, where governments could use them for other types of surveillance such as to conduct investigations related to social fraud, tax avoidance and petty crimes.
The dangers that wide governmental surveillance is built on the back of contact tracing after the COVID-19 pandemic is far from unreal and distant. Public authorities everywhere are increasingly tempted to aggregate and enrich data sources used during the pandemic, as well as to centralise their control and use to ensure further epidemiological surveillance, such as in relation to vaccination and the emergence of new variants of the virus. As an example, Article 8 of an executive decree passed in Belgium on 12 January 2021 allows the National Social Security Agency
‘as a subcontractor on behalf of all services and institutions responsible for the fight against the spread of the coronavirus COVID-19, as well as all services or institutions responsible for monitoring compliance with the obligations set out in the emergency measures taken to limit the spread of the coronavirus COVID-19, collect, combine and process, including through datamining and datamatching, health-related data on the COVID-19 coronavirus, contact, identification, work and residence data on employed and self-employed workers to support cluster and community tracking and review.’Footnote 4
This sort of legislation – which is spreading everywhere – shows that the risk of an expansive use of contact-tracing data is real. Therefore, it is of utmost importance that appropriate safeguards are in place to ensure that the data that CTAs collect will not be used for other purposes and to ensure that state agencies tasked with data processing are accountable, while keeping strong checks and balances.
3.4 Law into technologies: implementing PMR through CTAs
CTAs are also being used in the context of the COVID-19 pandemic for purposes other than to collect epidemiological data, such as to provide entitlements and enforce PMRs. In France, TousAntiCovid integrates a feature for individuals to obtain a ‘derogatory certificate’ and prove their right to exit their domicile during lockdown periods (Ministry of Interior of France, 2020). The app uses personal information preregistered in the phone such as name and date of birth, and then produces a QR code to be used in case of police checks. In Belgium, the app Coronalert allows the booking of a COVID-19 test without consulting a general practitioner if the user receives a notification of ‘high risk of exposure’, as well as obtaining directly the results via the app's interface (L'Echo, 2020). Although these CTAs do not seem for the moment to use the data collected through these functionalities to enforce PMRs, other countries are already doing so.
In the UK, the NHS COVID-19 app – which has more than 20 million users – includes a countdown feature that sets the number of days for which a person must self-isolate ‘depending on the reason you're self-isolating’:Footnote 5 receiving a ‘close contact’ alert, having symptoms and receiving a negative/positive test. Although the app does not communicate a violation of the self-isolation period to public authorities, it sends a notification to the user at the end of the self-isolation period so that s/he can resume their normal activities.Footnote 6 In Taiwan, the CTA uses geolocation data to control the respecting of quarantine measures and can trigger fines and police checks at the domicile if the app is disconnected or the phone leaves the domicile (Hui, Reference Hui2020). In Poland, in addition to the CTA ProteGO Safe, the government introduced a compulsory app (Kwarantana domowa) for enforcing quarantine measures. The app uses data such as a person's ID, name, residence address and photo, and relies on ‘geolocation and face recognition technology to ensure that relevant people are quarantined’ (Norton Rose Fulbright, 2020b). In Korea, to monitor violations of quarantine measures, the government opted for the use of electronic wristbands connected to the CTA, so people cannot trick the system by leaving their phones at home (Suzuki, Reference Suzuki2020).
These developments seem to accelerate the movement towards a form of law into technologies, where legal prescriptions are collapsed into mathematical models (Restrepo Amariles and Lewkowicz, Reference Restrepo Amariles and Lewkowicz2020; Restrepo Amariles, Reference Restrepo Amariles, Frydman and van Waeyenberge2014), computing devices and code (Restrepo Amariles and Lewkowicz, Reference Restrepo Amariles and Lewkowicz2020; Restrepo Amariles, Reference Restrepo Amariles and Barfield2021; Hassan and De Filippi, Reference Hassan and De2017). I use the notion of law into technologies in contrast to those of law in books – where legal prescriptions are defined by statutes and other formal legal sources, and law in action – where legal prescriptions are equated to the social rules effectively followed by individuals in a given context (Nelken, Reference Nelken1984; Pound, Reference Pound1910, p. 30). In this case, CTAs would not just be a ‘soft mechanism of surveillant control’, as Yeung defines the big-data hypernudging (Reference Yeung2017, p. 129), but rather a hard form of social control whereby rules intended to guide behaviour are explicitly embedded in the ADS and enforced through the app.
The movement towards law into technologies poses a serious risk to the rule of law and requires careful scrutiny. Consider the technological-ecosystem CTAs built (networks, knowledge and infrastructure) and which make global surveillance viable. In terms of networks, CTAs brought together actors across the globe from the private and public sectors. It made Google and Apple collaborate to develop the GAEN and European researchers to implement the Pan European Privacy-Preserving Proximity Tracing (PEPP-PT) initiative. More importantly, governments worked with local firms to develop CTAs, which in turn relied on technologies licensed by multinational companies or made available by international networks of researchers. In terms of knowledge, CTAs generated new protocols (e.g. DP-3T), programming languages (e.g. interoperability) and models (e.g. SEIR), while developing a global infrastructure supported by new developments in OS, software applications, servers and APIs.
If CTAs as such are unlikely to become perennial tools of surveillance, the underlying developments are undoubtedly here to stay. On the one hand, the protocols, software and languages supporting these applications will continue to evolve. For instance, the ROBERT protocol has already been updated ten times and, with every update, new features are included, transformed or eliminated.Footnote 7 These transformations make this and other protocols suitable for novel and more advanced applications. On the other hand, the actors involved in the development of CTAs will not dismiss the knowledge and resources that have become available. For instance, Apple announced that its iOS 13.7 and later versions ‘can inform people of potential exposure to COVID-19 without a dedicated Exposure Notifications app’ (Apple, 2020). Although this option is only available when a public health authority supports it, it signals the power of technological actors to implement functionalities that enable novel forms of social control, and thus to ultimately shape law as it becomes embedded into technology.
4 Conclusion
This paper shows through the analysis of CTAs the increasing role that technology and data – and especially their intertwinement – play in the exercise of social control. On the one hand, it shows that the capabilities of CTAs generate technology-charged data and enable a new generation of computational indicators, which can be personalised and produced in real time. On the other hand, it shows that technological developments such as CTAs have an impact on the rights and obligations of individuals, such as when they are used to inform the implementation of the TTI strategy – thereby allowing authorities to identify and prioritise who must get tested and treated – or when they are directly employed to enforce laws on individuals according to their specific (epidemiological) status – including the imposition of physical restrictions, such as the prohibition to leave one's domicile.
However, CTAs underline a more general shift in the means and ways in which social control is and will increasingly be exercised: a shift from social facts to digitally recorded data, from handcrafted to computational indicators, from legal rules to computer protocols and programming languages, from practical reasoning to mathematical models, and from enforcement agencies to enforcement technologies. These changes signal the emergence of what I called law into technologies; it requires that all of us, and particularly from policy-makers and legal operators, place technological developments and data-driven tools in context. This is the best way to benefit from the advantages that these new developments will offer while unveiling their flaws, dangers and limitations.
Conflicts of Interest
None
Acknowledgements
I would like to thank Jan Lukeš for his valuable research assistance, and Matteo Winkler and Rajaa El Hamdani for their comments to previous drafts. This research was made possible thanks to the grant of the HEC Foundation for the project SMART Law: Scientific, Mathematical, Algorithmic, Risk and Technology-driven Law. I am thankful for their support.