Narrative competence, defined as the ability to comprehend and produce narratives, is a complex ability that involves the encoding and interpretation of information and organization of this information in a coherent mental representation (Kintsch, Reference Kintsch1988; Levelt, Reference Levelt1989). To date, research on narrative competence and development has mainly focused on monolingual children (e.g., Lever & Sénéchal, Reference Lever and Sénéchal2011; Oakhill & Cain, Reference Oakhill and Cain2012; Silva, Strasser, & Cain, Reference Silva, Strasser and Cain2014) and mainly on Spanish/English bilingual children living in the United States (e.g., Fiestas & Peña, Reference Fiestas and Peña2004; Squires et al., Reference Squires, Lugo-Neris, Peña, Bedore, Bohman and Gilliam2014; but see also Iluz-Cohen & Walters, Reference Iluz-Cohen and Walters2012). The present paper contributes to the previous literature by focusing on the narrative competence of Italian–English sequential bilinguals aged between 5 and 7 years.
Research on narrative competence and its development is important for several reasons. First, narratives are pervasive in children's lives from an early age, and narrative competence is crucial to communicate social messages to others and to derive meaning from experience (Bruner, Reference Bruner1986; Nelson, Reference Nelson2007). Second, narrative competence has been shown to be related to later children's literacy development and school success (e.g., Oakhill & Cain, Reference Oakhill and Cain2012; O’Neill, Pearce, & Pick, Reference O’Neill, Pearce and Pick2004; Pearson, Reference Pearson, Oller and Eilers2002). Third, and particularly relevant for the present work, narratives are an efficient way to obtain rich information not only about story structure but also about a child's language. These qualities of narrative have prompted educators and speech–language pathologists to use narratives in the assessment process with both monolingual and bilingual children (Iluz-Cohen & Walters, Reference Iluz-Cohen and Walters2012; Pearson, Reference Pearson, Oller and Eilers2002; Squires et al., Reference Squires, Lugo-Neris, Peña, Bedore, Bohman and Gilliam2014). To date, however, data regarding the narratives of bilingual children are lacking.
The present paper makes two main contributions. First, the development of narrative competence (i.e., narrative production and comprehension) and differences/relations between first language (L1) and second language (L2) are analyzed in a population that has not been studied yet: bilingual children who have Italian as their L1 and are acquiring English as an L2, but not as a majority language. This contrasts with most of the studies on narrative competence in bilingual Spanish children who have English as their L2, in contexts where English is the majority language (e.g., Squires et al., Reference Squires, Lugo-Neris, Peña, Bedore, Bohman and Gilliam2014; Uccelli & Páez, Reference Uccelli and Páez2007). Second, narrative competence was assessed using a new methodological paradigm: the Multilingual Assessment Instrument for Narratives (MAINFootnote 1; Gagarina et al., Reference Gagarina, Klop, Kunnari, Tantele, Välimaa and Balciuniene2012; see Gagarina, Klop, Tsimpli, & Walters, Reference Gagarina, Klop, Tsimpli and Walters2016 [this issue]). The MAIN allows assessment of narrative comprehension and production in the context of two tasks: fictional story telling based on a sequence of pictures and story retelling, based on a second, structurally similar sequence of pictures associated with a story narrated by the experimenter. The paradigm is used in the present study to examine the effects of age, language, and task on bilingual children's narrative production and comprehension, specifically the macrostructure of the stories and the understanding of implicit story information (i.e., mental states and goals).
Literature related to the variables just outlined is reviewed in the next sections. The literature on monolingual children is presented, with a focus on developmental changes and relations between narrative production and comprehension and differences between story telling and retelling tasks. This is followed by a review of the literature on bilingual children, which focuses on the relations between narrative production and comprehension in L1 and L2.
RESEARCH ON NARRATIVE COMPETENCE AND DEVELOPMENT IN MONOLINGUAL CHILDREN
One important linguistic development that occurs between 4 and 10 years is children's growing ability to produce and comprehend increasingly more complex texts, in particular narratives (e.g., Florit, Roch, & Levorato, Reference Florit, Roch and Levorato2014; Lever & Sénéchal, Reference Lever and Sénéchal2011; Oakhill & Cain, Reference Oakhill and Cain2012; Pearson, Reference Pearson, Oller and Eilers2002). For the purposes of the present paper, research on narrative production of fictional narratives and the ability to organize story elements at the macrostructure level was considered. A classic story, according to story grammar models, is structured according to temporal relations, includes causal links between the actions and the characters’ motivations, and provides sufficient background information (Peterson, Reference Peterson1994). According to Stein and Glenn (Reference Stein, Glenn and Freedle1979), the macrostructure of a narrative includes the following elements or categories: the introduction, which provides the setting and describes the characters of the story; the initiating event, which provides an action or event that sets up a problem or dilemma for the story and determines the character goal/s; attempts, which are used by the character to achieve the goal/s; and the outcome of the attempts or resolution. Consequences and characters’ reactions to the final outcome are usually included in more sophisticated stories.
Research on monolingual children has shown that at 5 years of age, typically developing children have acquired a basic knowledge or schema of stories (Trabasso, Stein, & Johnston, Reference Trabasso, Stein, Johnson and Bower1981) and are able to produce narratives that include more than two sequentially connected elements; however, these stories often end abruptly, without proper conclusions (Peterson & McCabe, Reference Peterson and McCabe1983). Five-year-olds also tend to focus mainly on concrete events, while their ability to include characters’ mental states and motives is emerging. At about 6 years of age, children are able to create a narrative with a sequence of events that is purpose oriented: stories include an initiating event, goal-directed actions, and consequences (Berman, Reference Berman1988). Children's ability to organize narratives continues to develop during primary and secondary school; older children include more events, mental states, and temporal and causal relations between events than do younger ones (Stein & Glenn, Reference Stein, Glenn and Freedle1979).
Different types of tasks have been used to analyze narrative production of monolingual children (Lever & Sénéchal, Reference Lever and Sénéchal2011), with two types dominating: story retelling and story telling. In a story retelling task, participants are told a story and then asked to retell it. In story telling tasks, participants are asked to produce a fictional narrative based on an initial prompt. Lever and Sénéchal (Reference Lever and Sénéchal2011) investigated the influence of task on narrative production. They compared story telling and story retelling with parallel materials, as one of the aims of a broader study on 5- and 6-year-olds. Results showed that all children produced narratives that were significantly longer, better structured, and had more mental state references in the story retelling task than in the story telling task. The authors provided explanations for these findings. They proposed that the two tasks varied in their processing demands, with the story retelling task having lower demands than the story telling task. According to this explanation, children might include more structural elements when they are asked to retell a story because they can rely on the story previously narrated by the experimenter, stored in the episodic memory. In contrast, a story telling task (based on pictures) imposes higher processing demands, because narrators must identify relevant information, decide upon relations between information, and establish the order in which information should be presented. Lever and Sénéchal suggest that the two narrative tasks might involve different cognitive skills; story telling involves a constructive process, whereas story retelling, which relies on the comprehension of a previous story, is based on reconstructive processes through which characters, thoughts, and motives may be reproduced.
Several studies have shown that narrative production and comprehension are related. For instance, some studies have shown that primary school children who have difficulty understanding narrative texts also have difficulty in producing coherent fictional narratives (Cain, Reference Cain2003; Cain & Oakhill, Reference Cain and Oakhill1996). Narrative production in kindergarten is longitudinally related to the ability to understand narrative texts in primary school (Roth, Speece, & Cooper, Reference Roth, Speece and Cooper2002). These results suggest that narrative production and comprehension share the ability to construct a coherent representation of the meaning of a story. To our knowledge, there are no studies that have compared the relation between comprehension and production using both story telling and story retelling tasks.
RESEARCH ON NARRATIVE COMPETENCE AND DEVELOPMENT IN BILINGUAL CHILDREN
Studies on bilingual children have shown that the ability to produce narratives in both L1 and L2 develops from preschool to school age (Gutiérrez-Clellen, Reference Gutiérrez-Clellen2002; Pearson, Reference Pearson, Oller and Eilers2002; Squires et al., Reference Squires, Lugo-Neris, Peña, Bedore, Bohman and Gilliam2014; Uccelli & Páez, Reference Uccelli and Páez2007). Longitudinal studies carried out by Squires et al. (Reference Squires, Lugo-Neris, Peña, Bedore, Bohman and Gilliam2014) and Uccelli and Páez (Reference Uccelli and Páez2007) suggested that bilingual children, attending kindergarten and first grade, follow the same developmental pattern as monolingual children as far as macrostructure is concerned. Squires et al. (Reference Squires, Lugo-Neris, Peña, Bedore, Bohman and Gilliam2014) analyzed the macrostructure of stories retold by children with typical development and with language impairment in Spanish (L1) and English (L2). Results showed that first graders with typical development included more references to characters, initiating events, and internal responses in both L1 and L2 compared to kindergarteners. Uccelli and Páez (Reference Uccelli and Páez2007) asked low socioeconomic status (SES) children to tell a story in Spanish (L1) and English (L2) and collected multiple measures of narrative productivity and quality. In both languages, children's macrostructure scores, which contributed to a global measure of narrative quality, improved from kindergarten to Grade 1. Narrative productivity (i.e., the length of the narratives), however, did not increase in the same age range.
Research on bilinguals has also considered associations between narrative skills in the L1 and L2. Previous research showed that, overall, children displayed better narrative production and comprehension in L2 than in L1 (Fiestas & Peña, Reference Fiestas and Peña2004; Gutiérrez-Clellen, Reference Gutiérrez-Clellen2002; Pearson, Reference Pearson, Oller and Eilers2002; Squires et al., Reference Squires, Lugo-Neris, Peña, Bedore, Bohman and Gilliam2014; Uccelli & Páez, Reference Uccelli and Páez2007). Regarding narrative production, the longitudinal studies of Squires et al. (Reference Squires, Lugo-Neris, Peña, Bedore, Bohman and Gilliam2014) and Uccelli and Páez (Reference Uccelli and Páez2007) showed that bilingual children obtained higher performance in English (L2) than in Spanish (L1) on both retelling and telling tasks. Better narrative production in L2 was attributed to the loss of L1 during the acquisition of the societal language (Squires et al., Reference Squires, Lugo-Neris, Peña, Bedore, Bohman and Gilliam2014; Uccelli & Páez, Reference Uccelli and Páez2007). Similarly, Pearson (Reference Pearson, Oller and Eilers2002) found that second and fifth graders performed better on macrostructure measures when telling stories in English, their L2, than in Spanish. Gutiérrez-Clellen (Reference Gutiérrez-Clellen2002) likewise found that second graders performed better in English (L2) than in Spanish (L1) on a story retelling task and on a narrative comprehension task, but better performance in English was not obtained for the story telling task. It should be noted, however, that parallel materials were used only in the telling and comprehension tasks.
Previous research has also shown moderate cross-linguistic associations for narrative production; measures of macrostructure in L1 and L2, obtained using retelling and telling tasks, were related in first grade but not in kindergarten (Fiestas & Peña, Reference Fiestas and Peña2004; Squires et al., Reference Squires, Lugo-Neris, Peña, Bedore, Bohman and Gilliam2014; Uccelli & Páez, Reference Uccelli and Páez2007). Explanations for the results pointed out that there could be a shared conceptual knowledge on macrostructure of stories across L1 and L2, and this might facilitate cross-linguistic transfer while more experience (e.g., through schooling) is acquired in both languages.
THE PRESENT STUDY
The present study makes two main contributions. First and foremost, narrative production and comprehension of Italian–English sequential bilinguals were analyzed in order to identify the following:
1. developmental differences between preschool (5–6 years) and first grade (6–7 years),
2. differences and associations between L1 (Italian) and L2 (English), and
3. differences and associations between performance on story telling and retelling tasks.
Second, these differences and relations were assessed using a new methodological paradigm with parallel materials, namely, sequences of pictures having the same number of structural elements and the same structural complexity.
The expectations for each of the three points listed for the first contribution follow. First, narrative production was expected to develop from preschool to first grade as shown by studies on monolinguals and bilinguals (e.g., Berman, Reference Berman1988; Squires et al., Reference Squires, Lugo-Neris, Peña, Bedore, Bohman and Gilliam2014; Stein & Glenn, Reference Stein, Glenn and Freedle1979; Uccelli & Páez, Reference Uccelli and Páez2007). Moreover, we expected narrative comprehension to develop in our bilingual participants, in line with studies of monolinguals (e.g., Florit et al., Reference Florit, Roch and Levorato2014).
Concerning performance in the L1 and L2, better performance for both narrative production and comprehension was expected in Italian, the children's L1 and the majority societal language (e.g., Gutiérrez-Clellen, Reference Gutiérrez-Clellen2002; Squires et al., Reference Squires, Lugo-Neris, Peña, Bedore, Bohman and Gilliam2014; Uccelli & Páez, Reference Uccelli and Páez2007). Second, narrative production in L1 was expected to correlate with L2 production in first grade, but not in kindergarten (e.g., Squires et al., Reference Squires, Lugo-Neris, Peña, Bedore, Bohman and Gilliam2014; Uccelli & Páez, Reference Uccelli and Páez2007). Specific predictions could not be formulated for narrative comprehension given that studies on bilinguals reviewed in the Introduction did not analyze cross-linguistic associations of this skill.
With respect to task, better performance for narrative production was expected in retelling than in telling, as shown by research on monolinguals that used tasks with parallel material (e.g., Lever & Sénéchal, Reference Lever and Sénéchal2011). Specific predictions concerning differences between tasks could not be formulated for comprehension. Narrative production and comprehension were also expected to be associated as shown by research on monolinguals (e.g., Cain, Reference Cain2003). In particular, given that retelling task relies on the comprehension of a previous narrated story, stronger associations were expected for the retelling task.
METHOD
Participants
Study participants were 62 Italian–English bilingual children attending English international schools in northeastern Italy. Thirty “younger” children attended the last year of kindergarten (mean age = 5 years, 5 months [5;5], SD = 3 months, range = 5–6 years) and 32 “older” children attended the first year of primary school (mean age = 6;6, SD = 4 months, range = 6–7;2 years). Children were sequential bilinguals: the mean age of first exposure to English was 3 years, 3 months (SD = 1 month) for the younger group and 3 years, 6 months for the older group (SD = 2 months). At the time of the study, they were exposed to English daily at school for approximately 8 hr. They belonged to middle- to high-SES families. Children's parents completed a short questionnaire investigating the amount of linguistic input in L1, L2, and other languages at home. At home, 71% of participants had been exposed exclusively to Italian. The remaining 29% were exposed to a mixture of languages: Italian and English in 98% of cases, and a third language in 2% of cases.
All participants were administered the Peabody Picture Vocabulary Test (PPVT) in Italian (Stella, Pizzoli, & Tressoldi, Reference Stella, Pizzoli and Tressoldi2000) and in English (Dunn & Dunn, Reference Dunn and Dunn1981). The raw scores were transformed to standardized scores provided by the test manual (M = 100, SD = 15). The participants’ average score was 92.8 (SD = 13) for the Italian test and 90.4 (SD = 11) for the English test, which indicates that, on average, participants had age-appropriate vocabulary scores in both languages.
Children were also presented with the nonverbal picture arrangement subtest of the Wechsler Intelligence Scale for Children (Italian adaptation by Orsini & Picone, Reference Orsini and Picone2006). Standardized scores (M = 10, SD = 3) were considered. All the participants showed age-appropriate nonverbal ability: the mean score was 10.1 (SD = 2.3).
Materials and procedures
Testing
Wordless picture stories from the MAIN (Gagarina et al., Reference Gagarina, Klop, Kunnari, Tantele, Välimaa and Balciuniene2012) were adopted in order to examine narrative competence of children through story telling and story retelling tasks, which were followed by open-ended comprehension questions on the story content. Children were tested in both Italian and English. Each participant was presented with four wordless elicitation picture sets that had the same story structure: two in Italian (one for the story telling task and the other for retelling) and two in English (again, for story telling and retelling).
The presentation of the two stories for story telling (“Baby Birds” and “Baby Goats”) and the two stories for retelling (“Dog” and “Cat”) was balanced across the two languages. Children were first tested in English (all the tasks) and then in Italian (all the tasks). The telling and retelling tasks were always presented in separate sessions, but the order of task presentation was randomized (e.g., telling first vs. retelling first). Each production task (telling and retelling) was followed by a set of open-ended comprehension questions on the story content.
In the story telling task, the child was shown six pictures, and than two per time, and was asked to produce a story. After the child had told the story, s/he was asked nine comprehension questions on story content. In the retelling task, the child was presented with the story on headphones, while six pictures, two by two, were presented on the computer screen. Then the child was asked to retell the story to the experimenter who did not know it, while pictures were shown on the computer; finally, the child was asked the nine story comprehension questions.
The two sets of pictures (i.e, Baby Goats and Baby Birds for the telling and Dog and Cat for the retelling) have the same story structure. Each story is composed of three episodes each and contains the same macrostructural elements within each episode (initial mental state, character's goal, characters attempt at achieving goal, outcome of attempt, and mental state as a reaction). The difference between the telling and the retelling task is the elicitation procedure: a spontaneous production from pictures in the telling and the production of a previously heard story in the retelling. Finally, each story elicitation set is followed by nine comprehension questions concerning character's goals and mental states. The similar story structure of the two tasks allows a direct comparison of different aspects of narrative competence in two languages, namely, story telling and comprehension on one hand, and story retelling and comprehension on the other.
Coding and scoring
During task administration the story productions were recorded using a digital audio recorder (EDIROL R-09HR) and subsequently transcribed and coded by two trained postgraduate students. All complete and intelligible utterances were included in the analyses. Single words that were code-switched to the nontarget language were included in the macrostructure analyses while entire sentences or discourse in nontarget languages were excluded.
The MAIN scoring rubric (Gagarina, et al., Reference Gagarina, Klop, Kunnari, Tantele, Välimaa and Balciuniene2012) was adopted for the coding of macrostructure and comprehension. For each task (telling and retelling), four scores were calculated: three for macrostructure of narrative production and one for narrative comprehension. The scores are briefly described below.
NUMBER OF MACROSTRUCTURE ELEMENTS
Each story elicitation set was formed by two setting elements (time and place) and three episodes, each of which included five macrostructural elements: the character's initial mental state, his goal, the attempt and the outcome, and the consequence consisting of the mental state of the character. Each macrostructure element produced by the child was scored 1 point, and this gives a maximum macrostructure elements score of 17 for each of the four stories. Given the design of the MAIN, and of this study, four macrostructure elements scores were obtained: two for the story telling task (one for Italian and one for English) and two for the retelling task (again, one for Italian and one for English).
NUMBER OF MENTAL STATE TERMS
According to the MAIN (Gagarina et al., Reference Gagarina, Klop, Kunnari, Tantele, Välimaa and Balciuniene2012), mental state terms are coded within the total macrostructure elements score, but are also counted separately given that the presence of mental state terms in narratives are a good indicator of the linguistic complexity of story production (e.g., Lever & Sénéchal, Reference Lever and Sénéchal2011; Squires et al., Reference Squires, Lugo-Neris, Peña, Bedore, Bohman and Gilliam2014). According to the scoring rubric of the MAIN, two mental states are possible for each of the three episodes, and each is scored 1 point, resulting in a maximum score of 6 points for each story set. Four mental state scores were obtained: two from the telling task and two from the retelling task, each in Italian and English.
LEVEL OF MACROSTRUCTURAL COMPLEXITY
Alongside the count of macrostructure elements, which represents a general and single quantitative measure of story production, the MAIN allows one to score the complexity of story production (for both telling and retelling tasks). The complexity score ranges from low to high, based on the relations among the macrostructure elements of goal, attempt, and outcome. Low complexity implies the presence of two elements, namely, one attempt and one outcome within at least one of the three episodes of a story; medium complexity implies the presence of two elements, namely, one goal and one attempt or one goal and one outcome, within at least one of the three episodes of a story, and is considered more complex because characters’ goals are mentioned by the children; and high complexity implies the presence of a complete sequence of three relevant elements, namely, one goal, one attempt, and one outcome, mentioned within at least one episode of a story. For each participant, the highest level of complexity reached for each task and in each language was identified. Low, medium, and high complexity levels were scored as 1, 2, and 3, respectively. When the story production did not include at least one attempt and one outcome, its complexity was classified as 0. Four macrostructural complexity scores were calculated, one for each task (telling and retelling) for each of the two languages (Italian and English).
COMPREHENSION SCORE
The comprehension score is a sum of correct answers to a set of nine open-ended comprehension questions administered after each task (telling and retelling). The comprehension questions elicit implicit information such as mental states and goals of story characters. For every correct answer 1 point was given, yielding a maximum comprehension score in each elicitation set of 9 points. Four comprehension scores resulted, given that the story was told and retold in Italian and in English.
Transcription and coding reliability
Two Italian postgraduate student assistants, fluent in Italian and English, were trained in the transcription and coding procedures by the first author. Each assistant collected, coded, and scored approximately 50% of story productions and comprehension sheets independently, and together resolved uncertainties in coding. Nearly 30% of narratives (story tellings and retellings), half in Italian and half in English, were randomly selected to be transcribed, segmented, and coded independently by the first author.
Transcription accuracy was established by calculating the total number of agreed-upon words divided by the total number of words for both coders. Interrater agreement for transcriptions was expressed through the percentage of agreement, which was as follows: story telling Italian 93.8%, and English 92.3%; story retelling Italian 94.3%, and English 95.7%. These values indicate an excellent level of transcription reliability.
The children's productions and answers to comprehension questions were transcribed and scored using the MAIN rubric (Gagarina, et al., Reference Gagarina, Klop, Kunnari, Tantele, Välimaa and Balciuniene2012). Nearly 30% of the narratives and comprehension sheets (half Italian and half English, half tellings and half retellings) were randomly selected and scored by the first author. A Cohen κ value was calculated for each of the four scores to evaluate intercoder reliability. For the number of macrostructure elements in story telling, κ = 0.90 for Italian and 0.95 for English, while in retelling κ = 0.90 for Italian and 0.93 for English, indicating excellent interrater reliability. For the number of mental state terms in story telling, the value was 0.93 for both Italian and English, and 0.80 for Italian and 0.93 for English story retellings; again, the values indicated excellent interrater reliability. For the comprehension score in story telling, the values were also high at 0.83 for Italian and 0.91 for English, while for retellings the values were 0.96 for Italian and 0.87 for English. Finally, for the level of macrostructural complexity, values were 0.55 and 0.78 for Italian and English story telling and 0.78 and 0.55 for Italian and English story retelling, indicating moderate to good interrater reliability.
Analytic plan
Before conducting the analyses aimed to answer our research questions, receptive vocabulary scores, measured through PPVT, were compared in LI and L2 in order to examine potential differences in proficiency, and correlations of the vocabulary scores with the dependent variables were examined in order to assess whether the vocabulary scores should serve as a control variable in subsequent analyses.
In order to answer our research questions, performance of children of the two age groups for the four measures of narrative competence were compared in function of the two different tasks in both languages. That is, three separate three-way mixed analyses of variance (ANOVAs) were carried out on the dependent variables (number of macrostructure elements, number of mental state terms, comprehension score) with Age (two levels: younger 5–6 and older 6–7) × Language (2 levels: Italian and English) × Task (two levels: telling and retelling) as independent variables. Age was a between-subject factor while task and language were within-subject factors. Chi-square tests on the frequency of the four story macrostructural complexity levels were carried out for each of the two tasks (telling and retelling) with age (younger 5–6 and older 6–7) and languages (Italian and English) serving as independent variables.
Finally, a Pearson correlation matrix was computed on measures of narrative production (number of macrostructure elements and comprehension score)Footnote 2 in order to explore correlations within and between the two languages (Italian and English); and within and between the two tasks (story telling and story retelling).
RESULTS
Preliminary analyses
Mean raw score on the Italian and English PPVT was compared in the younger and older group. The results of ANOVA revealed a significant main effect of language, F (1, 60) = 145.8, p < .001, η2 = 0.708, with higher receptive vocabularies for Italian than for English. There was also an effect of age, F (1, 60) = 11.4, p < .001, η2 = 0.160, with older children having higher receptive vocabularies than younger ones. The interaction between language and age was not significant, F (1, 60) = 0.829, p = .366, indicating that differences in vocabulary sizes in the two languages were stable across the two age levels. Subsequently, differences between the two vocabulary sizes were calculated, and showed a mean difference between the Italian and English vocabulary size of 24 words (22 words for younger and 26 for older). This score, named L1-L2 vocabulary size difference, was correlated with the four scores of narrative competence (three for narrative production at a macrostructure level and one for comprehension). The only significant correlation found was between L1-L2 vocabulary size difference and the number of mental state terms in Italian retellings (r = .369, p < .05); as the advantage of L1 over L2 vocabulary increased, so did the number of retold mental state terms. Based on the general lack of significant correlations, receptive vocabulary was not included in subsequent analyses. This decision was further supported by the generally age-appropriate standard scores on both the English and Italian PPVT; based on these, we felt quite confident that participants’ receptive vocabulary was sufficient to produce and comprehend narratives in both languages.
The analyses aimed to answer the research questions follow. Results for narrative production are presented, with results for each dependent variable in a separate paragraph. These are followed by the results concerning comprehension.
Number of macrostructure elements
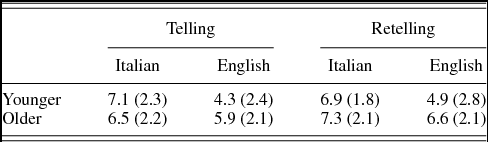
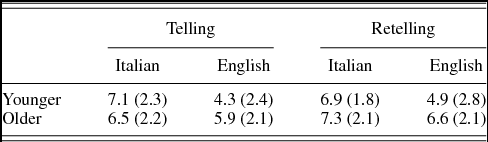
Table 1 presents the mean number of macrostructure elements by the three factors of group (younger and older), task (story telling and retelling), and language (Italian and English). ANOVA revealed that all three factors had a significant effect on the number of macrostructure elements produced: age, F (1, 58) = 3.99, p < .05, η2 = 0.064; language, F (1, 58) = 22.91, p < .001, η2 = 0.283; and task, F (1, 58) = 6.99, p < .01, η2 = 0.108. The significant effect of age showed that older children outperformed the younger ones. The language effect revealed that, in general, more macrostructure elements were provided in Italian than in English. The significant Language × Age interaction, F (1, 58) = 8.22, p < .01, η2 = 0.124, indicated that on average younger children produced significantly more macrostructure elements in Italian than in English, while the difference for the older children was not large enough to be significant. The significant effect of the factor task showed that more macrostructure elements were produced in story retelling than in story telling. The other two-way interactions and the three-way interaction did not yield significance (F < 1 and p > .35 in all cases).
Means (standard deviations) for number of macrostructure elements (maximum score = 17)
Number of mental state terms
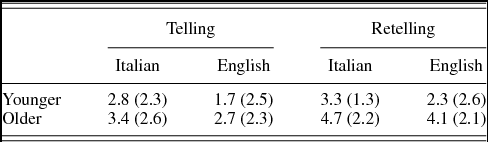
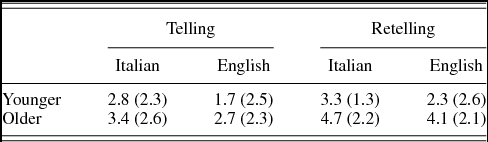
Table 2 presents the mean number of mental state terms by the three factors of group (younger and older), task (story telling and retelling), and language (Italian and English). The ANOVA run on the number of mental state terms showed that all three main factors were significant: age, F (1, 58) = 8.66, p < .01, η2 = 0.130; language, F (1, 58) = 12.09, p < .01, η2 = 0.173; task, F (1, 58) = 18.52, p < .001, η2 = 0.242. The significant effect of age showed that older children produced more mental state terms than younger ones. The significant main effect of the factor language indicated that more mental state terms were produced in Italian than in English. Finally, the significant effect of the factor task suggested that the story retelling task elicited more mental state terms with respect to the story telling task. The two- and three-way interactions were not significant (F < 2 and p > .35 in all cases).
Means (standard deviations) for number of mental state terms (maximum score = 6)
Level of macrostructural complexity
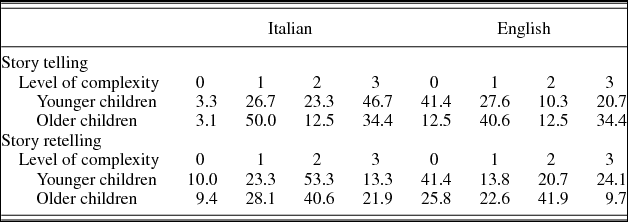
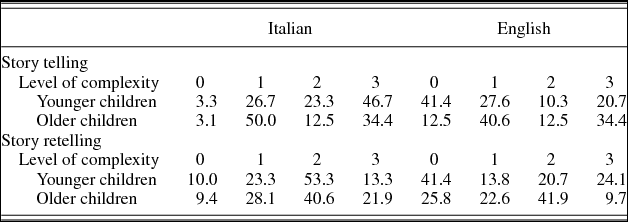
In order to examine whether the level of macrostructural complexity of story tellings and retellings varied as a function of age and language, chi-square tests were performed on the proportions of children producing narratives corresponding to the macrostructural complexity levels: 0, 1, 2, and 3. Chi-square tests comparing the story telling and story retelling tasks were significant for the younger group, χ2 (3) = 14.1, p < .01 and χ2 (3) = 11.6, p < .01, whereas no differences were detected for older children (p = .55 and p = .25). In particular, in the younger children's telling task, a significant difference between L1 and L2 emerged for the highest macrostructural complexity level (i.e., 3) and for the lowest macrostructural complexity level (i.e., 0). More specifically, the highest level of complexity (3) was more frequent in L1 than in L2 (46.7% vs. 20.7%), while the lowest level of complexity (0) was more frequent in L2 than in L1 (41.4% vs. 3.3%). In addition, on the retelling task, significant differences emerged for the younger children for the macrostructural complexity levels 2 and 0: level 2 was more frequent in L1 than in L2 (53.3% vs. 20.7%), whereas level 0 was more frequent in L2 than in L1 (41.4% vs. 10.0%). Overall, and congruent with the results obtained from the analysis of the number of macrostructure elements, these results suggest that the younger children produced narratives with higher macrostructural complexity levels in L1 than in L2 in both telling and retelling tasks. The degree of macrostructural complexity of narratives produced by older children was not different in the two languages. However, an unexpected result concerns the performance of the two groups in Italian story telling. As can be seen in Table 3, a greater number of younger children produce complex stories (Level 3) than older ones, who produce more Level 1 stories than younger children. The reasons for this are unclear. However, some speculative considerations can be put forward: it might be that the younger children's narratives were overestimated when coders attributed the goal, the attempts, and the outcome categories, while older children narratives might have been underestimated in complexity. The relatively low reliability value obtained for the complexity measure lends some support to this interpretation. It might be that scores reflected challenges in coding these particular categories, and thus in attributing an appropriate complexity score.
Percentage of children reaching each level of story complexity in story telling and story retelling tasks in first and second languages
Comprehension score
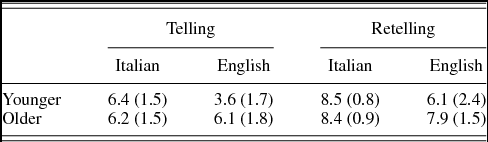
Table 4 illustrates the mean comprehension scores by age for the story telling and story retelling tasks in Italian and in English. ANOVA on comprehension scores showed that the effects of all three main factors were significant: age, F (1, 58) = 17.22, p < .001, η2 = 0.229; language, F (1, 58) = 33.09, p < .001, η2 = 0.363; and task, F (1, 58) = 207.81, p < .001, η2 = 0.782. In addition, the Age × Language interaction was significant, F (1, 58) = 19.1, p < .001, η2 = 0.25. The results showed that older children scored higher than the younger children and that comprehension of stories was better for Italian than for English. The interaction between language and age indicated that younger children showed a better narrative comprehension in Italian than in English, but the difference between comprehension scores of Italian and English narratives was not significant for the older group. Finally, more accurate comprehension was observed after the story retelling than after the story telling task. The other two-way and the three-way interactions were not significant (F < 1 and p > .20 in all cases).
Means (standard deviations) for comprehension score (maximum score = 9)

Relationships across tasks, languages, and narrative production, and comprehension
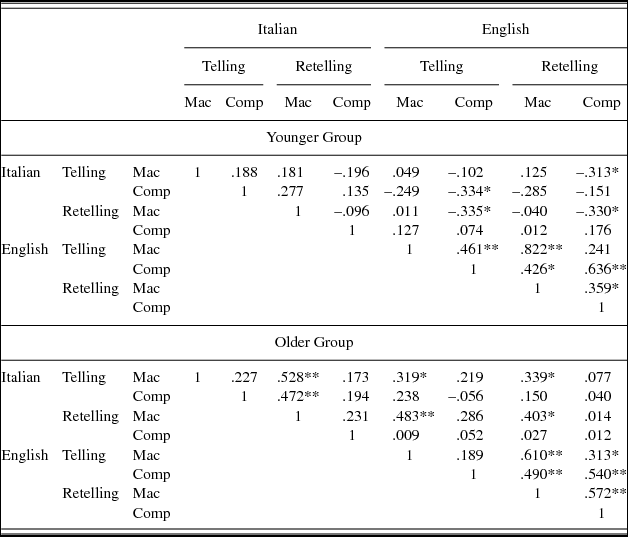
In order to analyze associations among the main variables, a Pearson correlation matrix was computed on measures of narrative production (number of macrostructure elements) and narrative comprehension (comprehension score) within and between the two languages (Italian and English); and within and between the two tasks (story telling and story retelling). Because the pattern of significant correlations differed for the younger and the older group of children to some extent, the results are presented separately.
For the younger group, as illustrated in Table 5, no significant correlation emerged in Italian between measures of comprehension and production in either the story telling or story retelling tasks. Otherwise, consistent, medium to high significant correlations emerged between measures obtained for story telling and story retelling tasks in Italian. Particularly interesting is the correlation between narrative comprehension in story telling and narrative production in story retelling. Furthermore, a few significant negative correlations were found in the cross-linguistic comparison of narrative production in Italian and narrative comprehension in English. Finally, narrative comprehension in the Italian story telling task correlated negatively with narrative comprehension in the English retelling task.
Correlations among macrostructure and comprehension scores, language, and task for the younger and older groups

Note: Mac, Macrostructure elements score; Comp, comprehension score.
*p < .05. **p < .01.
Table 5 illustrates the correlation pattern for the older group. As for the younger group, narrative production and comprehension did not correlate significantly for either of the two tasks in Italian, and correlated only for the story retelling task in English. Few significant correlations emerged between the two tasks in Italian. As for younger children, particularly interesting is the correlation between narrative comprehension in the context of the story telling task and narrative production on the retelling task. Similarly to the younger group, significant correlations were consistently found between narrative comprehension and production within and between the two tasks in English. Conversely, compared to the younger group, the older group showed a different pattern of cross-linguistic correlations: the significant correlations involve measures of narrative production obtained in the two tasks and are positive.
DISCUSSION
The current study was designed in order to provide new evidence on narrative competence in children who are developing bilingually. The study makes two significant contributions to the existing literature. First, narrative competence and differences/relations between L1 and L2 were investigated in Italian bilingual children aged between 5 and 7 years who are acquiring English as L2 and exposed to this L2 daily at kindergarten/school as the language of instruction. In contrast with previous work on bilingual children, most of which has been conducted in the United States with children from low- to middle-SES backgrounds (Gutiérrez-Clellen, Reference Gutiérrez-Clellen2002; Uccelli & Páez, Reference Uccelli and Páez2007), participants of the current study are acquiring English as a second but not majority language, and come from middle- to high-SES backgrounds.
Second, narrative competence was assessed in two elicitation conditions in order to verify whether the different tasks, namely, story telling and story retelling, are equivalent in eliciting narrative competence. This was allowed by adopting the tasks of the MAIN (Gagarina, et al., Reference Gagarina, Klop, Kunnari, Tantele, Välimaa and Balciuniene2012), which are characterized by parallel story structure but differ in the elicitation procedure. The macrostructure of story productions was directly compared in story telling and story retelling in terms of the elements included, the number of mental state terms, and the complexity level reached. In addition, children's narrative understanding after story telling and story retelling elicitation tasks was compared.
The main results of the study are discussed below in terms of their theoretical contribution to the existing knowledge on the development of narrative competence; differences/relations between L1 and L2; and the relevance of the findings for the assessment of narrative competence in bilinguals.
Developmental changes in narrative competence between 5 and 7 years
The current study highlighted a developmental change in narrative production at a macrostructural level and in narrative comprehension. Older children, namely, first graders, produced more complex and macrostructurally more complete narratives. The production of all relevant macrostructure elements and their inclusion of key elements, namely, character's goal(s), attempts, and outcome, was more frequent for older than for younger children. The omission of elements and of relevant relations among them was more frequent for younger than for older children. Older children also produced more mental state terms than younger ones, highlighting the gain in linguistic complexity of the narratives within this age range.
The inclusion of a logical structure might be considered to be the most important component of a narrative because it allows the global meaning of the story to be transferred to the listener (Lever & Senechal, Reference Lever and Sénéchal2011). Developmental changes in structure can be explained in terms of changes that occur in cognitive development in this age range, as well as by environmental factors. From kindergarten to first grade, children start to be exposed to formal literacy practices at school. Written language is often richer and structurally more complex than oral language, and exposure to written stories, in particular, could be related to the development of narrative skills. As the stories children are exposed to become richer with macrostructural elements, their productions might likewise show greater complexity of relations among macrostructure elements, and story comprehension might also improve. Previous studies (discussed in the literature review) showing higher scores for L2 narratives (Fiestas & Peña, Reference Fiestas and Peña2004; Squires et al., Reference Squires, Lugo-Neris, Peña, Bedore, Bohman and Gilliam2014; Uccelli & Páez, Reference Uccelli and Páez2007) also imply that formal schooling may be influential.
Cross-linguistic comparison
The current study provided cross-linguistic data for Italian and English. The results showed lower scores in the L2 than in the L1 on tests of receptive vocabulary. This L2 disadvantage, evident in both age groups, was paralleled by a lower number of mental state terms produced in the L2 narratives than in the LI. This finding is consistent with previous research showing that early bilinguals display lower vocabularies in L2 than in L1 (cf. Uccelli & Pàez, Reference Uccelli and Páez2007), and provides evidence that the reported disadvantage applies to different measures of vocabulary (viz., both receptive vocabulary size and production of mental state terms). The mental state terms did not vary by task; even in the story retelling task, in which mental state terms are provided in the story, children tended to produce fewer mental state terms in the L2. Nonetheless, in the current study, we did not find evidence of a relationship between differences in L1-L2 receptive vocabulary and measures of narrative competence. Far from arguing that vocabulary is irrelevant to narrative competence, we claim that the existing gap between L1 and L2 receptive vocabulary was not wide enough to affect the macrostructure or comprehension scores.
Younger participants who produced more macrostructure elements also showed higher levels of narrative complexity and better narrative comprehension in L1 than in L2; for these measures, the L1 over L2 advantage did not persist for older children, who showed similar narrative competence in both languages. This finding suggests a different pattern for narrative competence than for vocabulary, indicating development in the two languages may vary as a function of linguistic level (i.e., word vs. discourse level).
In addition, the pattern of relations across the two languages was different for the two age groups. In the younger group, a few measures of narrative competence in Italian and in English correlated negatively, while for the older group, narrative production correlated positively across the two languages. To explain the negative correlations, it might be argued that in the first phases of bilingual development, the use of two languages is cognitively demanding and, as stated by Bialystok and Craik (Reference Bialystok and Craik2010), cognitive mechanisms might not be sufficiently efficient to distribute resources in the two languages adequately. With increasing experience with both languages, children might become more able to use efficiently the cognitive resources in the two languages. Positive correlations could, in contrast, be explained by common conceptual knowledge underlying narrative competence. According to Cummins (1979), deep, conceptual knowledge is shared by the two languages. In line with this idea, and based on longitudinal data, Squires et al. (Reference Squires, Lugo-Neris, Peña, Bedore, Bohman and Gilliam2014) claimed that narrative production skills transferred from L1 to L2 in first graders; what was known in the L1 was made available for use in L2. Findings of the present study do not allow transfer and parallel development in the two languages to be distinguished, but new insights on relevant changes in cross-linguistic relationships during transition from preschool to school are suggested.
Different methodological paradigms for the assessment of narrative competence
The paradigm adopted in the current study was developed for a cross-linguistic comparison. The story telling and story retelling tasks have parallel materials in terms of structure and complexity that allowed narrative competence across tasks to be directly compared. The results showed that task affected performance in narrative production and comprehension. For all measures of narrative production and comprehension, better performance in story retelling than in story telling was observed in both age groups and languages. There are several possible explanations for this finding. Story telling and retelling tasks might be characterised by a different processing load, and for this reason the story retelling task could be easier than the story telling task. In the story telling task, children are asked to spontaneously produce a story from pictures, which could be more cognitively demanding and limit their ability to construct and produce narratives with a great number of elements. In contrast, in the story retelling task, children can select the most important elements from the presented story and then can build the story representation in order to recall it back. Another explanation might be related to differences in the skills involved in story telling and retelling. The construction of a story based on a previously heard narrative might rely more on comprehension skills. This interpretation is consistent with the one provided by Lever and Sénéchal (Reference Lever and Sénéchal2011), according to which story telling relies more on constructive processes, whereas story retelling relies on reconstructive processes.
Conclusions
For the first time, the narrative competence of Italian bilinguals acquiring English as an L2, but not as a majority language, were directly compared, using a developmental perspective within a critical age range. The study provides strong evidence that different elicitation methods influence narrative production and comprehension by showing the facilitating effect of a story retelling task for both age groups and languages. This facilitating effect, irrespective of the child's age and whether narrative competence is measured in the L1 or the L2, provides useful practical implications for a more targeted evaluation of narrative competence, in function of the aim of the assessment.
A further contribution of the current work concerns the evidence for relevant developmental changes in the relations between the two languages. The developmental changes were not equivalent across linguistic levels. While for vocabulary measures, an L1 advantage over L2 was stable between 5 and 7 years of age, for narrative competence, the L1 advantage disappeared between 6 and 7 years. Furthermore, as shown by the correlations, the relationship between the L1 and the L2 changed from negative in the younger group to positive in the older group, suggesting that the relationship of the two languages changed from being in competition with one another to following a common developmental pathway. This result is particularly informative for educational purposes of bilingual children who are first graders and have started their formal instruction in L2.
ACKNOWLEDGMENTS
We are grateful to the children, their families, and the English International schools of Padova, Rosà-Vicenza, and Grimani (Noventa Padovana) for taking part in the study; Carla Bascì and Daniela Trentin for data collection, story transcription, and data coding; the reviewers of the paper for useful suggestions; and Diane Pesco for the excellent work as editor and for valuable suggestions for improvements of this article.