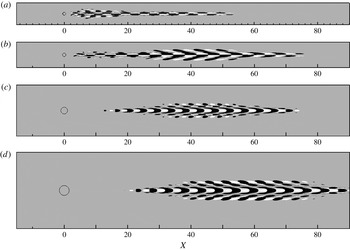
1. Introduction
Understanding, predicting and eventually delaying the laminar–turbulent transition in boundary layer flows has been a challenging issue for researchers ever since the pioneering work by Ludwig Prandtl and his two students, Walter Tollmien and Hermann Schlichting. For small-amplitude disturbances and supercritical Reynolds numbers, the linear stability theory predicts the slow transition process due to the generation, amplification and secondary instability of Tollmien–Schlichting (TS) waves. It has however been known for quite a long time that this transition process can be greatly modified by environmental noise or by the presence of localised or distributed surface roughness. Depending on the characteristics of the flow and the nature of the surface roughness, the transition process can either be promoted or delayed.
On the one hand, in their experimental work, Klebanoff & Tidstrom (Reference Klebanoff and Tidstrom1972) have shown that this natural transition could be promoted using spanwise-invariant roughness elements. This earlier transition is related to the modified stability properties of the boundary layer flow developing downstream of the roughness element. More precisely, this transition process is explained by the enhancement of the unstable TS waves due to modifications of the flow properties in the downstream reversed flow and recovery regions. More recently, Perraud et al. (Reference Perraud, Arnal, Séraudie and Tran2004) have shown that the higher the two-dimensional roughness element, the closer to it does transition to turbulence take place. On the other hand, the influence of fully three-dimensional roughness elements on the transition to turbulence is very different: whereas fully three-dimensional roughness elements hardly promote flow separation, they induce streamwise velocity streaks. It has been shown by Cossu & Brandt (Reference Cossu and Brandt2004) that these streaks act to stabilise the TS waves and thus delay the natural transition process. This delay of the transition to turbulence by fully three-dimensional roughness elements has been further confirmed experimentally by Fransson et al. (Reference Fransson, Brandt, Talamelli and Cossu2004, Reference Fransson, Brandt, Talamelli and Cossu2005, Reference Fransson, Talamelli, Brandt and Cossu2006), using an array of cylindrical roughness elements. Though promising, this delay technique needs a careful choice of the main parameters of the set-up, namely the Reynolds number, the shape and spacing of the roughness elements, as well as their height with respect to the thickness of the boundary layer. In fact, the previously mentioned authors have observed that, beyond a given threshold, the velocity streaks induced by the three-dimensional roughness elements can themselves become unstable, causing the flow to transition to turbulence just downstream of the roughness elements.
It is known that in the presence of moderate to high environmental noise, free-stream disturbances can penetrate into the boundary layer and trigger by-pass transition. The developing perturbations no longer take the form of TS waves but of velocity streaks which are quasi-optimal disturbances (i.e. with the optimal perturbation being the one inducing the largest transient energy growth in the considered base flow). Because three-dimensional roughness elements also induce velocity streaks in the boundary layer, it is believed that such by-pass transition and fully three-dimensional roughness-induced transition are connected. The formation process of these high- and low-speed streaks has been explained by Landahl (Reference Landahl1990) and relies on the lift-up effect. The free-stream disturbances entering the boundary layer give birth to streamwise-aligned counter-rotating vortices. Such vortices then transfer high-speed fluid from the outer part of the boundary layer toward the wall and low-speed fluid from the wall toward the outer region of the boundary layer. Due to this transfer of momentum, the resulting perturbation takes the form of high- and low-speed streaks. The dynamics of optimal streaks has been investigated by Andersson et al. (Reference Andersson, Brandt, Bottaro and Henningson2001). These can potentially undergo a secondary instability taking the form of a sinuous modulation of the streaks when their amplitude exceeds approximately 26 % of the free-stream velocity. Instability with respect to varicose perturbations has also been reported for optimal streaks having an amplitude larger than roughly 37 % of the free-stream velocity. However, more recently, Konishi & Asai (Reference Konishi and Asai2004) have shown experimentally that the stability properties of isolated streaks, such as the ones induced by an isolated three-dimensional roughness element, are different from the ones of spanwise-periodic optimal streaks such as those considered in Andersson et al. (Reference Andersson, Brandt, Bottaro and Henningson2001). In fact, even if one could carefully choose the shape and aspect ratio of an isolated roughness element, trying to reproduce the wavelength of spanwise-periodic streaks (Ergin & White Reference Ergin and White2006), the shape of the induced streaks will be rather different, especially the lateral ones, which would easily fade away in the absence of side vortices able to sustain them.
Concerning the flow past three-dimensional roughness elements and its transition to turbulence, Sedney (Reference Sedney1972) has reviewed most of the literature available until the early 1970s. The flow pattern induced by an isolated three-dimensional roughness element has been known for almost 60 years (Gregory & Walker Reference Gregory and Walker1955). When impinging on the three-dimensional roughness element, the spanwise vorticity of the incoming boundary layer wraps around the protuberance thus creating horseshoe vortices. One of the most thorough investigations of the structure of such vortical structures has been carried out by Baker (Reference Baker1978), for an isolated cylindrical roughness mounted on a flat plate. As shown by Baker (Reference Baker1978), the number of horseshoe vortices wrapped around the roughness element, as well as their main features, mostly depend on the aspect ratio of the roughness element considered. However, in all of these cases, such horseshoe vortices give birth further downstream to quasi-aligned streamwise vortices. As already explained, due to the lift-up effect (Landahl Reference Landahl1990), these streamwise-aligned vortices can trigger strong transient growth of the boundary layer streaks (Joslin & Grosch Reference Joslin and Grosch1995), strong enough to cause their breakdown and subsequent transition to turbulence.
The receptivity of the boundary layer flow to an array of three-dimensional cylindrical roughness elements and the associated transient growth of the velocity streaks have been thoroughly investigated by various authors such as Fischer & Choudhari (Reference Fischer and Choudhari2004), Fransson et al. (Reference Fransson, Brandt, Talamelli and Cossu2004, Reference Fransson, Brandt, Talamelli and Cossu2005), Ergin & White (Reference Ergin and White2006) and Denissen & White (Reference Denissen and White2008, Reference Denissen and White2009). Their major finding is that the streamwise transient growth of the induced streaks roughly scales with the square of the roughness Reynolds number,
 $\mathit{Re}_{h}=U_{Bl}(x_{k},h)h/{\it\nu}$
(
 $U_{Bl}$
being the value of the Blasius velocity profile evaluated at the roughness element position
 $x_{k}$
and height
 $h$
, and
 ${\it\nu}$
the kinematic viscosity).
The crucial importance of the roughness Reynolds number in the roughness-induced transition to turbulence had already been outlined many years earlier. As early as the early 1960s, Tani, Komoda & Komatsu (Reference Tani, Komoda and Komatsu1962) had already observed experimentally that the transition to turbulence in the wake of an aspect ratio
 ${\it\eta}=1$
cylindrical roughness element occurs in the vicinity of
 $\mathit{Re}_{h}=600$
almost independently of the other parameters characterising the flow (provided the roughness element is totally immersed within the boundary layer). Almost at the same time, von Doenhoff & Braslow (Reference von Doenhoff and Braslow1961) have reviewed most of the experimental results available back then, obtained for roughness elements of different shape, height and spanwise spacing, and compiled a transition diagram correlating the aspect ratio of the roughness element to the roughness Reynolds number beyond which the induced flow would transition to turbulence. The von Doenhoff & Braslow (Reference von Doenhoff and Braslow1961) diagram clearly shows that the fundamental parameters for predicting transition to turbulence past a roughness element are its aspect ratio and its height with respect to the Blasius boundary layer profile. In particular, the height of the roughness element appears to be fundamental for the development of streamwise streaks of finite amplitude and length. The crucial role of streaks in the onset of transition has been highlighted by Vermeersch (Reference Vermeersch2009) and Arnal et al. (Reference Arnal, Houdeville, Séraudie and Vermeersch2011), who have developed a model based on optimal perturbation theory to determine transition to turbulence past roughness elements of any shape. In particular, they have conjectured that transition occurs when the ratio of the shear stress generated by optimal streaks to the viscous stress reaches a given critical value. Though promising, their approach relies on the strong assumption of quasi-parallelism of the flow induced by the three-dimensional roughness element, regardless of the separation zones which can be induced in the near wake for large/high enough roughness elements. The same authors have also shown that arrays of smooth roughness elements share similar features with sharp-edged ones, both concerning stabilisation of TS waves and transition to turbulence.
The receptivity of a boundary layer flow to an array of bumps has been investigated by Tumin & Reshotko (Reference Tumin and Reshotko2005). Similarly to what has been observed for cylindrical roughness elements, they found that, behind each bump, a pair of counter-rotating vortices is generated, creating relatively high- and low-speed streaks in the wake downstream of the bump. An investigation of the local stability of streamwise streaks developing past a smooth, large, isolated roughness element has been carried out by Piot, Casalis & Rist (Reference Piot, Casalis and Rist2008). Assuming that the flow past the smooth roughness element evolves slowly in the streamwise direction, they have studied its local stability properties at each streamwise location just behind the roughness element, assessing the stabilising effect of such a pre-streaky flow on the growth of TS waves. The same configuration has been studied very recently by Cherubini et al. (Reference Cherubini, De Tullio, De Palma and Pascazio2013) from a global point of view. To investigate by-pass transition in the presence of a large isolated bump, these authors have searched for the optimal perturbation inducing the largest growth of disturbances over the fully three-dimensional flow field surrounding this smooth roughness element. In this three-dimensional framework, the optimal perturbation takes the form of a wavepacket-like structure initially localised in the vicinity of the separation line on the top of the roughness element which will eventually travel along the central low-speed streak induced by the roughness element. Interestingly, at small target times, this optimal perturbation exhibits a varicose symmetry, whereas at larger target times it exhibits a sinuous structure. It is worth noting that for the geometry they have investigated, the varicose optimal perturbation is the most efficient in triggering localised transition and induces hairpin vortices once nonlinearities are taken into account. However, due to the linearly stable nature of the flow considered, the unsteadiness observed is not self-sustaining once these linear transients have been washed out from the computational domain. In the meantime, de Tullio et al. (Reference de Tullio, Paredes, Sandham and Theofilis2013) have investigated the roughness-induced transition in the case of a compressible boundary layer flow using the joint application of local stability analysis, parabolised stability equations and direct numerical simulations. These authors have shown that the flows they have investigated are much more convectively unstable, be it to varicose or sinuous perturbations, than the classic boundary layer flow. Moreover, for the sharp-edged rectangular roughness element they considered, the varicose perturbations exhibit larger temporal and spatial growth rates than their sinuous counterparts.
Though they provide valuable insights into the linear dynamics of the flow, stability analyses as performed by Piot et al. (Reference Piot, Casalis and Rist2008) (for bumps), de Tullio et al. (Reference de Tullio, Paredes, Sandham and Theofilis2013) (for rectangular roughness elements), and Denissen & White (Reference Denissen and White2013) (for cylinders), rely on the strong assumption of a nearly parallel flow. However, the flow past three-dimensional roughness elements exhibits some reversed flow regions where this parallel assumption cannot hold. As a consequence, for this class of flows, stability analyses relying on a parallel flow hypothesis totally discard the influence of the region in the vicinity of the roughness element on the stability properties of the overall flow field which, as seen by Fransson et al. (Reference Fransson, Brandt, Talamelli and Cossu2005), appears to be the region triggering the unsteadiness. To circumvent this major drawback and to fully capture the instability mechanisms, one then has to turn to a fully three-dimensional global stability framework for which no such parallel assumption is required. Since the number of degrees of freedom involved in such formulation of the stability problem is extremely large, fully three-dimensional global stability analysis still is nowadays a heavy computational task. Hopefully, with the increase of computational resources over the past decade and the recent popularisation of new eigenvalue algorithms (Edwards et al. Reference Edwards, Tuckerman, Friesner and Sorensen1994; Bagheri et al. Reference Bagheri, Akervik, Brandt and Henningson2009a ), investigation of the linear stability of flows with three inhomogeneous directions has become feasible. Recently, for the case of a jet in cross-flow, Bagheri et al. (Reference Bagheri, Schlatter, Schmid and Henningson2009b ) and Ilak et al. (Reference Ilak, Schlatter, Bagheri and Henningson2012) have shown that fully three-dimensional global stability analysis is able to provide a better understanding of the underlying instability mechanisms. To our knowledge, no such global stability analysis has ever been attempted on the flow past a three-dimensional roughness element. The aim of the present work is to provide new insights into the roughness-induced transition using these new developments in the global stability theory. It is believed that fully three-dimensional global stability analysis can help us address several questions among which are:
-
(i) Can the varicose and sinuous instability mechanisms found by local stability analyses, as well as the critical Reynolds number measured in experiments and numerical simulations, be accurately recovered using a fully three-dimensional global approach?
-
(ii) Can one link the roughness-induced transition to a global instability of the flow and not only to transient growth and associated convectively unstable perturbations as widely accepted until now?
-
(iii) Is it possible to predict the flow’s nonlinear patterns and dynamics using pieces of information stemming from linear analyses?
The case of a cylindrical roughness element immersed within a laminar boundary layer flow developing along a flat plate is investigated. The present paper is structured as follows. First, in § 2 the problem under consideration and the numerical methods used are presented. In § 3, the experimental case investigated by Fransson et al. (Reference Fransson, Brandt, Talamelli and Cossu2005) is reproduced numerically and its global instability is investigated. In § 4, a parametric investigation is carried out, highlighting two instability mechanisms, a sinuous and a varicose one, arising for roughness elements of different aspect ratio. In § 5, direct numerical simulations revealing the nonlinear evolution of these instabilities as well as the criticality of the bifurcation associated with the sinuous one are presented. Finally, in § 6 concluding remarks are provided.
2. Problem formulation
2.1. Governing equations
The dynamics of a three-dimensional incompressible flow are described by the incompressible Navier–Stokes equations:
 $$\begin{eqnarray}\left.\begin{array}{@{}c@{}}\displaystyle \frac{\partial \boldsymbol{U}}{\partial t}+(\boldsymbol{U}\boldsymbol{\cdot }\boldsymbol{{\rm\nabla}})\boldsymbol{U}=\displaystyle -\boldsymbol{{\rm\nabla}}P+\frac{1}{\mathit{Re}}{\rm\Delta}\boldsymbol{U},\\ \boldsymbol{{\rm\nabla}}\boldsymbol{\cdot }\boldsymbol{ U }=0,\end{array}\right\}\end{eqnarray}$$
where
 $\boldsymbol{U}=(U,V,W)^{\text{T}}$
is the velocity vector and
 $P$
the pressure term. Dimensionless variables are defined with respect to the height
 $h$
of the cylindrical roughness element and to the free-stream velocity
 $U_{\infty }$
. Therefore, the Reynolds number is defined as
 $\mathit{Re}=U_{\infty }h/{\it\nu}$
, with
 ${\it\nu}$
being the kinematic viscosity. Concerning the coordinate system,
 $x$
,
 $y$
and
 $z$
are defined as the streamwise, wall-normal and spanwise directions, respectively, with
 $x$
having its origin at the leading edge of the flat plate. However, since the domains used in this work do not include the leading edge of the flat plate, it is convenient to define a shifted streamwise axis
 $X=x-x_{k}$
, having its origin at the location
 $x_{k}$
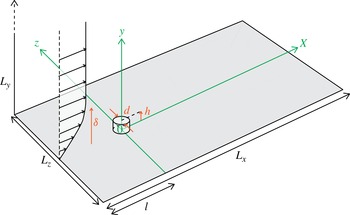
of the roughness element along the flat plate. A sketch of the computational domain considered is depicted on figure 1, along with this roughness-centred coordinate system. The cylindrical roughness element, having diameter
 $d$
and height
 $h$
, is thus centred at
 $(X,z)=(0,0)$
. The computational box has a streamwise extent
 $L_{X}=105\ (-15\leqslant X\leqslant 90)$
and a wall-normal extent of
 $L_{y}=50$
, whereas the spanwise extent
 $L_{z}$
will be varied in the different computations as specified in the following sections. In particular, in most of the computations, the spanwise domain length is chosen in order to make sure that the roughness element behaves as being isolated (von Doenhoff & Braslow Reference von Doenhoff and Braslow1961), by scaling it with respect to the aspect ratio of the roughness element,
 ${\it\eta}=d/h$
.
Sketch of the computational domain under consideration. The parameters defining the geometry take the following values:
 $h=1$
,
 $l=15$
and
 $(L_{x},L_{y})=(105,50)$
. Only the roughness element diameter
 $d$
and the spanwise dimension of the domain
 $L_{z}$
will be varied.

The following boundary conditions have been applied:
-
(i) at the inlet (
 $X_{in}=-15$
), a Dirichlet boundary condition is imposed on the velocity;
-
(ii) at the outlet (
$X_{out}=90$
), a Neumann boundary condition is imposed on the velocity
$\boldsymbol{{\rm\nabla}}\boldsymbol{U}\boldsymbol{\cdot }\boldsymbol{x}=0$
; -
(iii) on the spanwise end planes (
$z_{side}=\pm L_{z}/2$
), periodic boundary conditions are imposed for the three components of the velocity vector; -
(iv) at the upper boundary (
$y_{top}=50$
), the conditions
$U=1$
and
$\partial V/\partial y=\partial W/\partial y=0$
are applied; -
(v) finally, a no-slip boundary condition is imposed on the flat plate and the walls of the roughness element.



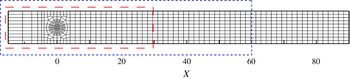
Note that two other domains extending down to
 $X_{out}=30$
and
 $X_{out}=60$
in the streamwise direction have been considered, whereas the inlet of the domain has been kept at a streamwise distance
 $l=15$
upstream of the centre of the roughness element (see figure 1). However, in order to present results independent of the domain size, only the longest domain (i.e.
 $X_{out}=90$
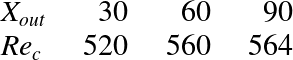
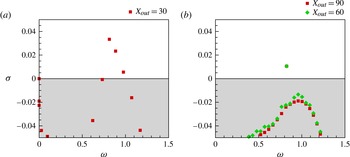
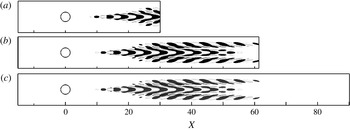
) will be considered in the present work, as discussed in detail in appendix B which provides a numerical convergence analysis.
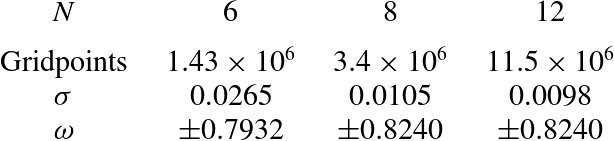
Calculations have been performed using the code Nek5000 developed at Argonne National Laboratory by Fischer, Lottes & Kerkemeir (Reference Fischer, Lottes and Kerkemeir2008). Spatial discretisation is done by a Legendre spectral elements method with polynomials of order 12. Depending on the aspect ratio considered, the number of spectral elements in the mesh ranges from 10 000 for
 ${\it\eta}=1$
up to 18 800 for
 ${\it\eta}=3$
. The convective terms are advanced in time using an extrapolation of order 3, whereas for viscous terms a backward differentiation of order 3 is used, resulting in the time-advancement scheme labelled BDF3/EXT3.
2.2. Base flow computation
Seeking stationary solutions
 $\boldsymbol{U}_{b}=(U_{b},V_{b},W_{b})^{\text{T}}$
of the Navier–Stokes equations is a pre-requisite to the stability analysis performed in this work. Such solutions, also called base flows or fixed points of system (2.1), have been computed using the selective frequency damping (SFD) approach introduced by Akervik et al. (Reference Akervik, Brandt, Henningson, Hoepffner, Marxen and Schlatter2006). This technique enables a damping of the oscillations of the unsteady part of the solution using a temporal low-pass filter. This is achieved by adding a forcing term to the right-hand side of the Navier–Stokes equations and extending the system (2.1) with an equation for the filtered state
 $\bar{\boldsymbol{U}}$
. The extended system is then governed by the following set of equations:
 $$\begin{eqnarray}\left.\begin{array}{@{}c@{}}\boldsymbol{{\rm\nabla}}\boldsymbol{\cdot }\boldsymbol{U}=0,\\ \displaystyle \frac{\partial \boldsymbol{U}}{\partial t}=-(\boldsymbol{U}\boldsymbol{\cdot }\boldsymbol{{\rm\nabla}})\boldsymbol{U}-\boldsymbol{{\rm\nabla}}P+\displaystyle \frac{1}{\mathit{Re}}{\rm\Delta}\boldsymbol{U}-{\it\chi}(\boldsymbol{U}-\bar{\boldsymbol{U}}),\\ \displaystyle \frac{\partial \bar{\boldsymbol{U}}}{\partial t}={\it\omega}_{c}(\boldsymbol{U}-\bar{\boldsymbol{U}}),\end{array}\right\}\end{eqnarray}$$
with
 ${\it\chi}$
being the gain of the filter and
 ${\it\omega}_{c}$
its cut-off circular frequency. The choice of these two parameters is crucial for the computation of unstable base flows: the gain
 ${\it\chi}$
has to be positive and larger than the growth rate
 ${\it\sigma}$
of the instability one aims to quench, whereas
 ${\it\omega}_{c}$
has to be lower than the eigenfrequency
 ${\it\omega}$
of the instability (usually
 ${\it\omega}_{c}={\it\omega}/2$
). It can be shown that this extended system converges toward the equilibrium solution
 $\boldsymbol{U}_{b}=(U_{b},V_{b},W_{b})^{\text{T}}$
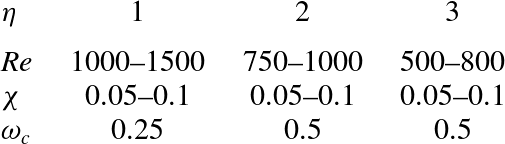
of the Navier–Stokes equations. Table 1 provides typical values of
 ${\it\chi}$
and
 ${\it\omega}_{c}$
that have been used for the base flow computations. For further details, the reader is referred to Akervik et al. (Reference Akervik, Brandt, Henningson, Hoepffner, Marxen and Schlatter2006).
Typical values of the parameters
 ${\it\chi}$
and
 ${\it\omega}_{c}$
used in the SFD to compute the base flows for the different cases considered.

Since the computational domain does not include the leading edge of the flat plate, a Blasius velocity profile is imposed at inlet points. The imposed profile is chosen by requiring that the theoretical Blasius boundary layer displacement thickness,
 ${\it\delta}^{\ast }$
, that the flow would have at
 $(X,z)=(0,0)$
in the absence of the roughness element, has a prescribed value with respect to the roughness height. The prescribed values of
 ${\it\delta}^{\ast }$
, as well as the associated values of the displacement thickness Reynolds number,
 $\mathit{Re}_{{\it\delta}^{\ast }}=U_{\infty }{\it\delta}^{\ast }/{\it\nu}$
, will be given in the next sections, allowing a comparison with the configurations used in previous studies.
2.3. Three-dimensional global stability analysis
Linear stability analysis enables the investigation of the asymptotic time evolution of infinitesimal perturbations in the vicinity of a given fixed point of the original system. In the present case, one needs to use the linearised Navier–Stokes equations. The linearised dynamics of such infinitesimal perturbations evolving on the base flow
 $\boldsymbol{U}_{b}$
are governed by the following set of equations:
 $$\begin{eqnarray}\left.\begin{array}{@{}c@{}}\displaystyle \frac{\partial \boldsymbol{u}}{\partial t}=-(\boldsymbol{u}\boldsymbol{\cdot }\boldsymbol{{\rm\nabla}})\boldsymbol{U}_{b}-(\boldsymbol{U}_{b}\boldsymbol{\cdot }\boldsymbol{{\rm\nabla}})\boldsymbol{u}-\boldsymbol{{\rm\nabla}}p+\displaystyle \frac{1}{\mathit{Re}}{\rm\Delta}\boldsymbol{u},\\ \boldsymbol{{\rm\nabla}}\boldsymbol{\cdot }\boldsymbol{ u }=0,\end{array}\right\}\end{eqnarray}$$
where
 $\boldsymbol{u}=(u,v,w)^{\text{T}}$
is the perturbation velocity vector and
 $p$
the perturbation pressure. This set of equations is subject to the same boundary conditions as system (2.1) with the inlet Dirichlet boundary condition being a zero-velocity condition. Introducing the perturbation state vector
 $\boldsymbol{q}=(\boldsymbol{u},p)^{\text{T}}$
, one can recast the above set of equations into the following linear dynamical system form:
 $$\begin{eqnarray}\mathscr{B}\frac{\partial \boldsymbol{q}}{\partial t}=\mathscr{J}\boldsymbol{q},\end{eqnarray}$$
where
 $\mathscr{B}$
is a singular mass matrix, and
 $\mathscr{J}$
is the Jacobian matrix of the Navier–Stokes equations (2.1) linearised around the fixed point
 $\boldsymbol{U}_{b}$
. Once projected onto a divergence-free vector space, this system simply reads
 $$\begin{eqnarray}\frac{\partial \boldsymbol{u}}{\partial t}=\mathscr{A}\boldsymbol{u},\end{eqnarray}$$
with
 $\mathscr{A}$
being the projection of the Jacobian matrix
 $\mathscr{J}$
onto the divergence-free vector space. Because the number of degrees of freedom involved in the computation is far too large to enable explicit storage of
 $\mathscr{A}$
and thus direct computation of its eigenvalues, a time-stepper approach as introduced by Edwards et al. (Reference Edwards, Tuckerman, Friesner and Sorensen1994) and Bagheri et al. (Reference Bagheri, Akervik, Brandt and Henningson2009a
) is used. This method, based on an Arnoldi algorithm and on the formal solution
 $\boldsymbol{u}({\rm\Delta}t)=\text{exp}(\mathscr{A}{\rm\Delta}t)\boldsymbol{u}_{0}$
to (2.5), aims at computing the eigenpairs of the exponential propagator
 $\unicode[STIX]{x1D648}=\text{exp}(\mathscr{A}{\rm\Delta}t)$
instead of those of the Jacobian matrix
 $\mathscr{A}$
. Though the Jacobian matrix
 $\mathscr{A}$
cannot be explicitly computed, the action of the exponential propagator on a given vector can be easily approximated by time-marching the linearised Navier–Stokes equations from
 $t=0$
to
 ${\rm\Delta}t$
. At iteration
 $k$
, the basic Arnoldi iteration thus reads
 $$\begin{eqnarray}\unicode[STIX]{x1D648}\boldsymbol{V}_{k}\simeq \boldsymbol{V}_{k}\unicode[STIX]{x1D643}_{k}\end{eqnarray}$$
with
 $\boldsymbol{V}_{k}$
being an orthonormal set of vectors spanning a Krylov subspace of dimension
 $k$
onto which
 $\unicode[STIX]{x1D648}$
is projected, and
 $\unicode[STIX]{x1D643}_{k}$
being the associated projection. The Hessenberg matrix
 $\unicode[STIX]{x1D643}_{k}$
resulting from this Arnoldi iteration is a small
 $k\times k$
matrix whose eigenpairs
 $({\it\Sigma},\boldsymbol{X})$
, also called Ritz pairs, can be directly computed and are a good approximation of those of
 $\unicode[STIX]{x1D648}$
. Ritz pairs are linked to the eigenvalues and eigenvectors
 $({\it\Lambda},\boldsymbol{Q})$
of the Jacobian matrix
 $\mathscr{A}$
by the following relationship:
 $$\begin{eqnarray}{\it\Lambda}=\frac{\log ({\it\Sigma})}{{\rm\Delta}t},\quad \boldsymbol{Q}=\boldsymbol{V}\boldsymbol{X},\end{eqnarray}$$
with
 ${\it\Lambda}={\it\sigma}+\text{i}{\it\omega}$
,
 ${\it\sigma}$
being the growth rate and
 ${\it\omega}$
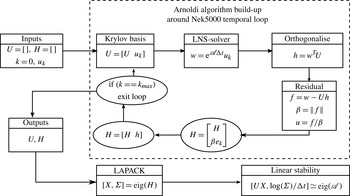
the circular frequency. The block-diagram of the complete algorithm is depicted on figure 2. It can be seen as an alternative to the algorithm proposed by Barkley, Blackburn & Sherwin (Reference Barkley, Blackburn and Sherwin2008) where the exit condition has been simplified. All of the results presented throughout this paper were obtained using a Krylov subspace of dimension 500 and a sampling period
 ${\rm\Delta}t=0.625$
enabling good convergence of the eigenvalues with circular frequency equal to 2.5 and lower. Concerning the convergence of the procedure with respect to other numerical parameters, more details are given in appendix B.
Block-diagram of the Arnoldi algorithm used.

3. The Fransson experiment
Following the theoretical work by Cossu & Brandt (Reference Cossu and Brandt2004), Fransson et al. (Reference Fransson, Brandt, Talamelli and Cossu2004, Reference Fransson, Brandt, Talamelli and Cossu2005, Reference Fransson, Talamelli, Brandt and Cossu2006) have conducted a series of experiments demonstrating the ability of finite-amplitude streaks to stabilise the TS waves and thus delay the natural transition of the boundary layer flow. With this aim, they placed an array of roughness elements, having an aspect ratio
 ${\it\eta}=3$
, at a distance
 $x_{k}=57.14$
from the leading edge of a flat plate and separated one from another by a spanwise distance
 $L_{z}=10$
(Fransson et al.
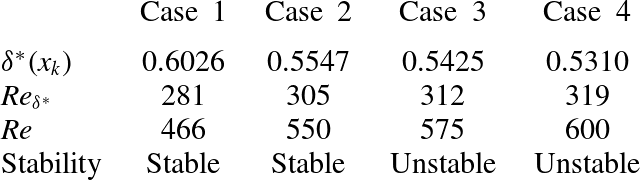
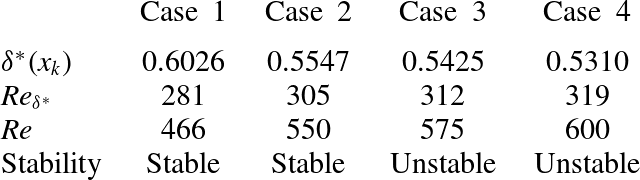
Reference Fransson, Brandt, Talamelli and Cossu2005). Despite the stabilising effect of the streaks on the TS waves, transition was observed to take place just downstream of the roughness elements beyond a critical Reynolds number. In this section, the case described by Fransson et al. (Reference Fransson, Brandt, Talamelli and Cossu2005) is reproduced numerically, in order to ascertain that fully three-dimensional global instability analysis is able to predict with reasonable accuracy the critical Reynolds number experimentally obtained by the previously mentioned authors. The prescribed Reynolds numbers as well as the displacement thickness
 ${\it\delta}^{\ast }(x_{k})$
are given in table 2.
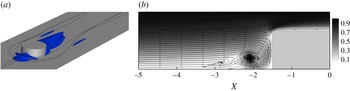
Computed base flow for
 $(\mathit{Re},\mathit{Re}_{{\it\delta}^{\ast }},{\it\eta})=(466,281,3)$
. (a) Visualisation of the vortical system using streamlines and isosurfaces of the upstream and downstream reversed flow regions (visualised by the
 $U_{b}=0$
isosurface). (b) Close-up of the upstream vortical system highlighted by streamlines in the symmetry plane coloured with the velocity magnitude.

Summary of the different cases considered in § 3. For all of them, the roughness elements are located at a distance
 $x_{k}=57.14$
from the leading edge, separated by
 $L_{z}=10$
and have an aspect ratio
 ${\it\eta}=3$
.
3.1. Base flow
Figure 3 depicts the base flow obtained for
 $(\mathit{Re},\mathit{Re}_{{\it\delta}_{\ast }},{\it\eta})=(466,281,3)$
, i.e. the same set-up as the reference one in Fransson et al. (Reference Fransson, Brandt, Talamelli and Cossu2005). It exhibits the two major features of all the steady solutions that have been investigated within the present work: an upstream and a downstream reversed flow region (visualised by the
 $U_{b}=0$
isosurface in figure 3
a), as well as a system of multiple vortices stemming from the upstream recirculation zone, wrapping around the roughness element and eventually becoming almost aligned with the streamwise direction of the flow as shown by the streamlines. The topology of this upstream vortical system has been investigated experimentally by Baker (Reference Baker1978) and exhibits between one and three counter-rotating vortex pairs. According to Baker (Reference Baker1978), the particular vortical topology chosen by the flow essentially depends on the Reynolds number and on the ratio of the roughness element diameter
 $d$
over the boundary layer displacement thickness
 ${\it\delta}^{\ast }$
. This vortical system can be seen on figure 3(b) depicting streamlines in the symmetry plane. The impact of this vortical system on the boundary layer flow is as follows:
-
(i) upstream of the roughness element,
$\!$
all of the vorticity is in the spanwise direction; -
(ii) once the flow encounters the roughness element, the upstream spanwise vorticity rolls up, forming the vortical system observed in figure 3(b);
-
(iii) it then wraps around the roughness element and is transferred into streamwise vorticity further downstream thus creating the legs of the horseshoe vortices.

The legs of these horseshoe vortices being streamwise-aligned, high-speed fluid is transported from the outer region of the boundary layer toward the wall, whereas low-speed fluid is transported away from the wall toward the outer region of the boundary layer. This transport of momentum, known as the lift-up effect, thus gives birth to streamwise velocity streaks (Landahl Reference Landahl1990).
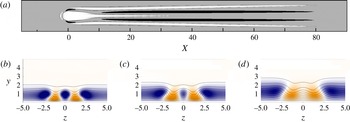
Figure 4 depicts the spatial distribution of the central low-speed region and outer streaks induced by the array of roughness elements at various streamwise stations. These streaks have been identified using the deviation of the base flow streamwise component from the corresponding Blasius boundary layer flow (
 $U_{Bl}$
), as used by Fischer & Choudhari (Reference Fischer and Choudhari2004), i.e.
 ${\bar{u}}=U_{b}-U_{Bl}$
. As shown on figure 4(a), the roughness element generates a central low-speed region created by the streamwise velocity deficit induced by the roughness element and a pair of high- and low-speed streaks induced by the legs of the primary horseshoe vortex on each side. On the one hand, the central low-speed region appears to fade away relatively rapidly in the streamwise direction, while on the other hand the outer pairs of streaks appear to be sustained over quite a long distance. This is better visualised on figure 4(b–d) depicting contours of the streamwise velocity deviation in various
 $X=\text{const.}$
planes. It clearly appears from these plots that, while the amplitude of the central low-speed region has dramatically decreased once
 $X=40$
, the amplitude of the outer low- and high-speed streaks varies very little. Such behaviour has already been observed experimentally by Fransson et al. (Reference Fransson, Brandt, Talamelli and Cossu2004) (see their figure 2).
Streamwise evolution of the streaks induced by the array of roughness elements for
 $(\mathit{Re},\mathit{Re}_{{\it\delta}^{\ast }})=(466,281)$
. (a) Top view of the
 ${\bar{u}}=\pm 0.3$
surfaces (black and white), with
 ${\bar{u}}=U_{b}-U_{Bl}$
being the deviation of the base flow from the Blasius boundary layer flow. (b–d) Slices extracted at (b)
 $X=20$
, (c)
 $X=40$
and (d)
 $X=80$
. The shaded contours range from
 ${\bar{u}}=0.3$
(red) to
 ${\bar{u}}=-0.3$
(blue), whereas the solid lines depict the base flow streamwise velocity isocontours from
 $U_{b}=0.1$
to 0.99.

3.2. Global stability
In order to investigate the early transition observed in the experiment (Fransson et al.
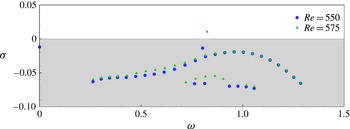
Reference Fransson, Brandt, Talamelli and Cossu2005), global stability analyses of various base flows are conducted. All of the cases considered are reported in table 2. Figure 5 depicts the spectra of eigenvalues for
 $\mathit{Re}=550\ (\mathit{Re}_{{\it\delta}^{\ast }}=305)$
and
 $\mathit{Re}=575$
(
 $\mathit{Re}_{{\it\delta}^{\ast }}=319$
). It is clear from these eigenspectra that the flow experiences a Hopf bifurcation for
 $550<\mathit{Re}_{c}<575$
due to an isolated pair of complex-conjugate eigenvalues of the linearised Navier–Stokes operator moving into the upper-half complex plane. A linear interpolation provides a critical Reynolds number
 $\mathit{Re}_{c}=564\ ((\mathit{Re}_{{\it\delta}^{\ast }})_{c}=309)$
only 6 % larger than the critical Reynolds number experimentally obtained by Fransson et al. (Reference Fransson, Brandt, Talamelli and Cossu2005). This good agreement for the value of the critical Reynolds number strongly suggests that the transition observed in the experiment might be the consequence of a three-dimensional global instability of the flow. Comparison of the dominant frequency in the flow dynamics however turned out to be inconclusive, essentially because the frequency reported by Fransson et al. (Reference Fransson, Brandt, Talamelli and Cossu2005) has been measured far beyond the end of the computational domain considered herein (
 $X\simeq 175$
compared to
 $X_{out}=90$
).
Eigenspectra of the linearised Navier–Stokes operator. Circles (blue online) show the eigenvalues for
 $(\mathit{Re},\mathit{Re}_{{\it\delta}^{\ast }})=(550,305)$
, whereas triangles (green online) show the ones for
 $(\mathit{Re},\mathit{Re}_{{\it\delta}^{\ast }})=(575,319)$
.

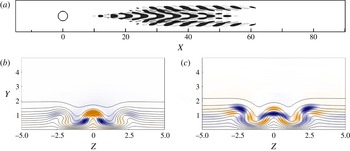
The shape of the associated unstable global mode is depicted on figure 6. As one can see on figure 6(a), this mode takes the form of streamwise alternated patches of positive and negative velocity exhibiting a varicose symmetry with respect to the spanwise mid-plane. To get a better insight of the structure of the mode and of its location with respect to the base flow features, figure 6(b,c) provides slices of its spatial support in the
 $X=23$
and the
 $X=40$
planes. The mode is identified using its streamwise velocity contours (shaded) whereas the solid black lines depict the base flow
 $U_{b}$
isocontours. These figures make it clear that, though the mode is initially located along the central low-speed region, it then contaminates almost the whole spanwise extent of the domain before fading away for
 $X>60$
. Moreover, for all of the streamwise planes considered, the maximum of the mode is located along the shear layers delimiting the central low-speed region and the streaks.
Visualisation of the streamwise velocity component of the leading unstable global mode at
 $(\mathit{Re},\mathit{Re}_{{\it\delta}^{\ast }})=(575,312)$
. (a) Top view of isosurfaces depicting
 $\pm 10\,\%$
of the mode’s maximum streamwise velocity. (b,c) Slices in the (b)
 $X=23$
plane (i.e. where the mode achieve its maximum amplitude) and (c)
 $X=40$
plane, both normalised by the local maximum velocity. The solid lines depict the base flows streamwise velocity isocontours from
 $U_{b}=0.1$
to 0.99.

4. Parametric investigation
In order to get a better understanding of the physical mechanisms underlying the roughness-induced transition, a parametric investigation is conducted. To avoid the potential interaction between roughness elements, the spanwise extent of the computational domain has been changed from
 $L_{z}=10$
to
 $L_{z}=8{\it\eta}$
(with
 ${\it\eta}$
being the aspect ratio of the roughness element considered) such that they behave as being isolated no matter what aspect ratio is considered. Moreover, for the sake of clarity, the theoretical displacement thickness of the incoming Blasius boundary layer at the position of the roughness element is kept equal to
 ${\it\delta}^{\ast }(x_{k})=0.6883$
(the boundary layer thickness being fixed at
 ${\it\delta}_{99}(x_{k})=2$
) throughout this investigation. This allows isolation of the influence of changes in the Reynolds number only and not a mixed combination of changes in the Reynolds number and displacement thickness at the same time. Finally, the aspect ratio
 ${\it\eta}$
of the roughness elements considered will be varied from
 ${\it\eta}=0.85$
up to
 ${\it\eta}=3$
, while the Reynolds number ranges from
 $\mathit{Re}=600$
up to
 $\mathit{Re}=1250$
. Table 3 summarises most of the different cases treated during this parametric investigation.
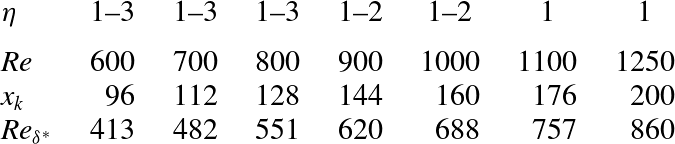
Location
 $x_{k}$
of the roughness element along the flat plate such that
 ${\it\delta}^{\ast }(x_{k})=0.6883$
and the associated Reynolds numbers
 $\mathit{Re},\mathit{Re}_{{\it\delta}^{\ast }}$
for most of the different cases considered in the parametric investigation of § 4.

4.1. Base flow
4.1.1. Influence of the Reynolds number
The influence of the Reynolds number
 $\mathit{Re}$
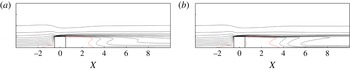
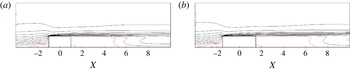
on the base flow can be assessed from figures 7 and 8. Figures 7(a) and 7(b) provide slices of the streamwise velocity component of the base flow in the symmetry plane for
 $(\mathit{Re},{\it\eta})=(600,1)$
and
 $(\mathit{Re},{\it\eta})=(1250,1)$
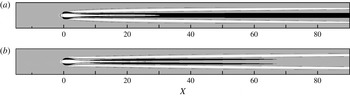
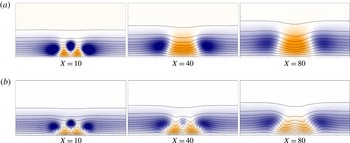
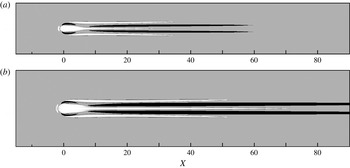
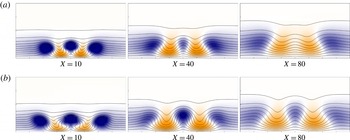
, respectively. It can be seen that when increasing the Reynolds number, the shape of the reversed flow regions remains almost unchanged. The main impact on the flow of an increase of the Reynolds number, and hence a decrease of the effect of viscosity, is to strengthen the gradients, as can be assessed from the stronger deformation of the iso-contours in figure 7(b). Increasing the Reynolds number also has an effect on the streaks induced by the vortical system identified previously. As can be seen on figure 8(a) in the lower Reynolds number case, the central low-speed streak induced by the roughness element blockage is fading away quite rapidly in the streamwise direction and one can even observe a merging of the two outer high-speed streaks resulting in only three streaks near the outflow: a central high-speed streak flanked by two low-speed ones. The merging of the high-speed streaks and the resulting pattern near the outflow can be better observed by visualising the streamwise velocity contours on different
 $X=\text{const.}$
planes, as provided in figure 9(a). A very similar behaviour has already been observed experimentally by Fransson et al. (Reference Fransson, Brandt, Talamelli and Cossu2004) in a highly subcritical configuration. On the other hand, in the higher Reynolds number case shown in figures 8(b) and 9(b), the decrease of the viscosity effect allows the central low-speed region to be sustained over a much longer streamwise extent and prevents, at least in the computational domain considered, the merging of the two high-speed streaks.
Slices in the symmetry plane of different base flows: (a)
 $(\mathit{Re},{\it\eta})=(600,1)$
; (b)
 $(\mathit{Re},{\it\eta})=(1250,1)$
. The dotted line (red online) depicts the spatial extent of the reversed flow regions, whereas the thin solid black lines are the streamwise velocity contours ranging from 0.1 up to 0.99.

Top view of the streaks induced by the roughness elements. Low-speed (white) and high-speed streaks (black) are depicted using isosurfaces of the streamwise velocity deviation of the base flows from the theoretical Blasius boundary layer flow,
 ${\bar{u}}=U_{b}-U_{Bl}$
. (a)
 $(\mathit{Re},{\it\eta})=(600,1)$
,
 ${\bar{u}}=\pm 0.075$
. (b)
 $(\mathit{Re},{\it\eta})=(1250,1)$
,
 ${\bar{u}}=\pm 0.2$
.

Visualisation of the streak patterns in several different streamwise planes for (a)
 $(\mathit{Re},{\it\eta})=(600,1)$
and (b)
 $(\mathit{Re},{\it\eta})=(1250,1)$
. In (a), the colour scale ranges from
 ${\bar{u}}=-0.2$
(blue) to
 ${\bar{u}}=0.2$
(red), while it ranges from
 ${\bar{u}}=-0.4$
(blue) to
 ${\bar{u}}=0.4$
in (b). The solid lines depict the base flow streamwise velocity isocontours from
 $U_{b}=0.1$
to 0.99.

In both cases, the amplitude of the different streaks has been measured from
 $X=10$
, i.e. sufficiently far from the roughness element such that the strongly non-parallel effects induced by the reversed flow region can be discarded. Though the amplitude of the central low-speed region decays monotonically in the streamwise direction for both cases, the initial amplitudes are quite different:
 $\min _{y,z}({\bar{u}})=-0.21$
for
 $\mathit{Re}=600$
and
 $\min _{y,z}({\bar{u}})=-0.47$
for
 $\mathit{Re}=1250$
at the streamwise position
 $X=10$
. On the other hand, the amplitude of the outer streaks varies between
 $\pm 0.14$
for
 $\mathit{Re}=600$
and roughly
 $\pm 0.3$
for
 $\mathit{Re}=1250$
. From the work of Andersson et al. (Reference Andersson, Brandt, Bottaro and Henningson2001), it would thus appear that the
 $\mathit{Re}=600$
case is stable while the
 $\mathit{Re}=1250$
case might be prone to streak instability.
4.1.2. Influence of the aspect ratio
Figures 10(a) and 10(b) provide slices of the streamwise component of two base flows in the spanwise mid-plane obtained for the same Reynolds number and two different aspect ratios, namely
 $(\mathit{Re},{\it\eta})=(600,2)$
and
 $(\mathit{Re},{\it\eta})=(600,3)$
, respectively. As one could have expected, due to the larger blockage induced by the roughness element, the reversed flow regions (depicted by the dotted line) in the case of the
 ${\it\eta}=3$
roughness element have a longer upstream and downstream extent than for the roughness elements of aspect ratio
 ${\it\eta}=1$
and 2 (compare with figure 7
a as well). Moreover, increasing the roughness element aspect ratio also slightly strengthens the gradients of the base flows. It is also worth noting that, when increasing the spanwise blockage given by the cylinder, more and more upstream spanwise vorticity has to wrap around the roughness element, influencing the strength of the vortical system identified previously and, hence, the amplitude of the induced low- and high-speed streaks further downstream. These can be visualised on figure 11 where the deviation from the theoretical Blasius boundary layer of the steady equilibrium solutions for
 $(\mathit{Re},{\it\eta})=(600,2)$
and
 $(\mathit{Re},{\it\eta})=(600,3)$
is shown. Though for the present flows no merging of the high-speed streaks is observed as shown in figure 12, increasing the aspect ratio of the roughness element allows once again the central low-speed region to be sustained on a longer streamwise extent indicating that the amplitude of the streaks is stronger.
Slices in the symmetry plane of different base flows: (a)
 $(\mathit{Re},{\it\eta})=(600,2)$
; (b)
 $(\mathit{Re},{\it\eta})=(600,3)$
. The dotted line (red online) depicts the spatial extent of the reversed flow regions, whereas the thin solid black lines are the streamwise velocity contours ranging from 0.1 up to 0.99.

Top view of the streaks induced by the roughness elements. Low-speed (white) and high-speed streaks (black) are depicted using isosurfaces of the streamwise velocity deviation of the base flows from the theoretical Blasius boundary layer flow,
 ${\bar{u}}=U_{b}-U_{Bl}$
. (a)
 $(\mathit{Re},{\it\eta})=(600,2)$
,
 ${\bar{u}}=\pm 0.2$
. (b)
 $(\mathit{Re},{\it\eta})=(600,3)$
,
 ${\bar{u}}=\pm 0.2$
.

Visualisation of the streaks pattern in several different streamwise planes for (a)
 $(\mathit{Re},{\it\eta})=(600,2)$
and (b)
 $(\mathit{Re},{\it\eta})=(600,3)$
. The colour scale ranges from
 ${\bar{u}}=-0.4$
(blue) to
 ${\bar{u}}=0.4$
(red). Solid lines depict the base flow streamwise velocity isocontours from
 $U_{b}=0.1$
to 0.99.

As previously, the amplitude of the different streaks has been measured from
 $X=10$
such that one can almost neglect the strongly non-parallel influence of the roughness element. While the central low-speed region has an amplitude of
 $-0.4$
at
 $X=10$
for the
 ${\it\eta}=2$
roughness element, its amplitude is
 $-0.54$
for the
 ${\it\eta}=3$
case. However, the amplitude of the outer streaks roughly varies between
 ${\bar{u}}=\pm 0.27$
, for
 ${\it\eta}=2$
, and
 ${\bar{u}}=\pm 0.4$
, for
 ${\it\eta}=3$
. Once again, from the work of Andersson et al. (Reference Andersson, Brandt, Bottaro and Henningson2001), it would thus appear that both cases might be prone to streak local instabilities.
4.2. Global stability
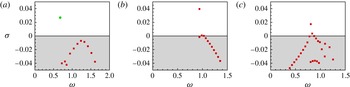
Figure 13 depicts the eigenspectra obtained for three of the cases considered. For all of them, the flow experiences a Hopf bifurcation due to an isolated complex-conjugate pair of eigenvalues moving toward the upper-half complex plane. These isolated modes show a different type of structure depending on the aspect ratio considered. In particular, a sinuous global mode is observed for
 ${\it\eta}=0.85$
and
 ${\it\eta}=1$
(see the circular symbol in figure 13
a), whereas a varicose mode is obtained for
 ${\it\eta}=2$
and
 ${\it\eta}=3$
(see figure 13
b,c). Closely below, all these isolated eigenvalues are followed by a branch of modes exhibiting exclusively a varicose symmetry. For
 ${\it\eta}=3$
, this branch is closer to the isolated mode, so that a second unstable mode can already be observed at
 $\mathit{Re}=700$
. However, since the frequency and the structure of these two unstable modes are very similar, this does not result in strong changes in the related route to transition. It is worth noting that, whereas the isolated eigenvalues do not seem to be to very sensitive to the streamwise extent of the computational domain (provided
 $X_{out}\geqslant 60$
), the branches of eigenvalues on the other hand appear to be extremely sensitive and tend to move toward the upper-half complex plane as the streamwise length of the domain is reduced. For the longest domain considered (i.e.
 $X_{out}=90$
), table 4 provides the critical Reynolds numbers and the symmetry of the associated leading global mode for roughness elements of various aspect ratio
 ${\it\eta}$
. Figure 14 depicts the leading unstable mode for each of the aspect ratios considered, at different Reynolds numbers. Since for all of these modes the streamwise component is at least almost 4 times larger than the other components, only the real part of this component is depicted. As can be seen, all the modes are mostly localised along the central low-speed region, differently from the case of non-isolated cylinder analysed in the previous section for which a large part of the mode migrates on the outer streaks downstream of the roughness element. The crucial importance of such low-speed regions in the roughness-induced transition process to turbulence has already been underlined by previous studies such as the experimental work by Asai, Minagawa & Nishioka (Reference Asai, Minagawa and Nishioka2002), Asai et al. (Reference Asai, Konishi, Oizumi and Nishioka2007), or the numerical investigation by Brandt (Reference Brandt2007) and Denissen & White (Reference Denissen and White2013). More recently, several different authors have observed a similar behaviour in the case of roughness-induced compressible boundary layer flows (Bernardini, Pirozzoli & Orlandi Reference Bernardini, Pirozzoli and Orlandi2012; Balakumar & Kegerise Reference Balakumar and Kegerise2013; de Tullio et al.
Reference de Tullio, Paredes, Sandham and Theofilis2013; Iyer & Mahesh Reference Iyer and Mahesh2013; Subbareddy, Bartkowicz & Candler Reference Subbareddy, Bartkowicz and Candler2014).
Spectrum of eigenvalues for different cases considered in the present work: (a)
 $(\mathit{Re},{\it\eta})=(1200,1)$
; (b)
 $(\mathit{Re},{\it\eta})=(900,2)$
; (c)
 $(\mathit{Re},{\it\eta})=(700,3)$
. Squares (red online) denote varicose modes and the circle (green online) a sinuous one.

Real part of the leading unstable mode streamwise component with increasing roughness element aspect ratio
 ${\it\eta}$
, and different Reynolds numbers: (a)
 $(\mathit{Re},{\it\eta})=(1250,0.85)$
; (b)
 $(\mathit{Re},{\it\eta})=(1125,1)$
; (c)
 $(\mathit{Re},{\it\eta})=(900,2)$
; (d)
 $(\mathit{Re},{\it\eta})=(700,3)$
. The isosurfaces depict
 $u=\pm 10\,\%$
of the maximum amplitude of the modes, whereas open circles denote the location of the roughness elements.

Critical Reynolds numbers
 $\mathit{Re}_{c}$
and
 $\mathit{Re}_{h}^{c}$
, and symmetry of the associated leading unstable global mode for various aspect ratios
 ${\it\eta}$
. S stands for a sinuous global mode, and V for a varicose one.

It is obvious from table 4 and figure 14 that an exchange of symmetry of the leading unstable global mode occurs as the aspect ratio of the roughness element is increased. Whereas sinuous modes are found to be the dominant instability for thin cylindrical roughness elements (
 ${\it\eta}\leqslant 1$
), the varicose global instability turns out to be the dominant one when roughness elements of larger aspect ratio (
 ${\it\eta}\geqslant 2$
) are considered. This exchange of symmetry of the leading unstable mode beyond a given threshold of the roughness element aspect ratio had already been underlined experimentally by Sakamoto & Arie (Reference Sakamoto and Arie1983) and Beaudoin (Reference Beaudoin2004). The former authors have investigated the nature of the vortices shed periodically from prismatic and cylindrical roughness elements immersed within a turbulent boundary layer. For thin roughness elements, they have reported a shedding of von Kármán (sinuous) vortices, whereas they have labelled vortices shed from larger roughness elements as being arch-type exhibiting a varicose symmetry. Though the present set-up is different, due to the laminar nature of the incoming boundary layer flow, results from global stability analyses regarding the spatial structure of the dominant eigenmode are in qualitatively good agreement with their experimental observations, as will be shown in more detail in § 5 by direct numerical simulations.
4.2.1. Analysis of the modes
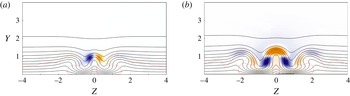
Regarding the sinuous mode, its spatial structure has already been shown in figure 14(a,b). As one can see, it consists of positive and negative patches of velocity mostly localised along the central low-speed region. Its streamwise and wall-normal components exhibit a sinuous symmetry with respect to the spanwise mid-plane, whereas its spanwise component exhibits a varicose symmetry with respect to the same plane (not shown). To get better insight into the structure of the mode and its location with respect to the base flow features, figure 15(a) provides a slice of it in the
 $X=25$
plane for
 $(\mathit{Re},{\it\eta})=(1125,1)$
. The mode is identified using its streamwise velocity contours (shaded) whereas the solid black lines depict the base flow
 $U_{b}$
isocontours. The fully three-dimensional shear layer developing around the velocity streaks, here depicted by the dotted line, is identified using the points of null curvature in the
 $U_{b}$
distribution, i.e.
 $\partial ^{2}U_{b}/\partial y^{2}+\partial ^{2}U_{b}/\partial z^{2}=0$
. It can be seen that the regions of maximum amplitude of the mode are located on the flanks of the central low-speed region along its shear layer. This particular location, where the wall-normal and spanwise gradients of the base flow are relatively strong, leads us to think that this sinuous global instability is likely to extract the energy for its growth from the transport of these two shears along the central low-speed region, as will be shown in detail in § 4.3.
Slices of the streamwise component of (a) the sinuous unstable global mode,
 $(\mathit{Re},{\it\eta})=(1125,1)$
, and (b) the varicose global mode,
 $(\mathit{Re},{\it\eta})=(850,2)$
, in the
 $X=25$
plane identified by the shaded red and blue contours. Solid lines depict the base flows streamwise velocity isocontours from
 $U_{b}=0.1$
to 0.99, whereas the dotted line (red online) shows the location of the shear layer identified by the points of null curvature (i.e.
 $\partial ^{2}U_{b}/\partial y^{2}+\partial ^{2}U_{b}/\partial z^{2}=0$
).

The second type of global instability identified from figure 14(c,d) is a varicose global instability. Like its sinuous counterpart, this second family of unstable modes is essentially localised along the central low-speed region and consists of streamwise alternated patches of positive and negative velocity. The major difference is however the symmetry of the mode: its streamwise and wall-normal components now exhibit a varicose symmetry with respect to the spanwise mid-plane, whereas its spanwise component exhibits a sinuous symmetry (not shown). As previously, in order to gain a better understanding of the mode structure, a slice of it in the streamwise
 $X=25$
plane is depicted on figure 15(b) for
 $(\mathit{Re},{\it\eta})=(850,2)$
. Again like its sinuous counterpart, the varicose mode is essentially located along the shear layer delimiting the central low-speed region. It is worth noting however that, for the set of parameters considered here, small non-zero patches of velocity are visible on the shear layers of the lateral low-speed streaks as well. Once again, this location of the mode lets us conjecture that it essentially extracts the energy necessary for its growth from the transport of the base flow streamwise component shears along the whole shear layer. One must also be aware that all of the modes belonging to the branches of eigenvalues observed in the spectra depicted on figure 13 share common features with this particular varicose mode.
It is worth noting finally that, relatively far from the roughness element, the shapes of these global modes visualised in different
 $X=\text{const.}$
planes are very similar to that found by Brandt (Reference Brandt2007) and more recently by Denissen & White (Reference Denissen and White2013) and de Tullio et al. (Reference de Tullio, Paredes, Sandham and Theofilis2013) using a local stability approach. Due to the strong predominance of the base flow streamwise component and its nearly parallel nature far from the roughness element, it is expected that the two approaches, global and local, give similar results regarding the shape of the modes in the almost parallel parts of the flow. However, the critical Reynolds numbers can be greatly over- or under-predicted when the non-parallel flow regions in the vicinity of the roughness element are not taken into account, as will be discussed in § 4.4.
4.3. Perturbation kinetic energy budget
Aiming to get a better understanding of the mechanisms causing the flow to become unstable and to understand how and where the sinuous and varicose unstable global modes extract their energy, the transfer of kinetic energy between the base flow and the global modes is investigated. Similar analysis has already been conducted in a local framework by Brandt (Reference Brandt2007). Calculating this kinetic energy transfer has proven to be very helpful in order to get a better insight into the instability mechanisms. The kinetic energy rate of change is given by the Reynolds–Orr equation:
 $$\begin{eqnarray}\frac{\partial E}{\partial t}=-D+\mathop{\sum }\limits_{i=1}^{9}\int _{V}I_{i}\,\text{d}V\end{eqnarray}$$
where the total kinetic energy and the total dissipation in the computational domain volume
 $V$
are given by
 $$\begin{eqnarray}E=\frac{1}{2}\int _{V}\boldsymbol{u}\boldsymbol{\cdot }\boldsymbol{u}\text{d}V,\quad D=\frac{1}{\mathit{Re}}\int _{V}\boldsymbol{{\rm\nabla}}\boldsymbol{u}:\boldsymbol{{\rm\nabla}}\boldsymbol{u}\text{d}V\end{eqnarray}$$
and where the integrands
 $I_{i}$
which represent the production terms are:
 $$\begin{eqnarray}\left.\begin{array}{@{}l@{}}I_{1}=\displaystyle -u^{2}\frac{\partial U_{b}}{\partial x},\quad I_{2}=-uv\frac{\partial U_{b}}{\partial y},\quad I_{3}=-uw\frac{\partial U_{b}}{\partial z},\\ I_{4}=\displaystyle -uv\frac{\partial V_{b}}{\partial x},\quad I_{5}=-v^{2}\frac{\partial V_{b}}{\partial y},\quad I_{6}=-vw\frac{\partial V_{b}}{\partial z},\\ I_{7}=\displaystyle -wu\frac{\partial W_{b}}{\partial x},\quad I_{8}=-wv\frac{\partial W_{b}}{\partial y},\quad I_{9}=-w^{2}\frac{\partial W_{b}}{\partial z}.\end{array}\right\}\end{eqnarray}$$
The sign of the different integrands
 $I_{i}$
indicates whether the local transfer of kinetic energy associated with them acts as stabilising (negative) or destabilising (positive). For the sake of comparison, all the kinetic energy budgets presented in this section have been normalised by the dissipation
 $D$
.
4.3.1. Sinuous instability
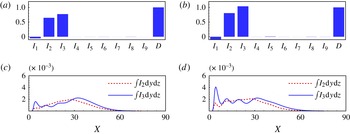
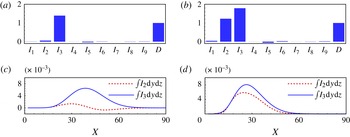
Figures 16(a) and 16(b) provide the integral over the whole computational domain of the production terms
 $I_{1}$
to
 $I_{9}$
along with the diffusion term
 $D$
for
 $(\mathit{Re},{\it\eta})=(1125,1)$
and
 $(\mathit{Re},{\it\eta})=(1250,1)$
, respectively. As one can see, only the base flow streamwise-component-related shears (
 $\int _{V}I_{1}\text{d}V$
,
 $\int _{V}I_{2}\text{d}V$
and
 $\int _{V}I_{3}\text{d}V$
) provide a significant contribution to the energy transfer. More particularly, as expected from the analysis of the shape of the mode in the
 $X=25$
plane shown in figure 15(a), this sinuous instability essentially extracts its energy from the work of the Reynolds stresses
 $uv$
against the wall-normal gradient of the base flow streamwise component
 $\partial U_{b}/\partial y\ (I_{2})$
, as well as from the work of
 $uw$
against the spanwise gradient
 $\partial U_{b}/\partial z\ (I_{3})$
no matter what the Reynolds number considered. Figures 16(c) and 16(d) provide the streamwise evolution of
 $\int _{y,z}I_{2}\text{d}y\text{d}z$
(dashed line) and
 $\int _{y,z}I_{3}\text{d}y\text{d}z$
(solid line) for the two Reynolds numbers considered. As one can see, in both cases, a large peak in the streamwise evolution of the spanwise production term occurs in the vicinity of the downstream reversed flow region. The major impact of an increase of the Reynolds number beyond its critical value is to greatly amplify the amount of energy extracted from this near-wake region, whereas the energy extraction process further downstream seems to be only slightly influenced. This might indicate that the instability mechanism linked to the sinuous mode has its origin mostly in the near-wake region, as will be further discussed in § 4.4. The spatial distributions of the
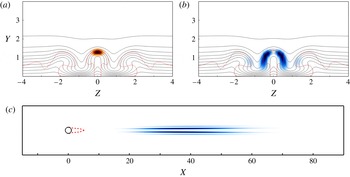
 $I_{2}$
and
 $I_{3}$
production terms in the
 $X=25$
plane for
 $(\mathit{Re},{\it\eta})=(1125,1)$
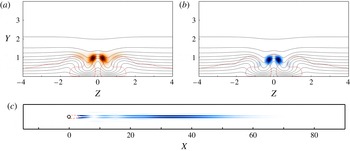
are depicted on figures 17(a) and 17(b), respectively. As one can see, the sinuous global mode mostly extracts its energy spatially from the lateral parts of the central low-speed region’s delimiting shear layer. Moreover, the spatial distribution in the
 $y=0.75$
horizontal plane of
 $I_{3}$
is depicted on figure 17(c). As highlighted by the kinetic energy budget, this production term appears to be very active just downstream of the roughness element as well as further downstream along the sides of the central low-speed region.
(a,b) Sinuous unstable mode kinetic energy budget integrated over the whole domain. (c,d) Streamwise evolution of the production terms
 $\int _{y,z}I_{2}\text{d}y\text{d}z$
and
 $\int _{y,z}I_{3}\text{d}y\text{d}z$
. (a,c)
 $(\mathit{Re},{\it\eta})=(1125,1)$
; (b,d)
 $(\mathit{Re},{\it\eta})=(1250,1)$
.

(a,b) Spatial distribution of (a) the
 $I_{2}=-uv\partial U_{b}/\partial y$
and (b)
 $I_{3}=-uw\partial U_{b}/\partial z$
production terms in the plane
 $X=25$
for
 $(\mathit{Re},{\it\eta})=(1125,1)$
. Solid lines depict the base flow streamwise velocity isocontours from
 $U_{b}=0.1$
to 0.99, whereas the dotted lines (red online) show the location of the shear layer. (c) Spatial distribution of
 $I_{3}=-uw\partial U/\partial z$
in the
 $y=0.75$
horizontal plane.

4.3.2. Varicose instability
Results for the varicose instability are summarised in figure 18(a,c) for
 $(\mathit{Re},{\it\eta})=(850,2)$
and figure 18(b,d) for
 $(\mathit{Re},{\it\eta})=(1000,2)$
. At
 $\mathit{Re}=850$
, slightly above the critical Reynolds number, one can see on figure 18(a) that, though
 $\int _{V}I_{2}\text{d}V$
gives a small non-zero contribution to the energy extraction process, the mode surprisingly extracts most of its energy from the work of
 $uw$
against the spanwise gradient of the base flow streamwise component
 $\partial U_{b}/\partial z$
, whereas in a local framework, varicose modes are mostly linked to the transport of the wall-normal gradient. Looking at the streamwise evolution of these two terms depicted on figure 18(c) helps us to understand this surprising dominance of
 $\int _{V}I_{3}\text{d}V$
. Whereas
 $\int _{y,z}I_{3}\text{d}y\text{d}z$
is positive throughout the whole streamwise extent of the domain, one can see that
 $\int _{y,z}I_{2}\text{d}y\text{d}z$
actually acts as slightly stabilising in a large portion of the computational domain (from
 $X\simeq 40$
up to
 $X\simeq 70$
). This can be explained by the features of the associated base flow: while the spanwise gradient remains more or less constant throughout the computational domain, the destabilising effect of the wall-normal gradient induced by the central low-speed region quickly drops as the central low-speed region starts to fade away beyond
 $X\simeq 40$
. Figure 18(b,d) provides the same analysis for
 $(\mathit{Re},{\it\eta})=(1000,2)$
. It is clear from the global kinetic energy budget depicted on figure 18(b) that, whereas the contribution of
 $\int _{V}I_{3}\text{d}V$
does not change much, the contribution of
 $\int _{V}I_{2}\text{d}V$
significantly increases. This is also clearly visible on figure 18(d) where the region within which the wall-normal shear was acting as stabilising at lower Reynolds numbers has now disappeared. This behaviour can once again be explained by the features of the associated base flow. As shown in § 4.1.1, increasing the Reynolds number yields a strengthening of the wall-normal gradients and causes the central low-speed region to be sustained over a much longer streamwise extent. As a consequence, the varicose perturbation can then take advantage of this to extract more energy from the wall-normal gradient of
 $U_{b}$
over a longer streamwise distance. Two other major differences with respect to the sinuous instability can also be recovered from these kinetic energy transfer analyses. First of all, figure 19(a,b) provides the spatial distribution of the
 $I_{2}$
and
 $I_{3}$
integrands in the streamwise
 $X=25$
plane. Whereas the sinuous instability is essentially extracting its energy from the lateral parts of the low-speed region shear layer, one can see in the present case that the varicose mode seems to be an instability of the fully three-dimensional shear layer as a whole. More importantly, no peak of energy extraction can be found in the near-wake region for the varicose instability as highlighted by the curves on figure 18(c,d) as well as on the spatial distribution of the
 $I_{3}$
term in an horizontal plane as shown on figure 19(c).
(a,b) Varicose unstable mode kinetic energy budget integrated over the whole domain. (c,d) Streamwise evolution of the production terms
 $\int _{y,z}I_{2}\text{d}y\text{d}z$
and
 $\int _{y,z}I_{3}\text{d}y\text{d}z$
. (a,c)
 $(\mathit{Re},{\it\eta})=(850,2)$
; (b,d)
 $(\mathit{Re},{\it\eta})=(1000,2)$
.

Spatial distribution of (a) the
 $I_{2}=-uv\partial U_{b}/\partial y$
and (b)
 $I_{3}=-uw\partial U_{b}/\partial z$
production terms in the plane
 $X=25$
for
 $(\mathit{Re},{\it\eta})=(850,2)$
. Solid lines depict the base flows streamwise velocity isocontours from
 $U_{b}=0.1$
to 0.99, whereas the dotted lines (red online) show the location of the shear layer. (c) Spatial distribution of
 $I_{3}=-uw\partial U/\partial z$
in the
 $y=0.75$
horizontal plane.

4.4. Wavemaker
Investigating the perturbation kinetic energy budget has proven helpful to get a better understanding of the instability mechanisms. Yet, such analysis provides only limited information about the core region of the instability, i.e. the region known as the wavemaker. The concept of wavemaker was introduced by Giannetti & Luchini (Reference Giannetti and Luchini2007) and Marquet, Sipp & Jacquin (Reference Marquet, Sipp and Jacquin2008) where it has been illustrated on the global instability of the two-dimensional cylinder flow. It enables one to identify the most likely region for the inception of the global instability under consideration. Following the definition by Giannetti & Luchini (Reference Giannetti and Luchini2007), the wavemaker is given as the overlap of the direct and adjoint modes:
 $$\begin{eqnarray}{\it\zeta}(x,y,z)=\frac{\Vert \boldsymbol{u}(x,y,z)\Vert \,\Vert \boldsymbol{u}^{\dagger }(x,y,z)\Vert }{\langle \boldsymbol{u}^{\dagger },\boldsymbol{u}\rangle }\end{eqnarray}$$
where
 $\boldsymbol{u}^{\dagger }$
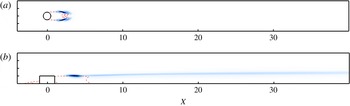
is the adjoint of the global mode considered. For the set of adjoint equations and visualisations of the adjoint sinuous and varicose modes, the reader is referred to appendix A. Figures 20(a) and 20(b) depict the wavemaker region for the sinuous instability and the varicose one, respectively. It is clear from these figures that the sinuous and varicose instabilities have very different sensitivity regions.
Visualisation of the wavemaker region of the leading mode for (a) the sinuous instability in the
 $y=0.5$
plane,
 $(\mathit{Re},{\it\eta})=(1125,1)$
, and (b) the varicose instability in the
 $z=0$
plane,
 $(\mathit{Re},{\it\eta})=(900,2)$
. The dashed lines (red online) depict the spatial extent of the reversed flow region.

Sinuous instability: as shown on figure 20(a), the wavemaker of the sinuous global mode is exclusively localised within the downstream reversed flow region, having its maximum values along the flanks of the recirculation bubble, very similarly to what is found for a two-dimensional cylinder flow (compare with figure 17 in Giannetti & Luchini Reference Giannetti and Luchini2007). Once combined with the knowledge acquired from the kinetic energy analysis, it thus appears that the sinuous global mode extracts its energy from two different underlying instability mechanisms.
-
(i) First, a global instability of the downstream reversed flow region takes place. According to the nature of the mode and the location of its wavemaker, the sinuous global mode seems to be related to the von Kármán global instability encountered in a supercritical two-dimensional cylinder flow (Giannetti & Luchini Reference Giannetti and Luchini2007; Marquet et al. Reference Marquet, Sipp and Jacquin2008).
-
(ii) Then, due to the spatially convective nature of the central low-speed region, the sinuous mode experiences weak spatial convective growth before eventually fading away.
It thus appears from these results that the sinuous global instability observed in the present investigation is very different from the sinuous instability of optimal streaks underlined by Andersson et al. (Reference Andersson, Brandt, Bottaro and Henningson2001).
Varicose instability: it is clear from figure 20(b) that the core region of the varicose instability is quite different from that of the sinuous one: its wavemaker is not only localised within the downstream reversed flow region but also extends along the top of the central low-speed region. This spatial extent further highlights the key role of the central low-speed region and outer streaks on this global instability. However, despite its elongated nature, it is worth noting that the amplitude of the varicose wavemaker within the downstream reversed flow region still is almost ten to fifteen times larger than that within the wake of the roughness element. From these elements, the following thus is apparent.
-
(i) The varicose mode has its roots in a global instability of the downstream reversed flow region. However, based on the kinetic energy budget, this particular region appears to behave essentially as a wave generator and plays very little role in the energy extraction process of the varicose instability.
-
(ii) Once generated from the wavemaker, the varicose global mode then experiences large spatial transient growth along the central low-speed region induced by the roughness element that dominates the whole energy budget.
As will be shown in § 5.1, such varicose global instability nonlinearly seems to give rise to hairpin vortices shed directly from the roughness element. It thus appears that the linear mechanism identified from the perturbation kinetic energy and wavemaker analyses of this varicose global instability is similar to the one proposed by Acarlar & Smith (Reference Acarlar and Smith1987) for the creation of hairpin vortices just downstream of a hemispheric protuberance, i.e. a small roll-up of the downstream shear layer that is then convected by the flow and greatly amplified along the central-low speed region, eventually giving birth to a hairpin vortex by nonlinear effects.
5. Nonlinear evolution
5.1. Varicose global instability
In order to have a glimpse of the nonlinear evolution of the varicose global instability identified previously, a direct numerical simulation (DNS) of the Fransson set-up already introduced in § 3 is conducted for
 $\mathit{Re}=575$
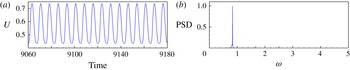
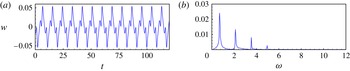
, for which the global stability analysis of the base flow predicts that only a single varicose global mode is unstable. The nonlinear Navier–Stokes equations have been initialised using the base flow solution and are marched in time until a statistically steady state was reached. Figure 21(a) shows the streamwise velocity signal recorded by a probe located at
 $(X,y,z)=(10,0.5,0)$
, while figure 21(b) presents the associated Fourier spectrum. It is clear from figure 21(a) that the dynamics of the flow exhibit well established periodic oscillations. As shown in figure 21(b), these oscillations of the flow have a circular frequency
 ${\it\omega}_{DNS}=0.832$
, very close to that of the unstable varicose global mode identified in § 3.2 (i.e.
 ${\it\omega}=0.824$
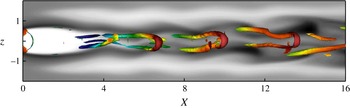
). Figure 22 depicts instantaneous vortical structures present within the flow that have been identified using the
 ${\it\lambda}_{2}$
criterion (Jeong & Hussain Reference Jeong and Hussain1995). It seems obvious from this figure that these vortical structures are hairpin vortices shed directly downstream of the roughness element. It thus appears that the self-sustaining oscillations of the flow recorded by the probe consist of a periodic shedding of hairpin vortices resulting in a varicose modulation of the central low-speed region and surrounding velocity streaks. Moreover, it can be assessed from the large population of hairpin vortices that transition is triggered very close to the roughness element, consistent with the numerous experimental observations reviewed by von Doenhoff & Braslow (Reference von Doenhoff and Braslow1961). Based on these observations and on results from global stability analyses, one can conclude that the unstable varicose global mode contributes to the birth of the set of hairpin vortices nonlinearly generated and might thus explain the early transition observed in the experimental work by Fransson et al. (Reference Fransson, Brandt, Talamelli and Cossu2005) for supercritical Reynolds numbers.
(a) Probe measurements and (b) normalised Fourier spectrum of the spanwise velocity in the near-wake region at
 $(X,y,z)=(10,0.5,0)$
for the Fransson set-up.

Top view of the hairpin vortices visualised by the isosurfaces of the
 ${\it\lambda}_{2}=-0.025$
criterion coloured with the local kinetic energy of the flow.

5.2. Sinuous global instability
Most studies on roughness-induced transition have focused on roughness elements of relatively large aspect ratio (
 ${\it\eta}\geqslant 2$
) and, in fact, on the unsteadiness related to the varicose instability mechanism only (Acarlar & Smith Reference Acarlar and Smith1987; Tufo et al.
Reference Tufo, Fischer, Papka and Blom1999; Stephani & Goldstein Reference Stephani and Goldstein2009; Zhou, Wang & Fan Reference Zhou, Wang and Fan2010; de Tullio et al.
Reference de Tullio, Paredes, Sandham and Theofilis2013), whereas very little can be found in the literature regarding the nonlinearly saturated sinuous instability (Sakamoto & Arie Reference Sakamoto and Arie1983; Beaudoin Reference Beaudoin2004). In the following section, we thus focus our attention more closely on the nonlinear evolution of the sinuous global mode using direct numerical simulations of the nonlinear Navier–Stokes equations. More specifically, the nature of the bifurcation will be determined as well as the flow pattern and dynamics resulting from the nonlinear saturation of the sinuous unstable global mode. The direct numerical simulations to be described have been performed for an aspect ratio
 ${\it\eta}=1$
roughness element and Reynolds numbers ranging from 1030 up to 1125. The velocity field used for initialising the DNS consists of the unstable equilibrium state onto which a small disturbance made up of the sinuous global mode is superimposed. The initial energy of the perturbation field is chosen to be
 $10^{8}$
times smaller than the energy of the base flow to ensure that no by-pass transition could be triggered due to the initial amplitude of the perturbation. The resulting flow field is then marched in time until nonlinear saturation is reached and a statistically steady state is obtained.
5.2.1. Criticality of the bifurcation
Before investigating the nonlinear dynamics, the super- or subcritical nature of the sinuous Hopf bifurcation is characterised. To do so, the Reynolds number of the nonlinearly saturated flow is incrementally decreased from
 $\mathit{Re}=1125$
until a steady flow is reached. Provided a steady solution is recovered for
 $\mathit{Re}=\mathit{Re}_{c}$
, the bifurcation is then determined as being supercritical. Otherwise, the bifurcation is labelled as being subcritical. Since the base flow is symmetric with respect to the
 $z=0$
plane, the spanwise velocity recorded by a probe located at
 $(X,y,z)=(10,0.5,0)$
represents a clear signature of evolution of the sinuous unstable mode. As a consequence, this measurement appears to be a good indicator to monitor how far the nonlinearly saturated flow has departed from the base flow solution. The evolution of the maximum amplitude of this variable with respect to changes in the Reynolds number is depicted on figure 23. As the Reynolds number is decreased from
 $\mathit{Re}=1125$
to 1030, the maximum amplitude of the spanwise velocity recorded by the probe is also decreasing. Moreover, below the critical Reynolds number
 $\mathit{Re}_{c}=1040$
, no more self-sustained oscillations of the flow are observed. Similar observations have been made from the signals recorded by other probes placed within the flow. This particular behaviour, i.e. no oscillation below the critical Reynolds number predicted by linear stability analysis, provides striking evidence for the sinuous Hopf bifurcation being supercritical. This is further confirmed by how the maximum amplitude of the perturbation depends on the off-criticality parameter
 ${\it\epsilon}=\mathit{Re}-\mathit{Re}_{c}$
. The solid line in figure 23 depicts the least-square best fit obtained using
 $\sqrt{\mathit{Re }-\mathit{ Re }_{c}}$
as the fitting function. It is clear that the maximum amplitude evolves as the square-root of the off-criticality parameter, another clear signature of the supercritical nature of this bifurcation. Consequently, the unsteadiness observed in the near-wake region in the direct numerical simulation can be traced back to the sinuous unstable global mode and not to any kind of by-pass transition.
Bifurcation diagram of the sinuous instability for
 ${\it\eta}=1$
. Squares depict the perturbation spanwise amplitude at
 $(X,y,z)=(10,0.5,0)$
whereas the black solid line shows the least-square best fit. The dashed line at zero amplitude indicates the branch of equilibrium solutions which becomes unstable for
 $\mathit{Re}\geqslant \mathit{Re}_{c}$
.

(a) Probe measurements and (b) Fourier spectrum of the spanwise velocity in the near-wake region at
 $(X,y,z)=(10,0.5,0)$
.

Close-up of the hairpin vortices (visualised by the coloured isosurface of
 ${\it\lambda}_{2}=-0.06$
) shed in the near-wake region. Shaded grey contours depict the streamwise velocity distribution in the
 $y=0.5$
horizontal plane. A clear sinuous wiggling of the streaks can be observed.

5.2.2. Dynamics
Self-sustained oscillations are defined as persistent oscillations of the system arising in the absence of any forcing or regardless of the nature of the small-amplitude forcing eventually due to experimental or environmental noise. Such oscillations can be observed in the near-wake region as highlighted by the spanwise velocity measurement recorded from the probe located at
 $(X,y,z)=(10,0.5,0)$
and the associated Fourier spectrum (see figures 24
a and 24
b, respectively). It is clear that saturated periodic dynamics is well established in the near-wake laminar region with a dominant circular frequency
 ${\it\omega}_{DNS}=0.687$
close to that predicted by global stability analysis (i.e.
 ${\it\omega}=0.672$
). Figure 25 depicts the instantaneous streamwise velocity distribution in the
 $y=0.5$
plane. It appears obvious from this figure that the self-sustained oscillations recorded by the probe are related to a sinuous wiggling of the central low-speed region induced by the sinuous global instability of the flow identified previously. The main wavelength of this wiggling has been extracted by taking the Fourier transform in the
 $X$
direction of the saturated flow signal extracted at
 $(y,z)=(0.5,0)$
. A dominant streamwise wavelength of approximately 6.1 has been found, which matches well with the one characterising the sinuous eigenmode, 6.9, extracted by Fourier transform of the eigenmode in
 $X$
. However, despite the sinuous wiggling of the central low-speed region,
 ${\it\lambda}_{2}$
visualisations (Jeong & Hussain Reference Jeong and Hussain1995) of the instantaneous vortical structures depicted on figures 25 and 26 reveal the existence of hairpin vortices shed directly from the roughness element. Such shedding of hairpin vortices behind roughness elements has already been investigated by Acarlar & Smith (Reference Acarlar and Smith1987), Tufo et al. (Reference Tufo, Fischer, Papka and Blom1999) and Zhou et al. (Reference Zhou, Wang and Fan2010) on hemispherical elements, and more recently by Stephani & Goldstein (Reference Stephani and Goldstein2009) on a cylindrical one. One major difference with these works and the results presented in § 5.1 however is the nature of the shedding. In the cited works, hairpin vortices are exhibiting a varicose symmetry with respect to the spanwise mid-plane. In the present case on the other hand, figure 25 clearly highlights that the hairpin vortices shed from the roughness element considered herein are initially modulated by the sinuous wiggling of the central low-speed region before eventually causing the flow to transition to turbulence further downstream as illustrated on figure 26. It is not clear at the present time however whether the mechanism responsible for the creation of these hairpin vortices is the same as the one described by Acarlar & Smith (Reference Acarlar and Smith1987) for hemispherical roughness elements or if they result from more complicated interactions between the mean flow and the nonlinearly saturated sinuous global instability.
Hairpin vortices visualised by the isosurfaces of the
 ${\it\lambda}_{2}=-0.06$
criterion coloured with the local kinetic energy.

5.3. Comparison with the von Doenhoff–Braslow transition diagram
Roughness-induced transition has been extensively investigated since the early 1950s. The large body of literature existing on the subject has been well summarised by von Doenhoff & Braslow (Reference von Doenhoff and Braslow1961) on a transition diagram, reproduced on figure 27. Based on the roughness Reynolds number
 $\mathit{Re}_{h}=U_{Bl}(x_{k},h)h/{\it\nu}$
(where
 $U_{Bl}(x_{k},h)$
is the value of the Blasius velocity profile evaluated at the roughness element position
 $x_{k}$
and height
 $h$
) and the aspect ratio of the roughness elements considered, this diagram allows one to predict the outcome of his experiment:
-
(i) if the parameters characterising the flow set-up lie below the grey zone of this diagram, it is then expected that the flow observed downstream the roughness element is laminar and steady;
-
(ii) if these parameters lie above the grey zone, it is expected that transition has already occurred just downstream of the roughness elements considered;
-
(iii) finally, within the grey zone, the flow may undergo transition to turbulence or experience unsteadiness, depending on the other configuration parameters (shape, spanwise spacing, etc.).
Reproduction of the transition diagram by von Doenhoff & Braslow (Reference von Doenhoff and Braslow1961). Squares (green online) depict the critical value of the sinuous instability, whereas circles (red online) denote the critical value for varicose instability and the black cross the critical threshold in the experiment by Fransson et al. (Reference Fransson, Brandt, Talamelli and Cossu2005).

It is noteworthy that the results summarized in the von Doenhoff & Braslow (Reference von Doenhoff and Braslow1961) diagram stem from various experimental investigations of transition induced by isolated and/or periodic arrays of roughness elements of different shapes (cylindrical, hemispheric, prismatic, etc.) and wind tunnels of variable quality, thus explaining the large spread of the transition region (grey shaded area in figure 27). Nonetheless, this transition diagram allows qualitative comparison of the theoretical predictions with experimental results and still is widely used nowadays in industry.
The various critical thresholds predicted by the global stability analyses performed here have been rescaled to their roughness Reynolds number counterparts and reported on this transition diagram. Red dots stand for the critical Reynolds numbers for varicose global instability, whereas the green squares stand for the critical Reynolds numbers for sinuous global instability. All of these critical Reynolds numbers lie within the transition band of the diagram. These positions suggest that a fully three-dimensional global instability of the reversed flow region might be one of the possible explanations of the roughness-induced transition.
6. Summary and conclusions
The properties of the incompressible flow induced by three-dimensional cylindrical roughness elements of various aspect ratios have been investigated by the joint application of fully three-dimensional global stability analyses and direct numerical simulations. In all cases considered, horseshoe vortices are created around the roughness element, whose legs create two pairs of high- and low-speed streamwise streaks due to the lift-up effect. Furthermore, a central low-speed region, whose crucial importance in the transition process has been indicated by several authors, as well as in the present work, is created due to the streamwise velocity blockage induced by the presence of the roughness element. The strength of this central low-speed region, and whether or not it is sustained over a long streamwise distance, is closely linked both to the aspect ratio of the roughness element and to the Reynolds number.
Regarding the stability of such flows, two different types of global instabilities have been identified. The symmetry of the dominant unstable mode depends on the aspect ratio of the roughness element considered. For thin cylindrical roughness elements, the first bifurcation encountered is related to a sinuous global instability of the lateral parts of the shear layers developing in the downstream flow, whereas for larger roughness elements, it is related to a varicose instability of the three-dimensional shear layer as a whole. The underlying physical mechanisms are investigated by means of a kinetic energy transfer analysis between the base flow and the perturbations as well as by the computation of the wavemaker of the two global instabilities identified. Though both instabilities are essentially fed by the work of the Reynolds stresses against the wall-normal and spanwise gradients of the base flow streamwise component, some major differences are observed that allow us to clearly differentiate between the underlying mechanisms. On the one hand, the sinuous instability is related to a global instability of the near-wake region and of the associated reversed flow region similar to what occurs in a supercritical two-dimensional cylinder flow. On the other hand, the varicose mode appears to be related to a global instability of the whole three-dimensional shear layer surrounding the central low-speed streak. In particular, a weak pocket of instability is originated in the near wake, which is strongly amplified further downstream due to the highly convective nature of the downstream flow similarly to the explanation proposed by Acarlar & Smith (Reference Acarlar and Smith1987) regarding the creation of hairpin vortices just downstream of hemispheric roughness elements.
The nonlinear evolutions of both instabilities have been investigated using direct numerical simulations. For roughness elements having a relatively large aspect ratio, it has been shown that the varicose global instability of the flow gives rise to a shedding of hairpin vortices just downstream of the roughness elements. These hairpin vortices trigger a very rapid transition of the flow just after the roughness elements. Despite the transitional dynamics, Fourier analysis has shown that the dominant frequency involved in the dynamics is in good agreement with the predictions made by global stability analysis. The nonlinear evolution of the sinuous global instability has been investigated more deeply. Varying the Reynolds number of the simulation has revealed that the amplitude of the sinuous perturbation, measured by a probe in the spanwise mid-plane, evolves as the square root of the off-criticality parameter (i.e.
 ${\it\epsilon}=\mathit{Re}-\mathit{Re}_{c}$
). Such an evolution is typical of supercritical bifurcations. Analyses of the dynamics show that the sinuous global mode induces a wiggling of the central low-speed region. Once again, the dominant frequency involved in these dynamics is well predicted by global stability analyses. Nonetheless, identification of the vortical structures present within the flow also revealed the existence of hairpin vortices shed just downstream of the roughness element. These hairpin vortices slightly oscillate, showing a sinuous wiggling, and are then convected by the flow, eventually triggering transition to turbulence further downstream. It is not clear at the present time if these hairpin vortices are created by a mechanism similar to that described by Acarlar & Smith (Reference Acarlar and Smith1987) or if they result from complicated nonlinear interactions between the mean flow and the nonlinearly saturated sinuous instability.
Finally, the different transition thresholds computed by the fully three-dimensional global stability analyses have been reported on the transition diagram by von Doenhoff & Braslow (Reference von Doenhoff and Braslow1961). Qualitatively good agreement is found between the predictions obtained from linear global stability analyses and those of the transition diagram. Moreover, the experimental configuration used by Fransson et al. (Reference Fransson, Brandt, Talamelli and Cossu2005) has been numerically reproduced; predictions of the global instability analysis in this configuration show a very good agreement with the critical Reynolds number measured by the previously mentioned authors. These elements allow us to conjecture that a global instabilities of the reversed flow region developing just downstream of the roughness element may be a possible explanation of the roughness-induced transition, at least in the configurations considered herein.
6.1. Concluding remarks
The present work has provided some answers on the global origin of two different instabilities arising past a cylindrical roughness element, on their onset depending on the aspect ratio of the cylinder, and on the vortical structures and frequencies observed in the route to turbulence for both transition scenarios. However, several questions still remain unanswered and require further qualitative and quantitative investigations, namely:
-
(i) What is the mechanism responsible for the creation of hairpin vortices in the case of a sinuous global instability of the flow?
-
(ii) What is the role of fully three-dimensional linearly and nonlinearly transiently growing perturbations in the transition process? Under which conditions, if any, can such optimal perturbations trigger transition to turbulence and, as such, by-pass all of the linear instability scenario?
-
(iii) How does the shape of the three-dimensional roughness element influence the transition process?
Concerning transiently growing perturbations, previous works have provided some elements indicating that they also might have a role in the transition process. In the case of the streaky flow induced by a rectangular panel, Asai et al. (Reference Asai, Minagawa and Nishioka2002, Reference Asai, Konishi, Oizumi and Nishioka2007) and Brandt (Reference Brandt2007) have shown that the flow can exhibit local convective instability. As shown by Chomaz (Reference Chomaz2005), such convective instability is closely related to transient growth. Very recently, Cherubini et al. (Reference Cherubini, De Tullio, De Palma and Pascazio2013) have moreover demonstrated that three-dimensional linear optimal perturbations can trigger localised transition of the flow induced by a smooth roughness element. For the range of subcritical roughness Reynolds numbers investigated, the unsteadiness was however observed not to be self-sustaining and was eventually washed out from the computational domain, the flow slowly recovering toward its initial state. Under which conditions these optimal perturbations may lead to a self-sustaining instability, and whether including the effects of nonlinearity in the computation of these perturbations may lead to an early transition are points that still remain to be unravelled.
Finally, concerning the influence of the shape of the roughness element on the stability of the flow, the present authors (Loiseau et al. Reference Loiseau, Cherubini, Robinet, Leriche, Theofilis and Soria2013) have already presented preliminary results indicating that, for a fixed aspect ratio, the smoother the roughness element the higher the critical Reynolds number beyond which linearly global instability of the flow can set in. Future work will aim at clarifying these aspects.
Acknowledgements
This work has received the financial support of the French National Agency for Research (ANR) through the grant ANR-09-SYSCOMM-011-SICOGIF. Moreover, most of the computations have been performed on the IBM x3750 (Ada) at IDRIS, Orsay, France. Finally, the authors would like to thank G. Dergham for the preliminary stability calculations he ran when this investigation was started.
Appendix A. Adjoint equations and adjoint modes
Adjoint state is a concept originating from optimisation theory. Over the past few years, adjoint-based methods have been used successfully in flow control and stability analysis. In the hydrodynamic instability framework, such methods have been used to identify optimal perturbations, highlight the most receptive path to breakdown, select the most destabilising base flow defect in an otherwise stable configuration, and map the structural sensitivity of a flow oscillator. All of these uses have been recently reviewed by Luchini & Bottaro (Reference Luchini and Bottaro2014). The adjoint state equations read
 $$\begin{eqnarray}\left.\begin{array}{@{}c@{}}\displaystyle \frac{\partial \boldsymbol{u}^{\dagger }}{\partial t}+(\boldsymbol{U}_{b}\boldsymbol{\cdot }\boldsymbol{{\rm\nabla}})\boldsymbol{u}^{\dagger }-\left(\boldsymbol{{\rm\nabla}}\boldsymbol{U}_{b}\right)^{\text{T}}\boldsymbol{u}^{\dagger }=-\boldsymbol{{\rm\nabla}}p^{\dagger }+\frac{1}{\mathit{Re}}{\rm\Delta}\boldsymbol{u}^{\dagger },\\ \boldsymbol{{\rm\nabla}}\boldsymbol{\cdot }\boldsymbol{u}^{\dagger }=0.\end{array}\right\}\end{eqnarray}$$
For a complete derivation of the adjoint linearised Navier–Stokes equations as well as the consequences on the boundary conditions of the problem, the reader is referred to Barkley et al. (Reference Barkley, Blackburn and Sherwin2008). Nonetheless, as for the linearised Navier–Stokes equations, this set of equations can be recast into a linear dynamical system:
 $$\begin{eqnarray}\unicode[STIX]{x1D63D}\frac{\partial \boldsymbol{q}^{\dagger }}{\partial t}=\unicode[STIX]{x1D645}^{\ast }\boldsymbol{q}^{\dagger }\end{eqnarray}$$
where
 $\boldsymbol{q}^{\dagger }=(\boldsymbol{u}^{\dagger },p^{\dagger })^{\text{T}}$
is the adjoint state vector and
 $\unicode[STIX]{x1D645}^{\ast }$
the adjoint Jacobian matrix. The eigenspectrum of this adjoint Jacobian matrix is then computed using the same algorithm as the one introduced in § 2.3.
Figures 28(a) and 28(b) depict the leading adjoint mode for the sinuous instability with
 $({\it\eta},\mathit{Re})=(1,1125)$
and the varicose instability with
 $({\it\eta},\mathit{Re})=(2,900)$
, respectively. Like its direct counterpart, the streamwise and wall-normal components of the sinuous adjoint mode are antisymmetric with respect to the
 $z=0$
plane while its spanwise velocity component is symmetric. Its maximum is located in the vicinity of the separation lines on the vertical walls of the cylindrical roughness element. On the other hand, the leading varicose adjoint mode has its maximum located within the symmetry plane of the domain, in the vicinity of the separation point just downstream of the cylindrical roughness element. Its streamwise and wall-normal components are symmetric with respect to the
 $z=0$
plane while its spanwise velocity component is antisymmetric. Table 5 provides a comparison of the leading eigenvalues of the direct and adjoint linearised Navier–Stokes operator. It can be seen that, for all the different cases, they agree up to the fourth digit.
Visualisation of the streamwise velocity component of the leading adjoint mode for (a) the sinuous instability in the
 $y=0.75$
plane and (b) the varicose instability in the
 $z=0$
plane. The dotted line (red online) depicts the spatial extent of the reversed flow region.

Comparison of the leading eigenvalues of the direct and adjoint linearised Navier–Stokes operators.

Appendix B. Convergence of the eigenvalue computations
In this appendix, we highlight the influence of the domain size and mesh refinement on the computation of the leading eigenvalues and eigenvectors of the linearised Navier–Stokes operator using the Fransson et al. (Reference Fransson, Brandt, Talamelli and Cossu2005) set-up investigated in § 3. Figure 29 depicts the distribution of spectral elements in an arbitrary horizontal plane. In all cases, the wall-normal and spanwise extents of the computational domain have been kept constant (i.e.
 $L_{y}=50$
and
 $L_{z}=10$
), while the location of the outflow plane has been changed from
 $X_{out}=30$
(long-dashed box), to
 $X_{out}=60$
(short-dashed box) and finally to the longest domain considered herein
 $X_{out}=90$
. For all cases, the order of the Legendre polynomials has been kept equal to 8. Figure 30 depicts the eigenspectrum of the linearised Navier–Stokes for each domain. On the one hand, the
 $X_{out}=30$
spectrum only exhibits a branch of eigenvalues. On the other hand, the
 $X_{out}=60$
and
 $X_{out}=90$
also exhibit an isolated eigenvalue lying in the upper-half complex plane. Figure 31 depicts the streamwise velocity component of the leading eigenmode for each domain considered. It is obvious from these figures that a sufficiently long domain is required in order to capture appropriately the whole spatial support of the mode and might explain the difference between the spectrum obtained for
 $X_{out}=30$
with those for
 $X_{out}=60$
and 90. Moreover, considering a short streamwise extent of the computational domain yields an under-prediction of the critical Reynolds number as shown in table 6. Based on these conclusions, all the results presented in this paper have been obtained for
 $X_{out}=90$
.
Evolution of the critical Reynolds number with respect to changes in the location of the outflow plane.

Distribution of the spectral elements in an arbitrary horizontal plane. The long-dashed box depicts the extent of the smallest computational domain considered (
 $X_{out}=30$
), while the short-dashed box depicts that of the intermediate one (
 $X_{out}=60$
).

Comparison of the eigenspectrum for (a)
 $X_{out}=30$
, (b)
 $X_{out}=60$
and 90.

Streamwise velocity component of the leading global mode of the Fransson et al. (Reference Fransson, Brandt, Talamelli and Cossu2005) set-up at
 $\mathit{Re}=575$
for three different streamwise lengths of the computational domain: (a)
 $X_{out}=30$
, (b)
 $X_{out}=60$
, (c)
 $X_{out}=90$
.

Now that it has been shown that the domain needs to be long enough to capture appropriately the global instability under investigation, the influence of the mesh refinement on this instability is highlighted by table 7. All the results within this table have been obtained on the longest domain considered (i.e.
 $X_{out}=90$
). The order of the Legendre polynomials is changed from
 $N=6$
to
 $N=12$
, resulting in an increase of the gridpoints from 1.43 million up to almost 12 million. As one can see, provided
 $N\geqslant 8$
, it is clear from table 7 that the leading eigenvalue appears to be almost independent of the mesh refinement. All the results presented in this paper have been obtained using the finest grid (
 $N=12$
).
Evolution of the growth rate
 ${\it\sigma}$
and circular frequency
 ${\it\omega}$
of the leading eigenvalue with an increase of the mesh refinement.