In the year 2015, Child Protective Services in the United States received child maltreatment referrals involving approximately 7.2 million children (US Department of Health and Human Services, Administration for Children and Families, Administration on Children, Youth and Families, Children's Bureau, 2017). Children with a history of abuse or neglect are often deprived of the intellectual stimulation, guaranteed safety, nutrition, and emotional support necessary for healthy development. Experiences of maltreatment place children at heighted risk of developing diverse forms of psychopathology, as well difficulties in academics, interpersonal relationships, and cognitive functioning (Cicchetti, Reference Cicchetti2016). The specific effects of particular subtypes of maltreatment are largely undetermined and extremely difficult to study as most maltreated children experience multiple subtypes, or maltreatment multiplicity (Cicchetti & Rogosch, Reference Cicchetti and Rogosch2012). Several studies demonstrate that with every additional form of caregiver victimization, maladaptive outcomes across multiple psychological domains increase in severity (Cicchetti & Rogosch, Reference Cicchetti and Rogosch2012; Edwards, Probst, Rodenhizer-Stämpfli, Gidycz, & Tansill, Reference Edwards, Probst, Rodenhizer-Stämpfli, Gidycz and Tansill2014). There is some evidence of subtype specificity such as the association between sexual abuse and substance use in women, as well the role of physical abuse in the development of antisocial behaviors (Jaffee, Caspi, Moffitt, & Taylor, Reference Jaffee, Caspi, Moffitt and Taylor2004; Wilsnack, Vogeltanz, Klassen, & Harris, Reference Wilsnack, Vogeltanz, Klassen and Harris1997). However, in general, research shows that child maltreatment influences psychological functioning in a nonspecific (affecting multiple domains) and equivalent manner (no one type of maltreatment is particularly less damaging; Vachon, Krueger, Rogosch, & Cicchetti, Reference Vachon, Krueger, Rogosch and Cicchetti2015). Therefore, the focus of the current study is on impact of maltreatment multiplicity on children's development.
Resilience and Child Maltreatment
Consistent with the developmental psychopathology framework of multifinality, influences across multiple systems, from genes to society, give rise to divergent trajectories of development for maltreated children (Cicchetti & Rogosch, Reference Cicchetti and Rogosch1996). That is, despite the trauma of abuse and neglect, not all maltreated children follow along paths of maladaptation. Instead, children have a remarkable capacity to demonstrate resilient functioning (Cicchetti, Reference Cicchetti2013). Resilience refers to the complex and dynamic capacity of individuals to recover or withstand adversities that have the potential to significantly undermine development (Masten, Reference Masten2015; Sapienza & Masten, Reference Sapienza and Masten2011). Rather than simply referring to an absence of psychopathology, resilience signifies that children have obtained competence in multiple domains of psychological health, or adaptive functioning, despite experiencing adversity. This categorical notion of manifesting resilience (having both experienced adversity and exhibiting adaptive functioning) leads many researchers to study and characterize resilience using person-centered statistical approaches. Person-centered statistical approaches attempt to characterize similarities and differences among individuals based on the assumption that the population is heterogeneous in terms of the joint distribution of the observable indicator variables (Masyn, Reference Masyn and Little2013). However, modeling the dynamic processes involved in obtaining adaptive functioning in contexts of adversity, such as interactions between risk and protective factors, is generally best achieved using variable-centered approaches. Variable-centered, as opposed to person-centered, approaches tend to analyze the relations among variables. Hybrid models have grown in popularity because of their ability to incorporate both person-centered and variable-centered approaches to understanding resilience (Masten, Reference Masten2015). One type of hybrid model used in this study is referred to as a structural equation mixture model (SEMM). An SEMM involves testing a structural model with one or more categorical latent variables along with one or more continuous factors.
Protective and vulnerability factors
A key step in resilience research is the identification of protective and vulnerability factors that either enhance or decrease, respectively, the likelihood of healthy development for children faced with hardship. Greater attention to these factors in child maltreatment research will likely contribute to more effective means of identifying children at highest risk of maladaptation as well as improve prevention/intervention strategies (Luthar & Cicchetti, Reference Luthar and Cicchetti2000). Examples of factors that have been established as protective for maltreated children include a child's connection to safe neighborhoods and quality education as well as a child's self-regulatory and self-esteem capacities (Cicchetti, Reference Cicchetti2013; Haskett, Nears, Ward, & McPherson, Reference Haskett, Nears, Ward and McPherson2006). Identified vulnerability factors include low self-efficacy and exposure to high-crime neighborhoods (Jaffee, Caspi, Moffitt, Polo-Tomás, & Taylor, Reference Jaffee, Caspi, Moffitt, Polo-Tomás and Taylor2007; Kim & Cicchetti, Reference Kim and Cicchetti2003).
Beyond environmental influences, there has been growing emphasis, in the child maltreatment and resilience literature, on identifying genetic vulnerability and protective factors. By and large, these types of studies test for candidate-variant, Gene × Environment interaction (G × E), whereby associations between environmental exposures and psychological phenotypes depend on genotype (e.g., Caspi et al., Reference Caspi, McClay, Moffitt, Mill, Martin, Craig and Poulton2002). The G × E literature has been highly contentious due to replication failures, reported effect sizes at odds with hypothesis-free/genome-wide studies of behavior, improper statistical techniques, and inconsistent findings with respect to direction of effects (see Border & Keller, Reference Border and Keller2017; Duncan & Keller, Reference Duncan and Keller2011; Keller, Reference Keller2014). Many of the reported candidate genetic moderators of childhood adversity, with roles in multiple biological systems, have been described as conferring individual differences in environmental sensitivity (ES; Pluess, Reference Pluess2015). ES refers broadly to differences in the degree to which individuals perceive, process, and respond to environmental influences. At its core, ES is a concept based on the hypothesis of neurosensitity; namely, more sensitive nervous systems lead to heightened awareness and deeper processing of environmental stimuli (i.e., high ES; Pluess, Reference Pluess2015). Though still in its infancy as a concept, the notion is that high levels of ES may potentiate the harm inflicted in children by maltreatment. Genetic variants relating to less efficient dopamine functioning or dysregulated hypothalamic–pituitary–adrenal axis activity have been hypothesized to increase ES (Bakermans-Kranenburg & van IJzendoorn, Reference Bakermans-Kranenburg and van IJzendoorn2011; Canli & Lesch, Reference Canli and Lesch2007; Hostinar, Cicchetti, & Rogosch, Reference Hostinar, Cicchetti and Rogosch2014). Commonly studied genes in this arena the serotonin transporter (5-HTT) and the dopamine receptor D4 (DRD4), which have been reported as moderators of maltreatment outcomes, albeit with varying success in replication (e.g., Byrd & Manuck, Reference Byrd and Manuck2014; Cutuli, Raby, Cicchetti, Englund, & Egeland, Reference Cutuli, Raby, Cicchetti, Englund and Egeland2013; Risch et al., Reference Risch, Herrell, Lehner, Liang, Eaves, Hoh and Merikangas2009).
Often limited by the scope of a study's initial genotyping efforts, the vast majority of work on the genetics of psychological well-being in children faced with adversity has been focused on the moderating effects of a dozen or so genetic variants. These studies either examine variants individually or summed as a single polygenic risk score/s (PGRS). Often, candidate PGRS involve a count of the number of so-called sensitivity alleles that a given person carries (Beaver, Reference Beaver2008; Cicchetti & Rogosch, Reference Cicchetti and Rogosch2012). In general, these studies have reported that the higher the sensitivity allele count, the more susceptible individuals are to the effects of maltreatment, in line with the ES concept. Cicchetti and Rogosch (Reference Cicchetti and Rogosch2012), for example, found that maltreated children with multiple sensitivity genetic variants scored lowest on a composite index of adaptive functioning as compared to maltreated children carrying less.
At least within the context of candidate G × E research on childhood adversity, most PGRS are unweighted and rely on a priori assumptions regarding which specific alleles of a given genetic variant confer sensitivity and which alleles confer protection. Such approaches are completely reliant on the robustness of previous literature, which has been strongly called into question (see Duncan & Keller, Reference Duncan and Keller2011). Moreover, unweighted PGRS assume that each genetic variant contributes equally to the overall main or interactive effect. When phenotypes and genotypes have been assessed on a large number of people, PGRS have the benefit of being weighted based on genome-wide association studies (Dudbridge, Reference Dudbridge2013). These PGRS can be considered a type of fixed-weight composite (Grace & Bollen, Reference Grace and Bollen2008). However, at least to date, there are no genome-wide G × E studies of child maltreatment to pull data from. Likely, these studies do not exist because the immense sample sizes required are currently prohibitive. If the previous literature's robustness is questionable, candidate G × E PGRS may only be able to be reasonably weighted by a study's own sample, otherwise referred to as unknown weights composites (Grace & Bollen, Reference Grace and Bollen2008).
In addition to considering effect size weighting, the coding of genetic alleles in candidate PGRS, in terms of designating which alleles confer sensitivity versus protection, is important. If researchers hypothesize that ES increases as the number of sensitivity variants carried increases, then it is imperative that there be either strong rational based on previous literature for selecting particular variants or a flexible statistical method that does not require such a priori assumptions. Unfortunately, there exists inconsistent evidence that any particular allele is robustly associated with any broad sensitivity to the environment phenotype. For example, some studies report the long allele, rather than the traditionally assumed short allele, of the usual suspect 5-HTTLPR variant is associated with greater reaction to environmental conditions (e.g., Uher & McGuffin, Reference Uher and McGuffin2010).
In an attempt to overcome both issues of weighting and assumptions regarding allelic sensitivity, the current study utilized an unknown weights composite referred to as a formative factor. This approach has never been used in G × E research to date. Unlike a reflective factor from a confirmatory factor analysis, a formative factor is conceptualized as being formed by its indicators, requiring no correlation between indicators. Formative indicators’ contribution to a formative factor are weighted as a function of what the formative factor is predicting, such that the indicator weights represent the indirect effect of each indicator on an outcome via the factor (Coltman, Devinney, Midgley, & Venaik, Reference Coltman, Devinney, Midgley and Venaik2008). Moreover, formative factors allow for indicator weights to be estimated freely as either positive or negative. This means that the coding designation of sensitivity or protective alleles is not required a priori; only the selection of variants themselves is needed in order to construct a genetic formative factor.
The Current Study
The goal of the current study was to examine if the relation between maltreatment multiplicity and adaptive functioning, in children, depends on variation in candidate variants commonly studied in the ES, G × E literature. As a means of quantifying adaptive functioning in maltreated and nonmaltreated children, a latent class analysis (LCA) was performed on four commonly studied domains of psychological health: prosocial behavior, antisocial behavior, withdrawn behavior, and depression (Cicchetti & Rogosch, Reference Cicchetti and Rogosch2012). LCA accounts for measurement error and classification accuracy, does not treat all indicators the same, and avoids relying on researcher cutoffs (i.e., naïve profiling) making it an ideal person-centered modeling technique (Masyn, Reference Masyn and Little2013). Next, 12 genetic variants were selected for use in a polygenic formative factor, based on a review of G × E findings in the maltreatment literature (see online-only Supplemental Material). Finally, the latent class variable representing adaptive functioning was embedded in a variable-centered, structural model wherein class membership was predicted by maltreatment multiplicity, the polygenic formative factor, and their interaction (G × E). Our study used an all African American sample of children. This was done for three primary reasons. First, research with African American children is severely underrepresented in the current behavioral science literature, especially the genetic literature (Lewis, Reference Lewis2003). Second, genetic analyses have greater statistical power when only one ancestral group is studied at a time because genetic variation covaries with ancestral origin. Third, the vast majority of the original sample of maltreated and nonmaltreated children is African American.
This study has two major aims:
1. Describe heterogeneity in multidomain, adaptive functioning in African American maltreated and nonmaltreated children of low socioeconomic background. That is, in an exploratory manner, elucidate the number and nature of a finite number of “adaptive functioning” groups of children.
2. Predict membership in “adaptive functioning” classes based on maltreatment multiplicity, a polygenic formative factor composed of 12 ES genetic variants, and the interaction between them (G × E).
Method
Participants
Children aged 6 to 13 years (N = 1,004; M age = 10.09, SD = 1.60) were recruited in cohorts across 19 years of data collection to participate in a research-based, summer camp developed for low-income youth. Nonmaltreated comparison children (n = 512) and maltreated children (n = 492) encompassed the complete sample of participants. Among the participants, 495 were girls and 509 were boys. A single nucleotide polymorphism panel of 106 ancestral informative genetic markers was utilized to classify individuals into African, European, and Native American descent (Yaeger et al., Reference Yaeger, Avila-Bront, Abdul, Nolan, Grann, Birchette and Ziv2008). This sample had a mean proportion of African American ancestry of .93, validating genetic homogeneity with self-reported ethnicity.
Recruitment procedures
Maltreated children were identified by the county Department of Human Services (DHS) as having experienced child maltreatment and were representative of youth receiving DHS services. Nonmaltreated children from sociodemographically comparable backgrounds were recruited from families receiving Temporary Assistance for Needy Families. Informed consent was obtained from parents of all participants. Furthermore, consent was given for examination of DHS records pertaining to the recruited families. See the online-only Supplemental Materials for more details on recruitment procedures.
Procedure
Maltreated and nonmaltreated children attended weeklong day camps and participated in research assessments. The camp lasted 7 hr/day for 5 days, providing 35 hr of child–counselor and peer–peer interactions. Trained research assistants, blind to study hypotheses and maltreatment status, conducted individual research assessments with children. Clinical consultation/intervention was provided if any concerns over danger to self or others surfaced during the camp week.
Measures
Measures of adaptive functioning
We utilized multi-informant (peer, camp counselor, and self) measures of prosocial behavior, antisocial behavior, withdrawn behavior, and depressive symptomotology. All four adaptive functioning domains, except depression, included multiple measures. Measures within those three respective domains were averaged together and formed into composite parcels (representing each domain). Specifically, facet-representative parcels were used (Little, Cunningham, Shahar, & Widaman, Reference Little, Cunningham, Shahar and Widaman2002). Three confirmatory factor analyses were conducted using the respective indicators for each of the three parcels. Fit indices from all three confirmatory factor analysis models indicated good fit to the data, providing support for the cohesion of the indicators for use in parcels. The prosocial, antisocial, and withdrawn parcels along with the measure of depression served as the four indicators in the LCA. Because of the nature of the limited response noninterval scale of these four variables, we discretized them into six-category polytomous variables. See online-only Supplemental Material for more details.
Peer measure: Peer behavior ratings
After interacting with their peers during the week of summer camp, children evaluated the characteristics of their camp group peers via a sociometric peer ratings method on the last day of camp (Coie & Dodge, Reference Coie and Dodge1983). For each peer in the camp group, children were given six behavioral descriptors characterizing different types of social behavior. Children were asked to rate each peer on how characteristic the behavioral descriptor was for that peer on a 3-point scale. In the current study, ratings from peers for cooperative behavior, disruptive behavior, shyness, and fighting behavior were used. All ratings from peers on each child for each of the social behavioral descriptors were averaged.
Counselor measures
Pupil evaluation inventory
At the end of each camp week the Pupil Evaluation Inventory (Pekarik, Prinz, Liebert, Weintraub, & Neale, Reference Pekarik, Prinz, Liebert, Weintraub and Neale1976) was completed by camp counselors for children in their respective groups. The Pupil Evaluation Inventory consists of 35 items yielding three homogeneous and stable social behavior factors, including likeability, aggression, and withdrawn behavior. Interrater reliabilities based intraclass correlations across the years of camp ranged from 0.72 to 0.85 (M = 0.78) for likeability, 0.85 to 0.90 (M = 0.88) for aggression, and 0.72 to 0.84 (M = 0.78) for withdrawal.
Counselor behavior ratings
Camp counselors completed 7-point ratings of children's behavior each day during three separate, 45-min, observations during camp (see Cicchetti & Rogosch, Reference Cicchetti and Rogosch2012; Wright, Reference Wright1983). Counselors rated children on 9 items tapping three domains of interpersonal functioning, including aggressive behavior, socially withdrawn behavior, and prosocial behavior. Individual counselor assessments for each of the three scales across the three assessment occasions were averaged to generate individual child scores. Interrater reliabilities based on average intraclass correlations among pairs of raters across the years of assessment ranged from 0.68 to 0.80 (M = 0.76) for prosocial, 0.70 to 0.84 (M = 0.77) for aggression, and 0.61 to 0.77 (M = 0.71) for withdrawn behavior.
Teacher Report Form
Counselor-rated behaviors were evaluated at the end of each week by counselors' completion of the Teacher Report Form (TRF; Achenbach, Reference Achenbach1991). The TRF is a validated, reliable, and widely used assessment of behavioral functioning from the perspective of teachers. This measure was used in the present study because camp counselors are able to observe children in a similar manner as teachers. The TRF contains 118 items rated for frequency and assesses multiple dimensions of child behavioral symptomatology. In the present study, we examined the rule breaking, aggressive problems, and withdrawn subscales.
Self-reported measure: Children's Depression Inventory
The Children's Depression Inventory (Kovacs, Reference Kovacs1992/1982) is a widely used, valid, and reliable, self-report questionnaire to assess depressive behaviors in school-aged children. For each item, children choose from among three option statements, depicting increasing levels of depressive symptoms, in order to characterize their experiences in the past 2 weeks. Internal consistency for the total scale has ranged from 0.71 to 0.89.
Predictors of adaptive functioning latent class variable
Maltreatment classification
The Maltreatment Classification System (MCS; Barnett, Manly, & Cicchetti, Reference Barnett, Manly, Cicchetti, Cicchetti and Toth1993) was used to index maltreatment. The MCS codes all available information from DHS records, making independent determinations of maltreatment experiences rather than relying on case dispositions and official descriptions. For more information on the MCS, see the online-only Supplemental Materials. Maltreatment multiplicity, or the number of maltreatment subtypes experienced, ranging from 0 (nonmaltreated) to 4 (having documented experience of all forms of child maltreatment at least once in their childhood) was used as the primary maltreatment variable.
ES genetic variables
Based on a literature review, 12 genetic variants, thought to confer ES as well as having shown moderation effects on child maltreatment outcomes, were chosen for inclusion in the polygenic formative factor. See the online-only Supplementary Material for the basis of selecting these variants as well as genotyping procedures. While the formative factor approach does not require the coding of variants in any particular order, we nevertheless designated one allele from each variant as the sensitivity allele. By doing so, the direction and magnitude of the factor loadings will shed some light on the accuracy and/or application of prior research to an all African American sample. These genes and alleles include the following (a) the 7-repeat allele of DRD4-VNTR, (b) the C allele of DRD4- rs1800955, (c) the val/G allele of COMT Val158Met (rs4680), (d) the A allele of DRD2-rs1800497, (e) the del allele of DRD2-rs1799732, (f) the 10-repeat allele of DAT1-VNTR, (g) the T allele of DAT1-rs40184, (h) the T allele of DAT1-rs27072, (i) the short allele of 5-HTTLPR, (j) the T allele of CRHR1-rs110402, (k) the G allele of OXTR-rs53576, and (l) the T allele of FKBP5-rs1360780. No variants significantly deviated from Hardy–Weinberg equilibrium, except for the DRD4-VNTR variant, χ2 (44, N = 995) = 255.28, p = .005. A departure from Hardy–Weinberg equilibrium is not unusual for the DRD4-VNTR nor is it likely to impact the results given strict quality control to prevent genotyping error (see DeYoung et al., Reference DeYoung, Cicchetti, Rogosch, Gray, Eastman and Grigorenko2011). This variant was therefore not excluded as an indicator of the polygenic factor (see Sensitivity Analyses where this variant was dropped). It was unclear which genetic model (additive, dominant, or recessive) was most appropriate for each variant based on the extant G × E literature and within the context of an unordered categorical dependent variable. Model comparisons were conducted using each type of coding scheme and ultimately an additive coding model was selected (see online-only Supplementary Material).
Validation of latent class labeling: California Child Q-Set (CCQ)
Validation of the LCA “class labeling” was carried out using a card sorting task called the CCQ (Block, Block, & Keyes, Reference Block, Block and Keyes1988). The CCQ was completed by camp counselors and involves sorting cards, with psychological descriptions written on them, into categories based on how characteristic each card's description is to a given child's observed behavior. The CCQ is widely used for the various psychological scales and criteria developed from it. This measure was not used as a latent class indicator, affording the possibility to independently validate the construct of each class label.
Data analytic approach
LCA
Using Mplus version 7.4 data analysis software (Muthén & Muthén, Reference Muthén and Muthén1998–2012), a LCA was conducted. Class-specific item probabilities and class probabilities are the two primary sets of measurement and structural parameters derived from an LCA, respectively. Item probabilities refer to the probability of endorsing a particular item (or category of an indicator) conditional on class membership. Class probabilities correspond to the distribution of the categorical latent variable, reflecting the proportion of the population predicted to belong in each class (Masyn, Reference Masyn and Little2013).
Model building process
Because there were no a priori assumptions about the number or nature of latent classes in this sample, an exploratory process of determining the best fitting unconditional LCA was undertaken. Following the use of best practices outlined by Masyn (Reference Masyn and Little2013) and Nylund, Asparouhov, and Muthén (Reference Nylund, Asparouhov and Muthén2007), a series of LCA models was fit in an iterative fashion. The LCA procedure involves fitting a series of K-class models beginning with a one-class model and stopping at a K-class model that becomes not well identified (K max). Models were deemed not well identified if one or more of the following criteria were met: lack of best log likelihood value replication across a set of random start values, lack of model convergence, or an extraction of a class with a small estimated class size, which may indicate overextraction.
Model estimation
To estimate latent class analysis parameters, Mplus uses the expectation-maximization algorithm for full information maximum-likelihood estimation from incomplete data assuming data is missing at random. Random start values were utilized in an attempt to replicate a global maximum of the likelihood function rather than a local solution.
Evaluating model fit
A combination of statistical indicators and substantive interpretation were used to determine the best number of latent classes based on use of best practices by Masyn (Reference Masyn and Little2013). The goal is to extract a well-fitting, parsimonious, yet meaningful measurement model. These indices include the likelihood ratio test (LRT) statistic for nested models, the adjusted Lo–Mendell–Rubin likelihood ratio test (adjusted LMR-LRT), the parametric bootstrapped LRT, the Akaike information criterion (AIC), the Bayesian information criterion (BIC), the consistent Akaike information criterion (CAIC), the approximate weight of evidence (AWE), the approximate Bayes Factor (BF), and the correct model probability (cmP). Classification accuracy and class homogeneity were evaluated using relative entropy (E K), average posterior class probability (AvePP), and the odds of correct classification ratio for a given class (OCC k). The K-class model deemed to have the best combination of absolute fit, relative fit, classification accuracy, and model usefulness was chosen as the final model to be included in the structural component of the SEMM.
SEMM
The final unconditional LCA model chosen above was be embedded into a larger SEMM. To do so, an alternative three-step method was utilized (Asparouhov & Muthén, Reference Asparouhov and Muthén2014). The first step involves selecting the best fitting unconditional LCA model. In Step 2, the modal class assignments and classification error rates are saved. Finally, in Step 3, the structural model (with predictors added) is run with a nominal modal class assignment variable used as a single indicator of a latent class variable with the measurement error rates prefixed. A latent class variable is an unordered categorical variable; therefore, the relation between class membership and predictors is parameterized as a multinomial logistic regression.
To test for main effects of maltreatment, predictors included maltreatment multiplicity along with sex and age as control variables. To test for G × E, predictors included maltreatment multiplicity as well as the polygenic formative factor, and a Polygenic Formative Factor × Maltreatment interaction term. The control predictors of age, sex, and any interaction terms with covariates that associated with either maltreatment multiplicity or the polygenic formative factor were also added to complete the final structural model (Keller, Reference Keller2014).
Results
Selecting an optimal latent class solution
The latent class enumeration results are provided in Table 1. A solution of seven classes was not well identified, and thus consideration was only given for the 1- through 6-class solutions. The LMR-LRT indicated no significant improvement in model fit beyond a 3-class solution. The Bayesian LRT was significant for all model comparisons, providing no helpful information for the selection of an optimal class, and was therefore not included in Table 1. The lowest BIC and CAIC values were for the 3-class solution. The most parsimonious K-class model with a high BF ratio, along with the K-class solution with a cmP near 1 was also the 3-class solution. The lowest AWE was for the 2-class solution. The smallest K-class solution with a log-likelihood (LL) value lower than that of a 1-class model with all indicators allowed to freely covary with all other indicators within its class was the 4-class solution. That is, the 4-class solution was the most parsimonious solution to fit the data better (i.e., lower LL value) than a fully saturated mean and variance/covariance model that is an exact fit to the data (in terms of the first and second order moments of the data). Finally, examination of an AIC “elbow” plot indicated a bend at the 4-class solution.
Fit indices for LCA of adaptive functioning

Note: LL, model log likelihood value. npar, number of free parameters. LL χ2test, log likelihood ratio model chi-square goodness-of-fit test. BIC, Bayesian information criterion. CAIC, consistent Akaike information criterion. AWE, approximate weight of evidence criterion. Adj. LMR-LRT, adjusted Lo–Mendell–Rubin likelihood ratio test. p, p value corresponding to the adjusted LMR-LRT χ2 statistic (df = 6) comparing H 0: K classes vs. H 1: K + 1 classes. Bootstrapped p, bootstrapped LRT p value. BF (K, K+1), Bayes factor ratio of Models K, K+1. cmP(K), correct model probability. Bolded values correspond to “best” model according to the fit index—columns with no bolded values indicate that the best value for that index was not reached prior to the maximum class extraction supported by the data.
Because of the ambiguity provided by the results of the fit indices, the 3- through 5-class solutions were further evaluated in terms of classification precession, class separation, and class homogeneity. In all three k-class solutions, the primary driver of class separation appeared to be variation in prosocial and antisocial behavior. No one k-class solution seemed to stand out as having the best class separation. In all three k-class solutions, the prosocial and antisocial behavior indicators had the best homogeneity. Again, no one k-class solution seemed to have the best looking class homogeneity with respect to individual indicators. The 3-class solution masked too much population heterogeneity and the 5-class solution overextracted classes, arbitrarily dividing a homogenous subgroup. Ultimately, we choose the 4-class solution as the final unconditional model given its good absolute fit, relative fit, classification precision, and substantive meaningfulness. As seen in Table 2, the 4-class solution had good classification accuracy as indexed by high AvePP, OCC k, and entropy values. The 3- and 5-class solutions had comparable degrees of classification accuracy.
Model classification diagnostics for the four-class solutions

Note: aBias-corrected bootstrapped 95% confidence intervals.
Well-adjusted class
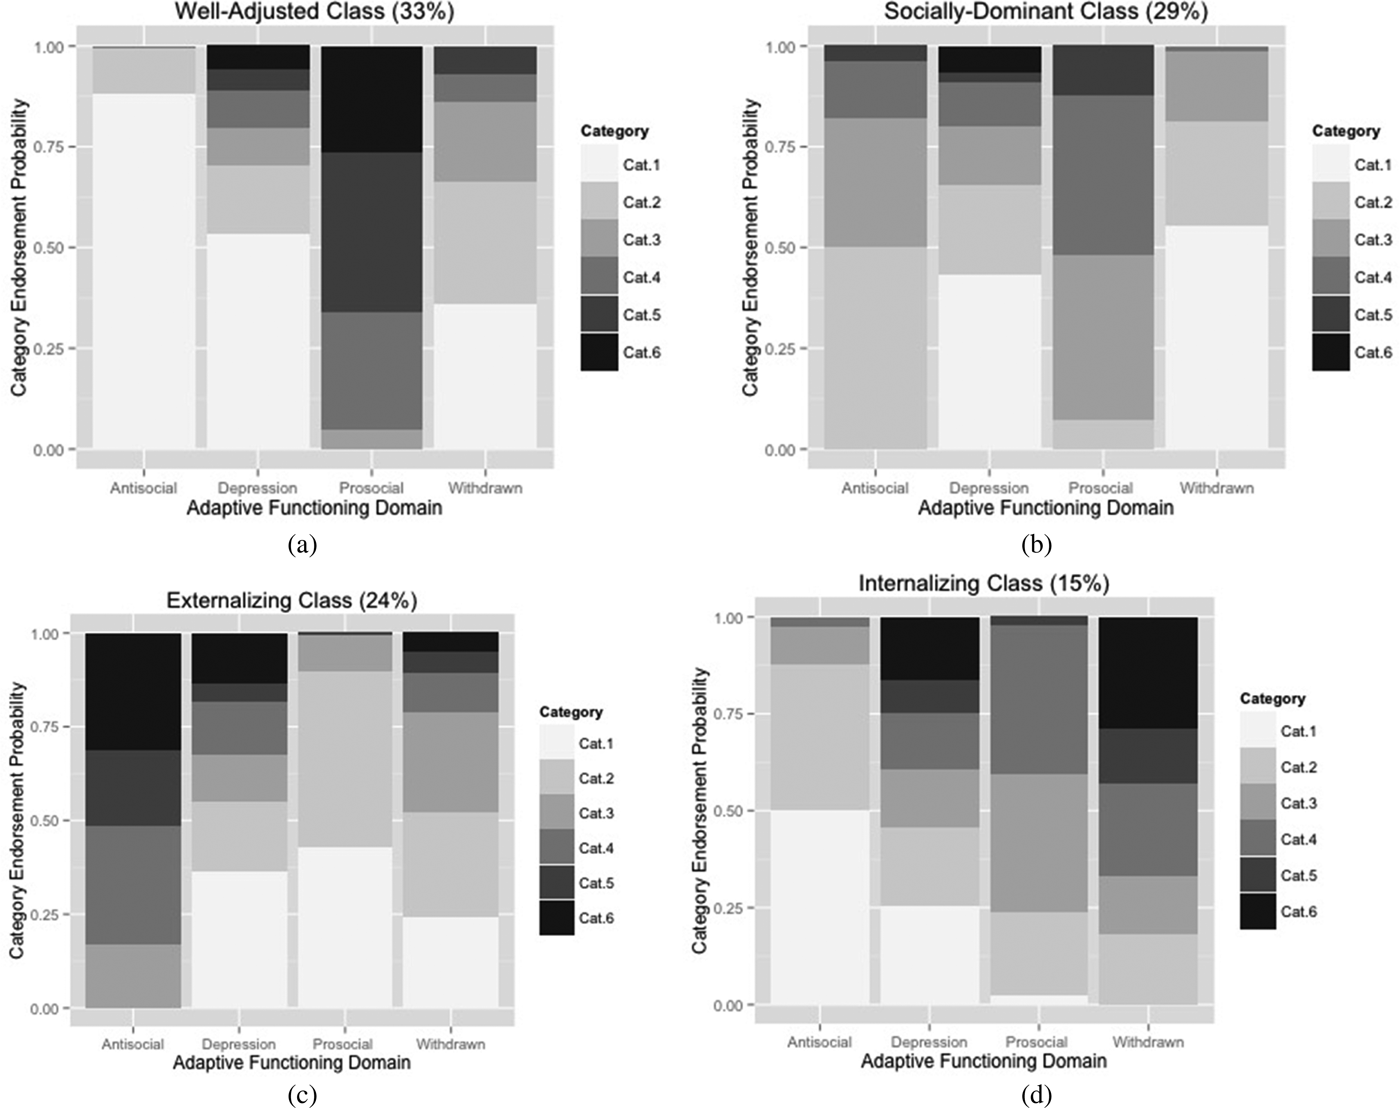
The largest model-estimated class (32.5%) from the 4-class solution was given the label of “well-adjusted” and can be visualized in Figure 1a. This class is characterized by high probabilities of exhibiting high levels of prosocial behavior (i.e., 66% chance of endorsing levels of prosocial behavior 0.5 SD above the mean or greater, or 95% chance of exhibiting levels of prosocial behavior greater than the sample mean). The well-adjusted class is also characterized by a high probability of low antisocial behavior. Finally, children in this class have high probabilities of endorsing low levels of depression and low levels of withdrawn behavior. This class was given the label of “well-adjusted” because the profile of competence characterized by this class is similar to profiles considered developmentally adaptive and predictive of positive life success (Masten et al., Reference Masten, Hubbard, Gest, Tellegen, Garmezy and Ramirez1999). Because all children in the sample were from high-risk contexts (i.e., either poverty or poverty with maltreatment), children in this class may be considered to be demonstrating resilient functioning.
Profiles of adaptive functioning: (a) the well-adjusted class, (b) the socially dominant class, (c) the externalizing class, and (d) the internalizing class. The z score range cutoffs for each category of the antisocial, withdrawn, and depression variables is Cat1 = <–0.5 SD; Cat2 = >0.5 to 0 i; Cat3 = >0 to 0.5 SD; Cat4 = >0.5 to 1 SD; Cat5 = >1 to 1.5 SD; Cat6 = >1.5 SD. The z score range cutoffs for each category of prosocial variable is Cat1 = < –1 SD; Cat2 = >–1 to –0.5 SD; Cat3 = >–0.5 to 0 SD; Cat4 = >0 to 0.5 SD; Cat5= >0.5 to 1 SD; Cat6 = >1 SD.

Socially dominant class
The next largest model-estimated class (28.8%) was labeled “socially dominant” and can be visualized in Figure 1b. This class had the lowest levels of withdrawn behavior compared to all other classes. This class is characterized by medium levels of prosocial behavior and medium to medium-high levels of antisocial behavior. Finally, this class had a high probability of exhibiting low levels of depression. This class was labeled “socially dominant” because the profile it characterizes matches the literature-defined expression of social dominance, including high social presence (low withdrawn behavior) as well as use of both cooperation (prosocial behavior) and aggression (antisocial behavior; Hawley, Reference Hawley1999; Teisl, Rogosch, Oshri, & Cicchetti, Reference Teisl, Rogosch, Oshri and Cicchetti2012). Social dominance refers to a pattern of resource acquisition and social control whereby both cooperation and coercion are used. Socially dominant children are often admired and socially influential though not necessarily without the use of antisocial behaviors such as bullying to gain such social centrality (Hawley, Reference Hawley1999).
Externalizing class
The third largest class that emerged from the 4-class LCA was termed the “externalizing class” and is plotted in Figure 1c. This class's most prominent feature was the high probability of exhibiting extremely low levels of prosocial behavior and the high probability of high levels of antisocial behavior. Moreover, this class was characterized by relatively low withdrawn behavior. The somewhat mixed endorsement probabilities for depression, in this class, is perhaps to be expected because some children exhibit impulsivity and even agitation as the result of depressive feelings (Ryan et al., Reference Ryan, Puig-Antich, Ambrosini, Rabinovich, Robinson, Nelson and Twomey1987). The relatively low levels of withdrawn behavior in this class is consistent with the notion that children characterized by externalizing behaviors are not generally inhibited or reserved, socially. However, this class still has an estimated 21% of children exhibiting withdrawn behavior greater than 0.5 SD above the sample mean. This is also not necessarily an unexpected finding nor does it negate the rationale for labeling this class as externalizing. A subset of children are both aggressive and withdrawn; in these cases, antisocial behavior is thought to contribute to social rejection and victimization, which may in turn contribute to lonely and reserved behaviors (Ladd & Burgess, Reference Ladd and Burgess1999). In summary, based on the profile of category endorsement probabilities and consistency with definitions in the literature, this class is considered to represent children who exhibit primarily externalizing symptoms.
Internalizing class
The smallest estimated class (15.5%) is considered the “internalizing class” and is plotted in Figure 1d. This class is characterized by low levels of antisocial behaviors and medium levels of prosocial behavior. This class had relatively high levels of withdrawn behavior. Finally, category endorsement probabilities for depression were mixed. This class had the highest probability (16%) of endorsing the highest category of depressed behavior out of all the classes. Moreover, individuals in this class are estimated to be more likely to have depression scores above the mean than below the mean. Nevertheless, 25% of individuals in this class are expected to have depression scores below 0.5 SD below the mean. These mixed endorsement probabilities for difference levels of depression suggest poor item homogeneity. Though, because of low base rates, uncovering a class of children homogeneous for very high levels of depression is unlikely, even in a class characterized by high withdrawn and low antisocial behavior.
Construct validity of latent class labels
The ego-resiliency and social competence q-sorts of the CCQ were used to validate the well-adjusted class. To validate the externalizing, internalizing, and socially dominant classes, the internalizing q-sort, externalizing q-sort, and social dominance q-scale, respectively, were utilized (Block et al., Reference Block, Block and Keyes1988; Teisl et al., Reference Teisl, Rogosch, Oshri and Cicchetti2012). Each CCQ measure associated positively (p < .001) with membership in the respective class being validated when compared to membership in each other class. These results suggest good construct validity and provide a degree of assurance in the labels used for each class.
SEMM results
Global maltreatment multiplicity results
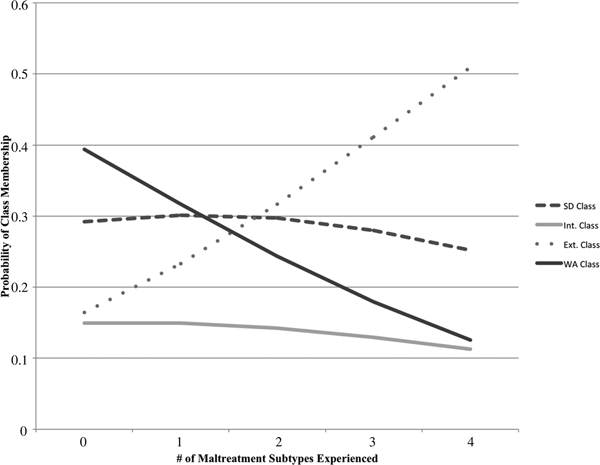
Because the latent class variable has three unordered categories, regression results are based on a multinomial logistic regression, in which simultaneous pairs of logistic regressions are tested (for a given predictor, the effect on the odds of being in one class versus a reference class). To test for global effects, Wald statistics were estimated. Maltreatment multiplicity was significantly associated with latent class membership (Wald = 35.3, df = 3, p < .0001). To visualize this global effect, an overall probability plot is depicted in Figure 2. As the number of maltreatment subtypes increases, the probability of being in the externalizing class increases and the probability of being in the well-adjusted class decreases. There are slight declines in the probability of being in both the socially dominant and internalizing classes as maltreatment increases.
Main effects of child maltreatment probability curve plot. SD, socially dominant. Int., internalizing. Ext., externalizing; WA, well-adjusted. Controlling for sex and age.

Multinomial logistic regression results
To further interrogate the global maltreatment multiplicity effects on class membership, we examined all pairwise logistic regressions. When compared to the well-adjusted class, maltreatment multiplicity is associated with membership in the externalizing (odds ratio [OR] = 1.8, p < .001) and socially dominant classes (OR = 1.28, p = .019) but not the internalizing class (OR = 1.24, p = .14). When compared to the socially dominant class, maltreatment multiplicity is associated with membership in the externalizing (OR = 1.38, p = .002) but not the internalizing class (OR = 0.97, p = .81). Finally, maltreatment multiplicity was associated with membership in the externalizing class when compared to the internalizing class (OR = 1.42, p = .007).
Selecting a formative factor model
The “additive” model was ultimately selected for use in the final SEMM (see online-only Supplementary Materials for more details). Initially, each genetic variant was scored in terms of the number of putative sensitivity alleles. However, not all of the genetic variable indicator weights loaded onto the factor model in the same direction. That is, not all alleles contributed to the overall G × E effect in the same manner. Some variants, assumed to have a vulnerability-like effect exhibited a protective effect and vice versa (see Supplemental Table S.2). To simplify the interpretation of the formative factor, variants were reverse-coded in the final SEMM so that all variants contributed positively to the factor. This did not change the size of the Wald statistic for the global G × E effect.
Final SEMM with control variables
After testing all covariate interaction effects, there were only significant associations between the polygenic factor and age (β= 0.182, p < .001) and sex and maltreatment (OR = 0.93, p = .035). The association between polygenic factor and age is unusual, and may be spurious. Nevertheless, this association may still bias the G × E effects. Because of these associations, it was necessary to add Sex × Factor and Age × Maltreatment interaction terms as control variables, in addition to sex and age as main effects (Keller, Reference Keller2014). The final model regressed the latent class variable onto maltreatment multiplicity, the polygenic factor, the interaction between maltreatment and the polygenic factor (G × E), age, the interaction between age and maltreatment, sex, and the interaction between sex and the polygenic factor.
Global G × E results
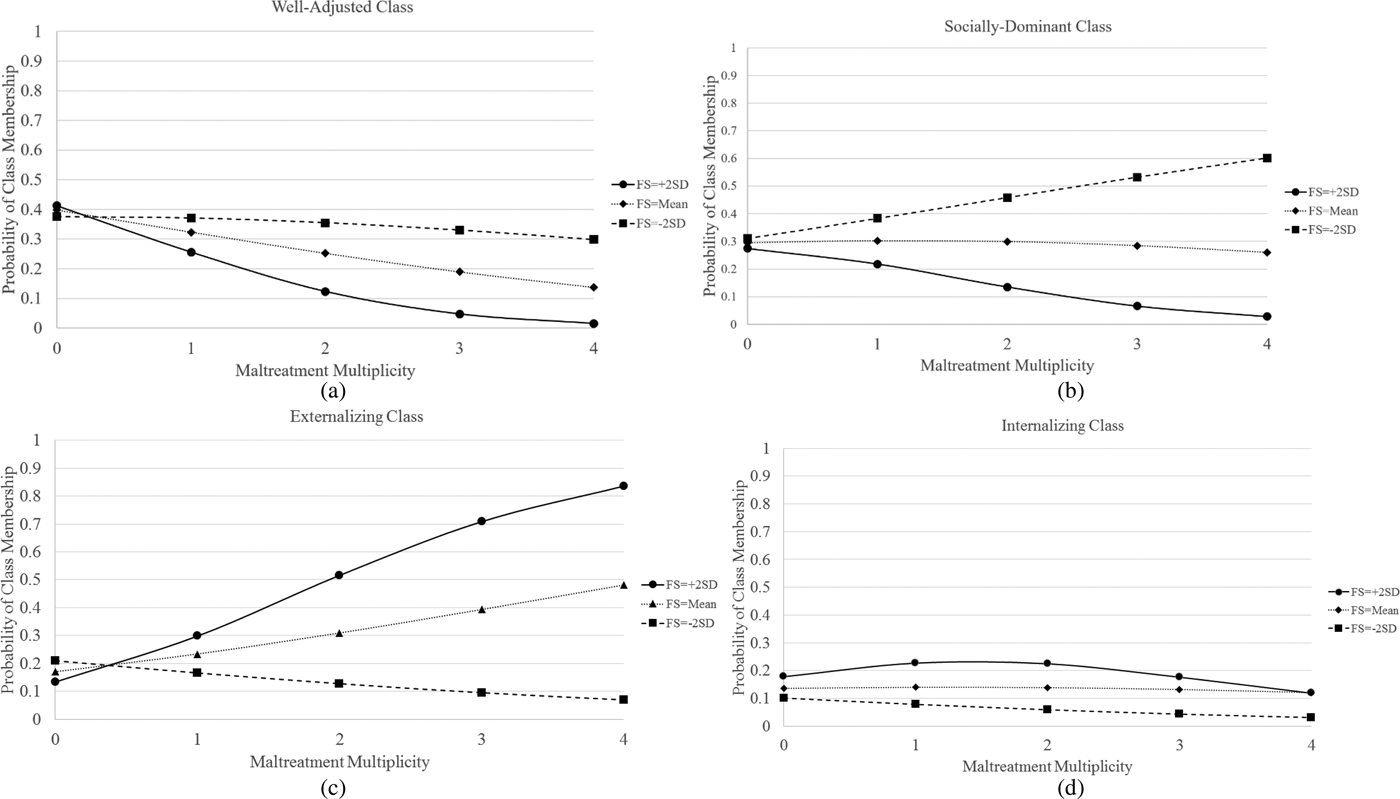
A Wald test for a global G × E effect was significant controlling for all other variables (Wald = 13.5, df = 3, p = .004). That is, the effect of maltreatment on class membership depends on the level of genetic variation. There was no significant association between the polygenic factor and maltreatment, ruling out gene–environment correlation (rGE). The results of the polygenic factor indicator weights are presented in Supplemental Table S.2. All but one genetic variant (DAT1-VNTR) loaded significantly to the formative factor. Five genetic variants loaded negatively onto the factor, meaning for these variants, the alleles assumed to confer “sensitivity” contributed protection. These variants included (a) the 7-repeat allele of DRD4, (b) The del allele of DRD2-rs1799732, (c) the short allele of 5-HTTLPR, (d) the T allele of CRHR1- rs110402, and (e) the T allele of FKBP5-rs1360780. With genetic variants loading in both positive and negative directions, factor scores can be difficult to interpret, and therefore we reverse-coded those variants. As can be seen from the well-adjusted G × E plot, higher factor scores decrease the probability of class membership as maltreatment multiplicity increases. Based on these vulnerability relations, we considered higher factors scores as potentially representing higher levels of ES genetic load, bearing in mind that the reverse-coded five variants contributed to this vulnerability effect in an unexpected manner.
Multinomial logistic regression results
To further interrogate the global G × E effect, the results of the six pairwise logistic regressions are presented in Supplemental Table S.3. Only two significant pairwise G × E effects emerged, controlling for all other variables. One G × E effect corresponds to the comparison between the well-adjusted class and the externalizing class. Specifically, the effect of an increasing maltreatment multiplicity on the odds of being in the externalizing class versus the well-adjusted class increases as ES genetic load increases (Δ log odds = 0.17, p = .001). The other G × E effect corresponds to the comparison between the externalizing and socially dominant classes. Specifically, the effect of an increasing maltreatment multiplicity on the odds of being in the externalizing class versus the socially dominant class increases as ES genetic load increases class (Δ log odds = 0.18, p = .001). Only one pairwise comparison had a significant maltreatment main effect that was not in the context of a G × E. Maltreated children were slightly more likely to be in the socially dominant class versus the well-adjusted class (OR = 1.3, p = .04).
Sensitivity analyses
A variety of sensitivity analyses were conducted to insure the robustness of this model. See the online-only Supplementary Materials for more details. In summary, our sensitivity analyses tested and confirmed four assumptions: (a) maltreatment multiplicity could be treated as a continuous variable, (b) there was no differential item functioning with respect to maltreatment status, (c) the formative factor results were not dependent on which genetic variant was used as the anchor, and (d) maltreatment multiplicity was not associated with study cohort, and finally that an unweighted polygenic index also demonstrated G × E effects.
Discussion
Study overview
This study had two primary aims. The first was to characterize adaptive functioning in maltreated and nonmaltreated, African American children. The second aim was to predict variation in adaptive functioning based on maltreatment multiplicity, ES genetic variation, and their interaction (G × E). Child maltreatment was highly associated with adaptive functioning, in particular increasing the odds of membership in maladapted classes such as the externalizing group. Moreover, an interaction between child maltreatment and a polygenic formative factor composed of putative sensitivity variants significantly predicted latent class membership. This study was the first of its kind to combine latent class analysis with the use of a formative factor to test for G × E.
Comment on the LCA
A 4-class solution was chosen as the best overall unconditional latent class model. The four classes were labeled as “well-adjusted”, “externalizing,” “internalizing,” and “socially dominant.” Approximately 31% of maltreated children were modally assigned to the well-adjusted class (33% of nonmaltreated children were assigned to well-adjusted class) and would therefore be considered resilient. These proportions closely resemble those from similar resilience studies on child maltreatment (e.g., Cicchetti & Rogosch, Reference Cicchetti and Rogosch2012). In general, profiles of externalizing and internalizing behaviors are considered maladaptive for children's development. For example, children with high levels of these broadband behaviors tend to have more difficulty maintaining friendships, are at heighted risk for abusing substances in adolescence and adulthood, tend to display difficulties in school performance, and tend to be victimized more by their peers (e.g., Colder et al., Reference Colder, Scalco, Trucco, Read, Lengua, Wieczorek and Hawk2013; Masten et al., Reference Masten, Roisman, Long, Burt, Obradović, Riley and Tellegen2005). In order to climb the social ladder, enhance likability, and control resources, some children engage in highly competitive dominance strategies marked by both cooperative and coercive behaviors. Such profiles of social dominance, as seen in this study, can increase the odds of obtaining social influence and resource control especially in the early years of life (Hawley, Reference Hawley1999; Teisl et al., Reference Teisl, Rogosch, Oshri and Cicchetti2012). As children age, however, patterns of behavior that are predominately prosocial in nature (such as the well-adjusted class in this study) are more consistently linked with positive peer preferences. Competitive social behaviors in middle childhood, even those that include the use of cooperative strategies, that are marked by hostility and aggression (such as the socially dominant class in this study) can lead to peer rejection and victimization (Coie & Dodge, Reference Coie and Dodge1983; Teisl et al., Reference Teisl, Rogosch, Oshri and Cicchetti2012).
Comparing the results of this measurement model with other studies is difficult. For one reason, a LCA with similar indicators of adaptive functioning has not been used with maltreatment data to our knowledge. Moreover, the majority of mixture modeling techniques used in resilience research employ growth mixture modeling as opposed to cross-sectional LCA (Bonanno et al., Reference Bonanno, Mancini, Horton, Powell, LeardMann, Boyko and Smith2012). Yates and Grey (Reference Yates and Grey2012) conducted an LCA on a similar sample of high-risk children (former foster care youth) using indicators of adaptive functioning. A four-class solution was extracted with subgroups labeled as resilient, maladapted, internally resilient, and externally resilient. While some competence indicators used by Yates and Grey were similar to those used in the present study (relational competence and depression), other indicators were not (educational competence, occupational competence, civic engagement, and self-esteem), making a direct comparison of models problematic. Nevertheless, the profiles of behavior observed in this study are commonly reported in both typical and high-risk child populations (e.g., Bornstein, Hahn, & Haynes, Reference Bornstein, Hahn and Haynes2010; Mendez, Fantuzzo, & Cicchetti, Reference Mendez, Fantuzzo and Cicchetti2002).
Maltreatment multiplicity and G × E predictors of latent class membership
Beyond simply describing heterogeneity in adaptive functioning, via an LCA, this study aimed to understand how maltreatment experiences and ES genetic variation relate to adaptive functioning. The association between maltreatment multiplicity and adaptive functioning class membership was first tested outside the context of a G × E. In terms of overall probabilities, as maltreatment multiplicity increased, children became more likely to exhibit profiles consistent with externalizing behaviors and less likely to exhibit profiles of well adjustment. The association between abusive histories and behaviors such as aggression, impulsivity, and delinquency are some of the most robust findings in all of psychology (Jaffee et al., Reference Jaffee, Caspi, Moffitt and Taylor2004). The chaotic, hostile, and dysfunctional parent–child relationships evident in cases of maltreatment can disrupt the healthy development of children's ability to adaptively regulate emotions and actions. These regulatory deficits compounded by problems in social information processing, known to result from maltreatment, greatly increase children's antisocial tendencies (Cicchetti, Rogosch, & Thibodeau, Reference Cicchetti, Rogosch and Thibodeau2012; Thibodeau et al., Reference Thibodeau, Cicchetti and Rogosch2015). Such antisocial behaviors, as characterized in the externalizing class in this study, are associated with negative outcomes, including risk for substance use and academic problems (Cicchetti et al., Reference Cicchetti, Rogosch and Thibodeau2012).
While maltreated children had a significantly higher likelihood of being in the socially dominant class than the well-adjusted class, this effect was small and reflected the rather slight increase in the overall probability of socially dominant class membership as a function of maltreatment multiplicity. These results are largely in line with the findings from Teisl et al. (Reference Teisl, Rogosch, Oshri and Cicchetti2012). That research group also preformed mixture modeling, identifying three group of children characterized by nondominant behaviors, primarily coercive dominant behaviors, and primarily competent/cooperative dominant strategies. Maltreated children, regardless of the type of maltreatment, were more likely to be in the primarily coercive dominant and nondominant classes as compared to the competent class (OR = 3.07 and OR = 2.23, respectively). It is unclear why Teisl et al. (Reference Teisl, Rogosch, Oshri and Cicchetti2012) found larger effects relating to the effects of abuse on maladaptive social dominance behaviors. One explanation was that we only identified one bistrategic socially dominant class rather than subclasses characterized by primarily coercive or competent dominating strategies. Had we identified these subclasses, the maltreatment associations may have been stronger. That is, the small maltreatment associations with social dominance in our study may be muddied by the presence of distinct dominance groups within the bistrategic class. Moreover, it is possible that the inclusion of measures of internalizing behaviors may have created difficulty in extracting more fine-grained profiles of social dominance. In any case, in our sample, maltreated children were more likely to be characterized by dominating behaviors. Social learning perspectives have suggested that exposure to adult models of instrumental aggression and dominance common to abusive parenting may lead children to overemphasize the need to use socially dominant behaviors (Teisl et al., Reference Teisl, Rogosch, Oshri and Cicchetti2012).
The lack of findings suggesting increased odds of being in the internalizing class as a function of maltreatment multiplicity is inconsistent with a large body of literature suggesting otherwise (i.e., Cicchetti, Rogosch, & Oshri, Reference Cicchetti, Rogosch and Oshri2011; Teisl et al., Reference Teisl, Rogosch, Oshri and Cicchetti2012). While maltreatment multiplicity was associated directly with the individual, ordinal measure of depression (ordinal OR = 1.17, p = .006), there was no association with the individual measure of withdrawn behavior. These somewhat discrepant findings could explain the overall lack of association with class membership. Moreover, the estimated class size was relatively small for the internalizing class (15.5%). Therefore, low power in this study could have contributed to Type II error. Finally, some children with otherwise internalizing struggles may exhibit irritability and even aggression, making a distinction between purely internalizing versus externalizing behaviors somewhat difficult to make (Ryan et al., Reference Ryan, Puig-Antich, Ambrosini, Rabinovich, Robinson, Nelson and Twomey1987). There was some nonnegligible probability of exhibiting moderate levels of withdrawn and depression behavior in the externalizing class.
A formative factor composed of 12 genetic variants, shown to exhibit G × E effects in previous studies, was constructed and included as a moderator of the association between maltreatment multiplicity and adaptive functioning class membership. There was an overall significant G × E effect, such that as genetic load increased, maltreated children became increasingly more likely to be members in the externalizing class and less likely to be in the well-adjusted or socially dominant classes. An advantage of using a formative factor to construct polygenic indices is that the contribution of each variant to the factor can load either in a negative or a positive direction. Five of these variants loaded onto the formative factor negatively, thereby exhibiting protective rather than the expected sensitivity effects. These findings highlight the complexity of G × E interplay as well as further add to the mixed-findings commonly reported in the candidate G × E research community. It is not uncommon for studies to report discrepant findings for these particular genetic variants. A number of reports, for example, have found the short allele as opposed to the long allele of 5-HTTLPR confers protective effects in contexts of abuse (e.g., Cicchetti et al., Reference Cicchetti, Rogosch and Oshri2011; Sharpley, Palanisamy, Dillingham, & Agnew, Reference Sharpley, Palanisamy, Glyde, Dillingham and Agnew2014). Contradictory vulnerability/protection effects with regards to FKBP5-rs1360780 and CRHR1-rs110402 have also been reported (Roy, Gorodetsky, Yuan, Goldman, & Enoch, Reference Roy, Gorodetsky, Yuan, Goldman and Enoch2010; Sumner, McLaughlin, Walsh, Sheridan, & Koenen, Reference Sumner, McLaughlin, Walsh, Sheridan and Koenen2014). These results add to a growing number of studies demonstrating polygenic moderation of child maltreatment outcomes, and the relative, but modest role that some candidate genes have in predicting risk and resilience (i.e., Thibodeau et al., Reference Thibodeau, Cicchetti and Rogosch2015).
This study built upon earlier work by Cicchetti and Rogosch (Reference Cicchetti and Rogosch2012) sharing some similarities and differences. In general, Cicchetti and Rogosch's findings indicated that ES gene variation was differentiating, in terms of adaptive functioning, for both nonmaltreated children and maltreated children more in line with differential susceptibility theory (Belsky & Pluess, Reference Belsky and Pluess2009). However, by “eye-balling” the plots in Figure 3, our results appear to display interactions more consistent with diathesis stress (Monroe & Simons, Reference Monroe and Simons1991). There are statistical tools to decipher the Person × Environment interaction effects of vantage sensitivity, differential susceptibility theory, and diathesis stress (i.e., Roisman et al., Reference Roisman, Newman, Fraley, Haltigan, Groh and Haydon2012). These tools are most effective when a study's environmental range stretches from positive to negative. The current study has a restricted environmental range with only children from low-income backgrounds sampled. Thus, these tools were not employed. Moreover, there is no clear way of identifying interaction patterns such as those listed when the outcome variable is unordered and categorical. One potential reason for why our results are slightly different than Cicchetti and Rogosch (Reference Cicchetti and Rogosch2012) is that they used a continuous variable of adaptive functioning and did not employ a weighted composite for their polygenic index.
G × E probability curve plots for (a) the well-adjusted class, (b) the socially dominant class, (c) the externalizing class, and (d) the internalizing class.

In summary, we replicate and extend very well known findings in the child maltreatment literature, namely, that child maltreatment is strongly associated with negative outcomes and that common genetic variation does not play a major role in differentiating children in terms of adaptive functioning. We demonstrate that candidate G × E polygenic risk scores can be sample weighted and that a priori assumptions about allelic risk/protection is not required. While we report significant G × E findings, they should be treated with great caution, and replication attempts should be made. The effects were small, and roughly half of the genetic variants had the opposite G × E trend as commonly reported in previous work in the field of childhood adversity.
With any study of parent behavior–child behavior associations, the directionality of causation can be difficult to infer. Because this study did not employ a twin or adoption design, nor utilize longitudinal data, definitive conclusions regarding the causality of the impacts of parental abuse/neglect cannot be made. Although statistical G × E interactions were detected, these interactions say little about how the interactions operate biologically at a mechanistic level. Furthermore, not all unobserved contextual factors common to both caregiver and child were controlled for, which can increase Type 1 errors, though in practice adding all such factors in a model is extremely difficult. Finally, not all commonly utilized indicators of adaptive functioning were measured, such as academic success (Masten, Reference Masten2015). This study had a number of notable strengths. First, maltreatment was measured objectively and prospectively. Second, this study examined adaptive functioning in four major domains of competence based on measures collected by multiple informants (peers, counselors, and self) via an LCA. Third, rather than focusing on a single candidate gene variant, 12 variants were examined across 8 genes collectively via formative factor. The formative factor not only provides a weighted composite but also allows variants to load either negatively or positively. Because of this, interaction effects were not dependent on the a priori assumptions made about plasticity effects. To the best of our knowledge, this is the first time a formative factor has been used to weight genetic effects; it is also the first time a formative factor has been used in an interaction and the first time that a formative factor has predicted a latent class variable. Finally, G × E research is fraught with underpowered studies. This study used a relatively large, ancestrally homogeneous sample. In accordance with recommendations made by Keller (Reference Keller2014), covariate interaction terms were added, ensuring proper use of control variables.
Concluding remarks
Given the amount of novel statistical techniques used in this study, caution is warranted regarding the G × E effects. G × E studies are notorious for nonreplication (Duncan & Keller, Reference Duncan and Keller2011). Despite proper use of control variables and large sample sizes, definitive conclusions regarding the impact of these 12 ES gene variants on maltreatment multifinality awaits repeated replication. Researchers are encouraged to test the utility of formative factors when conducting G × E research and/or mixture modeling research. In no way do these results suggest that any child is “immune” to the detrimental effects of maltreatment. Child abuse affects all children regardless of genotype; every effort should be made to prevent maltreatment from occurring. If anything, these results suggest that common variation in just a few genes has a small (yet statistically significant) impact on explaining different behaviors observed in maltreated children of African American ancestry. At any point in a child's life, environmental protective factors such as supportive caregivers, strong peer groups, or an influential teacher can dramatically promote resilient functioning. Child maltreatment is one of the most detrimental environmental exposures that any individual can experience; continued efforts to study psychological health outcomes of maltreated children will likely help develop more effective prevention and treatment tools.