


Introduction
Special Sensor Microwave/Imager (SSM/I) passive-microwave data in the 37 GHz (0.81cm) vertically and horizontally polarized channel are useful for surface snow observations in the remote, cloudy and dark conditions found in high-latitude, glacierized regions. Passive-microwave data have low spatial resolution, but because of the twice-daily coverage at high latitudes, they are useful for regional views of a rapidly changing surface material such as snow. Snow-melt algorithms are based on the fact that at >10GHz frequency there is a large difference in brightness temperature (Tb) for dry vs wet snow (Reference Stiles and UlabyStiles and Ulaby, 1980; Reference Ulaby, Moore and FungUlaby and others, 1986). By the Raleigh–Jeans approximation, Tb is the product of the material’s surface physical temperature (Ts) and emissivity (E): Tb = ETs. The presence of about 1% liquid water in the snowpack causes an abrupt increase in the emissivity, causing the wet snow to emit almost as a black body (Reference Ulaby, Moore and FungUlaby and others, 1986).
Algorithms have been developed for determining the timing and extent of snowmelt on the Greenland and Antarctic ice sheets, continental snow cover and sea ice (e.g. Reference HallHall and others, 1991; Reference Mote, Anderson, Kuivinen and RoweMote and others, 1993; Reference RidleyRidley, 1993; Reference Zwally and FieglesZwally and Fiegles, 1994; Reference Abdalati and SteffenAbdalati and Steffen, 1995,Reference Abdalati and Steffen1997; Reference AndersonAnderson, 1997). Each of these algorithms was designed for use in regions with extensive ice and snow and few occurrences of winter melting, and gives inconsistent results for southeast Alaska, U.S.A. We show how passive-microwave satellite data can be used to understand snow-cover dynamics in mountainous regions. This algorithm uses the diurnal contrast between frozen and unfrozen snow to detect the transition period from winter to summer. The new algorithm enables distinction between different regional patterns of seasonal snowmelt style and timing.
In southeast Alaska, stable winter Tb ranges from 220 to 240 K. Melt–refreeze cycles occur early in the season when only the surface snow gets a little wet (51%) and the whole snowpack refreezes between cycles. Even small amounts of liquid water in the snowpack attenuate scattering by snow grains. The emissivity and therefore the Tb increase significantly upon melting. When the snowpack first melts, however, it refreezes to nearly the same winter condition, and the night-time Tb is close to the winter value (Reference Hofer and MätzlerHofer and Mätzler, 1980; Reference MätzlerMätzler, 1987).
After repeated diurnal melting, the snow grains metamorphose until the larger, refrozen grains become efficient scatterers (Reference MätzlerMätzler, 1987), causing the emissivity of the night-time snowpack to drop considerably lower than during the winter condition. This contrast to daytime Tb causes high diurnal amplitude variations (DAV) throughout transitional periods. The contrast in day and night Tb is typical of areas that melt during the day and form a refrozen snow crust at night.
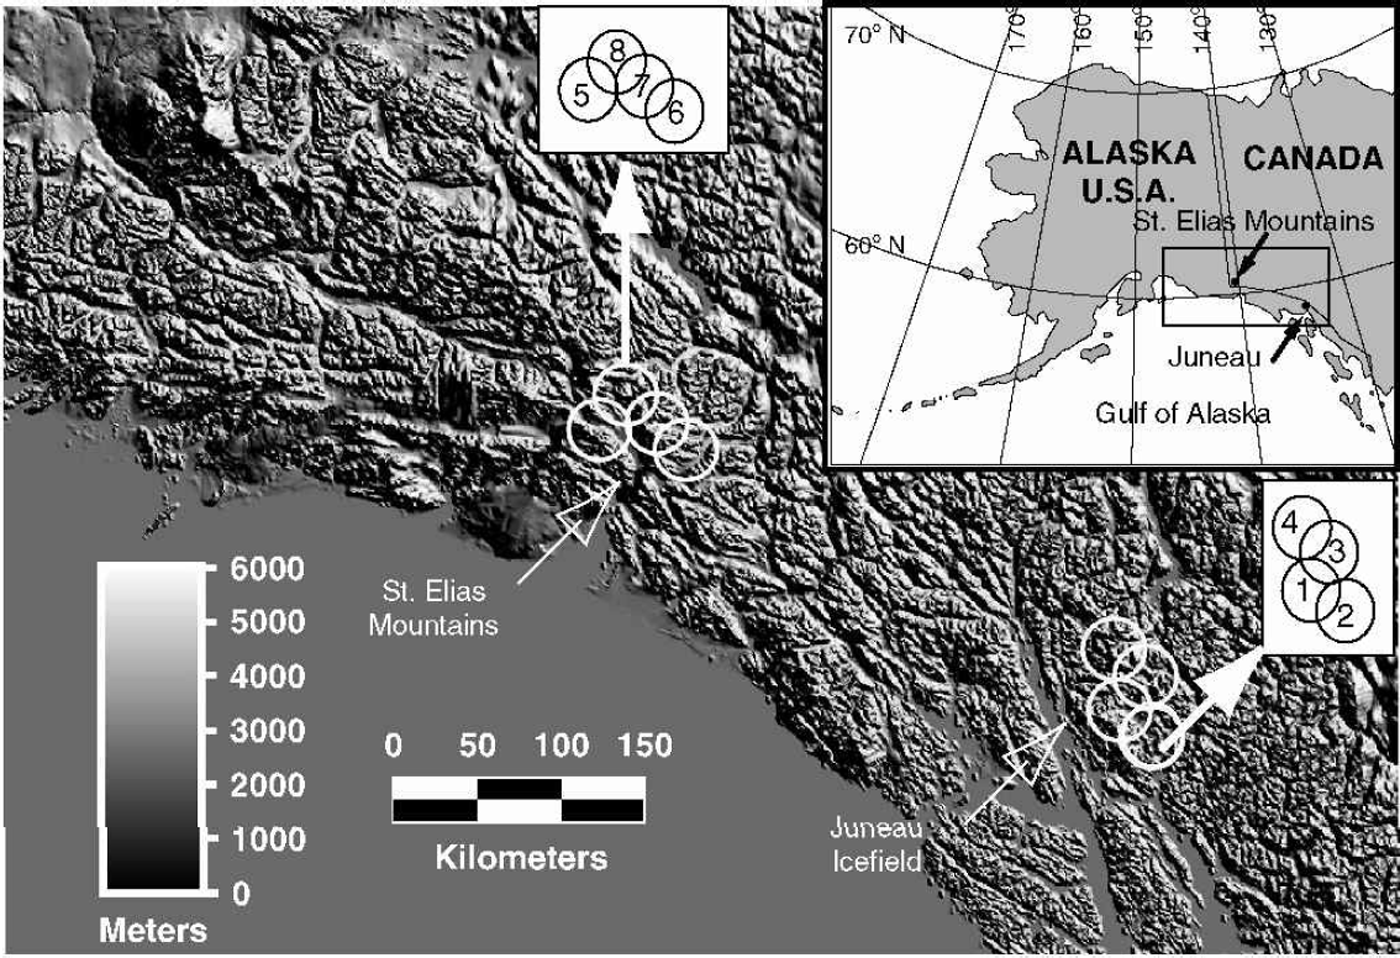
The Coast and St Elias Mountains in southeast Alaska together make up an extensive ridge system parallel to the northeast coast of the Pacific Ocean (Fig. 1). Both are covered extensively by glaciers. Much of the region has had recent negative mass balance. TheJuneau Icefield is located in the southeast part of this region. Pixels can experience unseasonably warm, wet weather in the winter. In the St Elias Mountains farther north on the southern Alaska coast, the topography is even more high-relief and high-altitude, and glaciers are larger and more extensive. SSM/I captures snowmelt dynamics in both these regions.
Location map showing study area and SSM/I pixels discussed in this paper (white circles). The inset map shows the region for which snow-covered pixel data have been extracted for analysis of melt-season parameters in Alaska. Pixels 1–4 are the Juneau Icefield; pixels 5–8 are in the St Elias Mountains.
Maritime snow-covered regions such as the Juneau Ice-field (Fig. 1) have a prominent annual melt onset that is characterized by high DAV superimposed on increasing average daily Tb. After the initial period of melt onset, snow cover on the whole Juneau Icefield is observed to be melting based on surface observations. The Tb stabilizes near 265 K, and the DAV decrease to <±10K. The small summer DAV is due to the fact that the surface does not completely refreeze each night so liquid water that remains in the surface snow-pack keeps the Tb and emissivity uniform. Onset patterns are similar on higher icefields, but the DAV remain high throughout the melt season. Melt onset correlates well with stream discharge, an indication that the methods described below are capturing real transitions in the melt cycle.
Data
SSM/I data
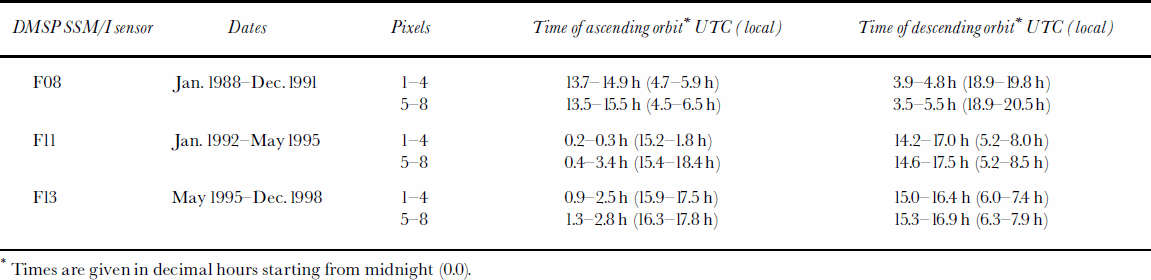
Passive-microwave data come from three U.S. Defense Meteorological Satellite Program (DMSP) SSM/I instruments (F08, F11, F13) that have a collective record back to August 1987 (Table 1). Nominal SSM/I pixel resolution for the 37 GHz channel is 37£28 km2 (Reference Hollinger, Pierce and PoeHollinger and others, 1990). Nominally 25 km by 25 km data in the Equal-Area SSM/I Earth Grid (EASE-Grid) Northern Hemisphere projection were provided by the U.S. National Snow and Ice Data Center (NSIDC). EASE-Grid data keep the ascending and descending orbit observations separate, a feature critical for calculating DAV. Data for this region were rarely acquired on the descending orbit from February 1994 to November 1994. Thus, DAV calculations are not available for 1994.
Each sensor acquisition time cycles through about a 2 hour period. The time of acquisition caused the greatest Tb differences, but is largely factored outby the DAV calculation. The F11 sensor has a drift of about 1hour over several years. There is a time change of approximately 2 hours from sensor F08 to sensor F11, and a 1hour change from sensor F11 to F13. Tb distributions are similar for each sensor (Fig. 2).
Histograms of the 37 GHz vertically polarized brightness-temperature distribution for each of the DMSP SSM/I sensors used in this study (F08, F11 and F13), and the sum of all observations, 1988–98 (All). Pixels shown are 1and 5.

SSM/I acquisition times (in UTC and local times) for southeast Alaska for each sensor. Dates are those used in this paper and are not exact dates of sensor operation
The atmosphere is generally transparent at these frequencies. In this humid area precipitation could, however, be a complicating factor. Although the effect of rain and cloud liquid water cannot be eliminated, Tb is similar for dry and very wet periods and is not correlated with precipitation records in nearby Juneau. The effects of seasonal melting vs frozen snow dominate the signal, so we infer that the cloud liquid-water effects are small.
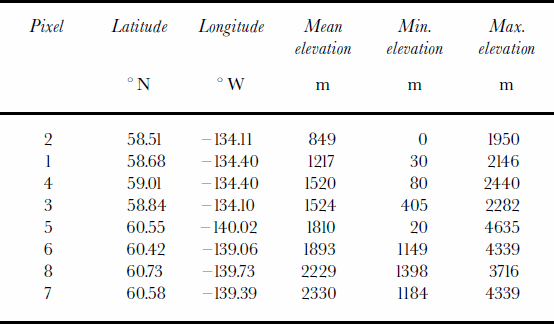
Perennially snow-covered pixels in southeast Alaska were determined by overlaying EASE-Grid pixel centers with 37 km diameter circular regions over a 1986 late-summer Landsat Thematic Mapper (TM) mosaic of the region created from Earth Remote Observation Systems (EROS) Data Center browse images. Thirty-seven kilometers exceeds the EASE-Grid pixel dimensions, but more realistically approximates the satellite footprint. Four Juneau Icefield pixels are all mostly snow-covered even at the minimum snow extent, and with the possible exception of pixel 2, do not include nearby fiords. Mean elevations and ranges are shown in Table 2. Topography, ground cover and melt state in this region vary substantially within a single pixel and imply heterogeneous emissions.
Pixel coordinates and elevations for southeast Alaska. Pixels are ordered by mean elevation
Ground data
Near-surface air temperatures were acquired at 1191m on the Juneau Icefield at Camp 10 (58.64°N, 134.20°W) using a Tempmentor instrument, which automatically recorded air temperature every 2 hours. Tempmentors were calibrated annually using an ice-water bath (personal communication from A. Pinchak, 1999). Each instrument was housed in a standard white meteorological shelter about 1.5m above the nunatak surface.
Brightness-Temperature Characteristics For Snow-Covered Pixels
A sharp difference between melting and not-melting snow-covered pixels is apparent by looking at histograms of the combined ascending- and descending-orbit Tb data for the 37 GHz channel (Fig. 2). The Tb distribution includes each of the DMSP SSM/I sensors used in this study (F08, F11 and F13) and the sum of all observations between 1988 and 1998 (All). The bimodal distribution shows that there is a distinct difference between the Tb of two groups of data, interpreted as melting and non-melting snow-covered pixels. Because liquid water in the snowpack dominates the Tb characteristics, the Tb for melting snow is uniform even among pixels that differ widely in elevation and snow properties. There is significantly more variation in the coldest (non-melting) snow Tb. Because it is limited to the near-surface, the 37VGHz channel is a sensitive indicator of melt–refreeze cycles. The emissivity becomes fairly uniform when there is liquid water in the snowpack; however, in a cold, dry snowpack, many factors, such as depth inhomogeneities and grain-size, also affect the emissivity.
A plot of Ts at Camp 10 vs Tb for pixel 1 on the Juneau Icefield is not linear (Fig.3). Rather, there is a rapid step-like change in Tb when the air temperature is near 0°C and the snow can start to melt. This Tb increase is primarily due to a small percentage of liquid water in the snowpack, as well as real changes in surface temperature. Because liquid water causes a significant increase in emissivity, there are few intermediate Tb values between those representing melt-ing and not-melting.
Scatter plot comparing Juneau Icefield (Camp 10) near-surface air temperatures (°C) with 37 GHz vertically polarized brightness temperatures (Tb) for SSM/I Juneau Icefield pixel 1.

Twice-daily Tb values (Fig. 4a) were used to calculate DAV (Fig. 4b). DAV were captured using a moving difference between ascending and descending orbits, giving a difference between night (early morning) and day (late afternoon) Tb observations for each date. For most of the year, these occur just after the daily minimum and maximum near-surface air temperatures, respectively. The magnitude but not sign of DAV is important. Synoptic weather can superimpose temperature variations irrespective of time of day (Fig. 4c).
1998 (a) 37 GHz V Tb and (b) DAV for Juneau Ice-field pixel 1, compared to (c) 2 hourly near-surface air temperatures measured on theJuneau Icefield at Camp 10.

The DAV for southeast Alaska range from 0 to >±40K. Pixel 1 shows low (cold) Tb in winter, increasing with high fluctuations in spring (April); high (warm) Tb in summer; and then moderate fluctuations followed by a rapid decrease back to winter Tb (Fig. 4a). Important points to note about the Tb and DAV signals are the strong annual cycle and the abrupt increase in the magnitude of DAV when the average daily Tb starts to increase (Fig. 4c).
Snow-covered pixels have a bimodal distribution of Tb, with the minimum number of occurrences apparently corresponding to the point at which liquid water causes the emissivity and Tb to increase. The melt threshold is in this minimum range. There are few intermediate Tb values because the temperature is increasing and the emissivity increases greatly with only small increases in moisture. The melt threshold was chosen to be a good representation of the change from frozen (dry) snow to melting snow for all types of snow-covered pixels. The 37V threshold of 246K was selected for applicability in several regions, including the Juneau Icefield, the St Elias Mountains and western Greenland (not shown).
Melt–Refreeze Cycles On The Juneau Ice-Fieldandrelation To Surface Temperature
We use pixel 1 on the Juneau Icefield as the primary calibration site to examine the annual, seasonal and diurnal cycles. A complete year (1998) of twice-daily Tb and DAV data (Fig. 4a and b) is compared to temperatures at Camp 10, located within the pixel (Fig. 4c). The running daily average Tb is superimposed on all the observations of the 37VGHz Tb (Fig. 4a). Average Tb does not show diurnal variations but does show the effect of short-term temperature fluctuations throughout the year. The running difference (DAV) between night and day observations emphasizes the diurnal variations. Only DAV magnitudes are shown (Fig. 4b).
The strong annual Tb cycle is approximately parallel to the temperature cycle. Between days 80 and 140 the surface temperature and the average Tb both increase. This is the transitional period when refreeze cycles are active, so DAV (Fig. 4b) are also high. In addition to seasonal changes, there are synoptic and diurnal changes. By summer (days 145–200), the DAV are small again, in particular at the time when the surface temperatures are highest.
The DAV can be as large as the annual variations, but they are concentrated in certain time periods, particularly during early spring and early autumn. Average daily Tb increases throughout the spring, as do actual Tb and Ts curves. The melt onset occurs when temperatures are near 0°C. The Tb reaches a stable value of about 265 K during the summer (after day 130). (Due to emissivity <1, Tb never reaches 273 K.) The high summer Tb is coincident with a decrease in DAV on Juneau Icefield pixels, a strong indicator that the surface snow stays wet. This is consistent with field observations on the Juneau Icefield. Snow-wetness measurements were made at several times of day during summer 1997, including an all-night observation sequence on a cold, clear night. Evening and night observations of snow wetness showed that although the snow surface wetness decreased, the surface did not refreeze completely at these elevations. Surficial freezing is possible at higher elevations, but the area of refreeze may be too small to have an effect on the Tb.
Large DAV occur during transitional seasons and are largest during the spring melt onset. This observation is consistent with the idea that the snowpack is starting to melt and that the total liquid-water content by volume is increasing, causing higher daytime Tb values, but the surface refreezes at night (Reference Foster, Hall, Chang and RangoFoster and others, 1984). The emission depth of the 37 GHz channels is very shallow, so it is particularly sensitive to these fluctuations. During these melt cycles the night-time Tb observation is lower than the pre-melt night-time Tb, due to the formation of a refrozen surface crust (Reference Ulaby, Moore and FungUlaby and others, 1986). This strong day–night difference is captured by the large increase in DAV and indicates frequent melt and refreeze cycles (Fig. 4c).
During the winter, when the maximum surface temperature is <0°C (days 1–40), the DAV are small, though the Tb does exceed 246 K (the Tb threshold) on occasion. The parallel surface and Tb curves can be seen in winter 1998 (Fig. 4) for the whole year and in synoptic-scale fluctuations during all seasons.
High-amplitude DAV are also common in the fall during the freeze-up (Fig. 4). Some of the same physical mechanisms also affect the cooling and refreezing of the surface in autumn. The summer average Tb plateau starts to decrease gradually in August (days 210–235) and at the same time the surface temperature decreases and stays close to 0°C. In September (days 250–275), the surface temperature drops to 0°C and there is a large decrease in Tb accompanied by a period of high DAV at days 250–280. The DAV in the fall are of smaller magnitude and often occur over a shorter period than in spring (the 1998 refreeze is longer than many). The Tb signature is complicated by accumulation of new snow in the fall. October–November is the wettest period of the year. After the freeze-up, the surface temperature stays <0°C but continues to have daily and synoptic variations. The winter Tb values fluctuate around atypical (pixel-specific) winter value. This value is about 240 K for the Juneau Icefield.
Melt–Refreeze Cycles In The St Elias Mountains
There are large differences in Tb signatures between the Juneau Icefield and other parts of the heavily glacierized southern coast of Alaska. These are partly due to pixel heterogeneity (on the scale of SSM/I data), topographic distribution, snow cover and the more extreme temperature conditions in the St Elias Mountains.
The observation that the Tb distribution is bimodal, with peaks concentrated either above or below the melt threshold, makes it possible to establish a method for studying pixels beyond the Juneau Icefield. Thresholds are channel-specific, but this method works for all four 19 and 37 GHz channels. To illustrate the characteristic altitude differences, we compared pixel 1 on the Juneau Icefield to a much higher, inland pixel in the St Elias Mountains (pixel 5). Figure 5a and b compare annual Tb cycles on the Juneau Icefield and the St Elias Mountains over 2 years. Because these are raw Tb values (not daily averages), it is possible to see the large diurnal amplitude fluctuations during spring in both regions (see arrows) and continuing for the whole melt season in the St Elias region (Fig. 5b). The characteristics of the melt onset are similar; melt onset in high-elevation pixels is denoted by the increasing Tb and high DAV (Fig. 5c and d). The melt onset occurs later in the spring on higher pixels such as pixel 5. The transition from not melting to melting is also commonly more abrupt on higher pixels. This may be because there is often liquid water in the snowpack at low-elevation, maritime sites such as the Juneau Icefield, so seasonal changes are not as distinct.
1992–93 time series of 37 GHz vertically polarized brightness temperature for pixel 1 (a) and pixel 5 (b), and 1992–93 time series of 37 GHz vertically polarized DAV for pixel 1 (c) and pixel 5 (d). Vertical arrows mark melt onset and cold fall Tb for each place and year. Horizontal arrows show duration of high DAV. Pixel 1 has a mean elevation of 1217 m; pixel 5 has a mean elevation of 1810 m.
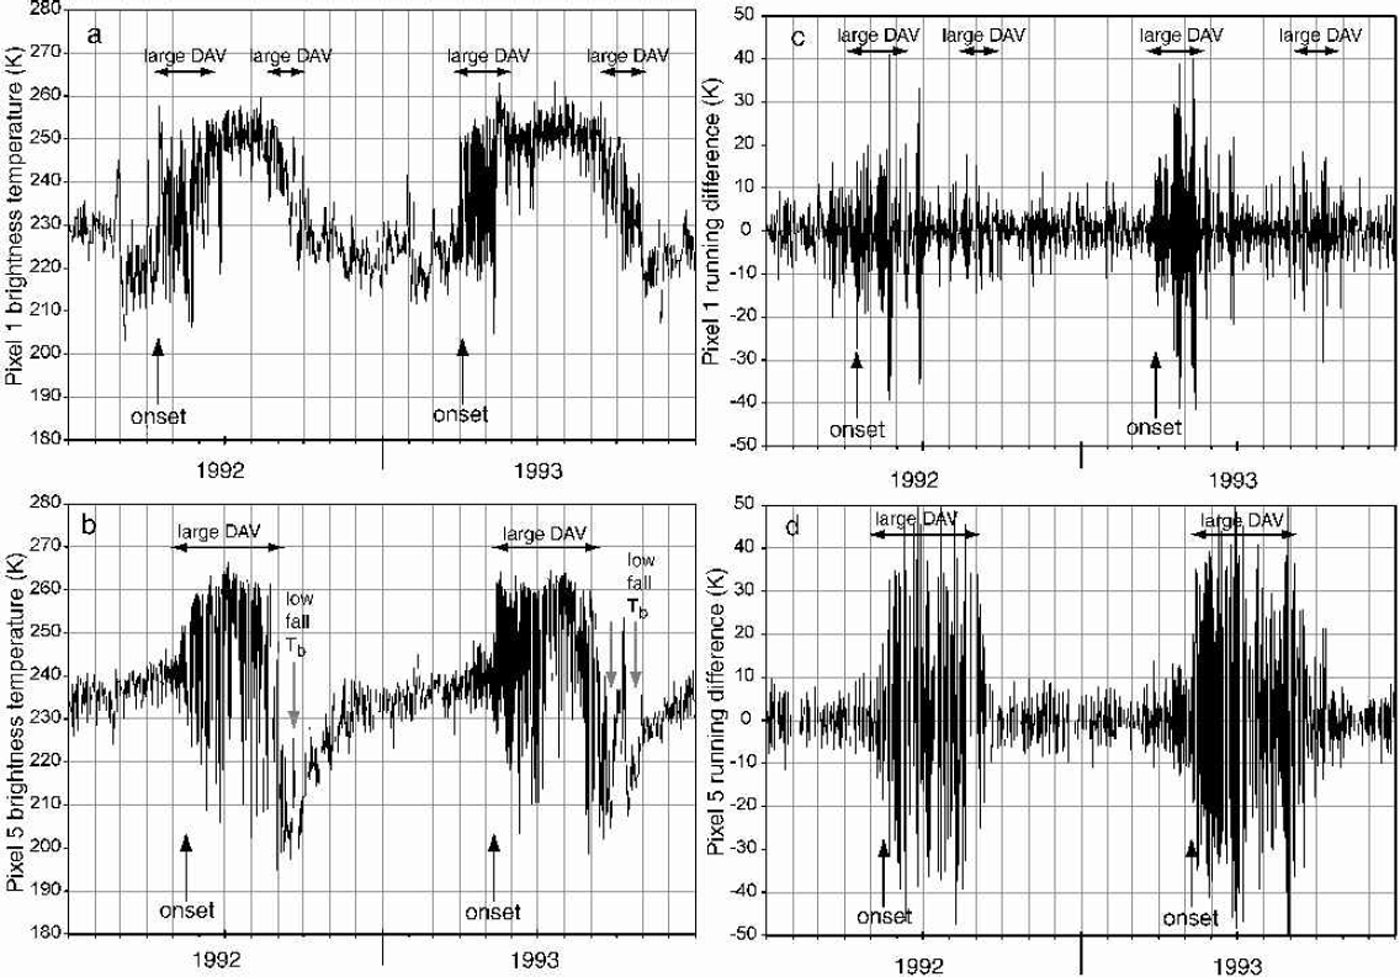
Summer characteristics differ. Colder, higher-elevation pixels maintain high DAV throughout most of the summer because the surface snowpack is going through diurnal melt–refreeze cycles. The refreeze in the fall and the stable winter signature are visible on pixels 1 and 5.
There are differences on pixel 5 in both the Tb sequence and the daily amplitude fluctuations that are related to the higher elevation and colder climate influencing the snow-pack. The Tb reflect annual, synoptic and diurnal variations, but the Tb signatures for the two pixels are distinct because of the different lengths of periods with melt–refreeze cycles throughout the year.
Winter Tb is more variable and less extreme on the Juneau Icefield than in the St Elias Mountains. Tb increases faster and earlier on the Juneau Icefield. High DAV are the most prominent marker of melt cycles, but are of shorter duration on the Juneau Icefield than on the St Elias Mountains. A difference between pixels 1 and 5 is that the large DAV continue throughout the melt season on pixel 5. These ongoing, strong, persistent DAV are attributed to melt and refreeze of the surface layer on a daily basis.
Higher-elevation pixels, such as pixel 5, are characterized by a large decrease in Tb early in winter after the refreeze (Fig. 5). This is related to minimum surface temperatures and is probably the result of deeper freezing of the surface. The Tb recovery is due to burial of the refrozen firn by new snow accumulation. The Tb recovers by day 300 to a stable winter value (about 230 K). At the time of freeze-up, there is a second peak in high DAV or, in the case of pixel 5, with high DAV throughout the summer, an end to large DAV.
The contrasts between high-elevation pixels in the St Elias Mountains (e.g. pixel 5) and lower-elevation pixels in the Juneau Icefield (e.g. pixel 1) illustrate the use of the DAV method for determining which areas go through a daily melt–refreeze cycle and when the cycles occur (Fig. 5). Elevation plays a role, as is clear in a consistent timing difference in melt and refreeze between the Juneau Icefield and St Elias Mountains.
Determining Melt Onset, Refreeze, And Ablation-Season Duration
We developed two methods to capture the beginning and end of the melt season. The first method (DAVmethod) signals the earliest melt and latest refreeze, and the second method (melt method) indicates when the surface is significantly wetted.
The DAV method uses the transition from small to large DAV to determine the melt onset (the reverse for the refreeze). It gives the maximum duration (earlier onset and later refreeze) estimate of melting because high DAV occur even when the Tb has not exceeded themelt threshold. This is especially true at the end of the melt season when the scattering during refreeze becomes complex. The threshold used was DAV>±10 K, ignoring isolated occurrences very early or late in the season. The process of choosing onset and refreeze dates was aided by curves showing the cumulative occurrences of DAV exceeding the threshold at a daily temporal resolution.
The melt method uses the first and last dates on which the Tb and the DAV simultaneously exceed their respective thresholds. The melt season is shorter than that derived from the DAV method. This estimate is more indicative of extensive surface melting, whereas the DAV method is sensitive to the slightest liquid water in the snowpack, both early and late in the melt season. These two methods occur at the same time for maritime regions such as the Juneau Ice-field, but on different dates for regions that are colder such as the St Elias Mountains. Details for each southeast Alaskan snow-covered pixel are shown in Reference RamageRamage (2001). Interannual variation of melt onset, refreeze and ablation-season duration are shown for the Juneau Icefield region (pixels 1–4) and the St Elias Mountains (pixels 5–8) (Fig. 6). Error bars show the spread of dates. The regional pattern of interannual variations for southeast Alaska shows a tendency toward earlier melt onset, later refreeze and longer ablation seasons in the latter part of the 1988–98 period. It is not known whether this is related to regional warming or to one of the shorter decadal-scale oscillations in the Gulf of Alaska.
Interannual variation of (a) melt onset and refreeze on the Juneau Icefield (pixels 1–4), (b) melt onset and refreeze in the StElias Mountains (pixels 5–8), (c) ablation-season duration on the Juneau Icefield and (d) ablation-season duration in the St Elias Mountains. Error bars show the range of values for each region. Trend lines are wide to emphasize caution in interpretation.

Snowmelt Timing And Drainage-Basin Discharge
Discharge from Mendenhall Glacier on the Juneau Icefield was gauged (data come from http://waterdata.usgs.gov/ak/nwis/discharge) for much of the period of satellite record. The drainage area is 221 km2 and includes pixel 1. This station measures mainly glacial discharge, with a small component from surrounding mountainsides.
Stream discharge is related to seasonal snowmelt, glacier melt and precipitation. Annual discharge characteristics are low winter flow, an initial increase in discharge at about days 100–110, a steep increase near and after day 130, a declining discharge in the fall (*day 260) and a decrease to a stable, low winter flow (starting at day 320) (Fig. 7b). Glacier melt keeps the discharge high until late in the season. The low winter flow is perturbed occasionally by large precipitation events recorded at the Juneau Airport (Fig. 7c). Short-lived discharge peaks above the seasonal curve are related to precipitation events.
1993 pixel 1 DAV (a) compared to Mendenhall River discharge (b) and daily precipitation at the Juneau Airport (c).
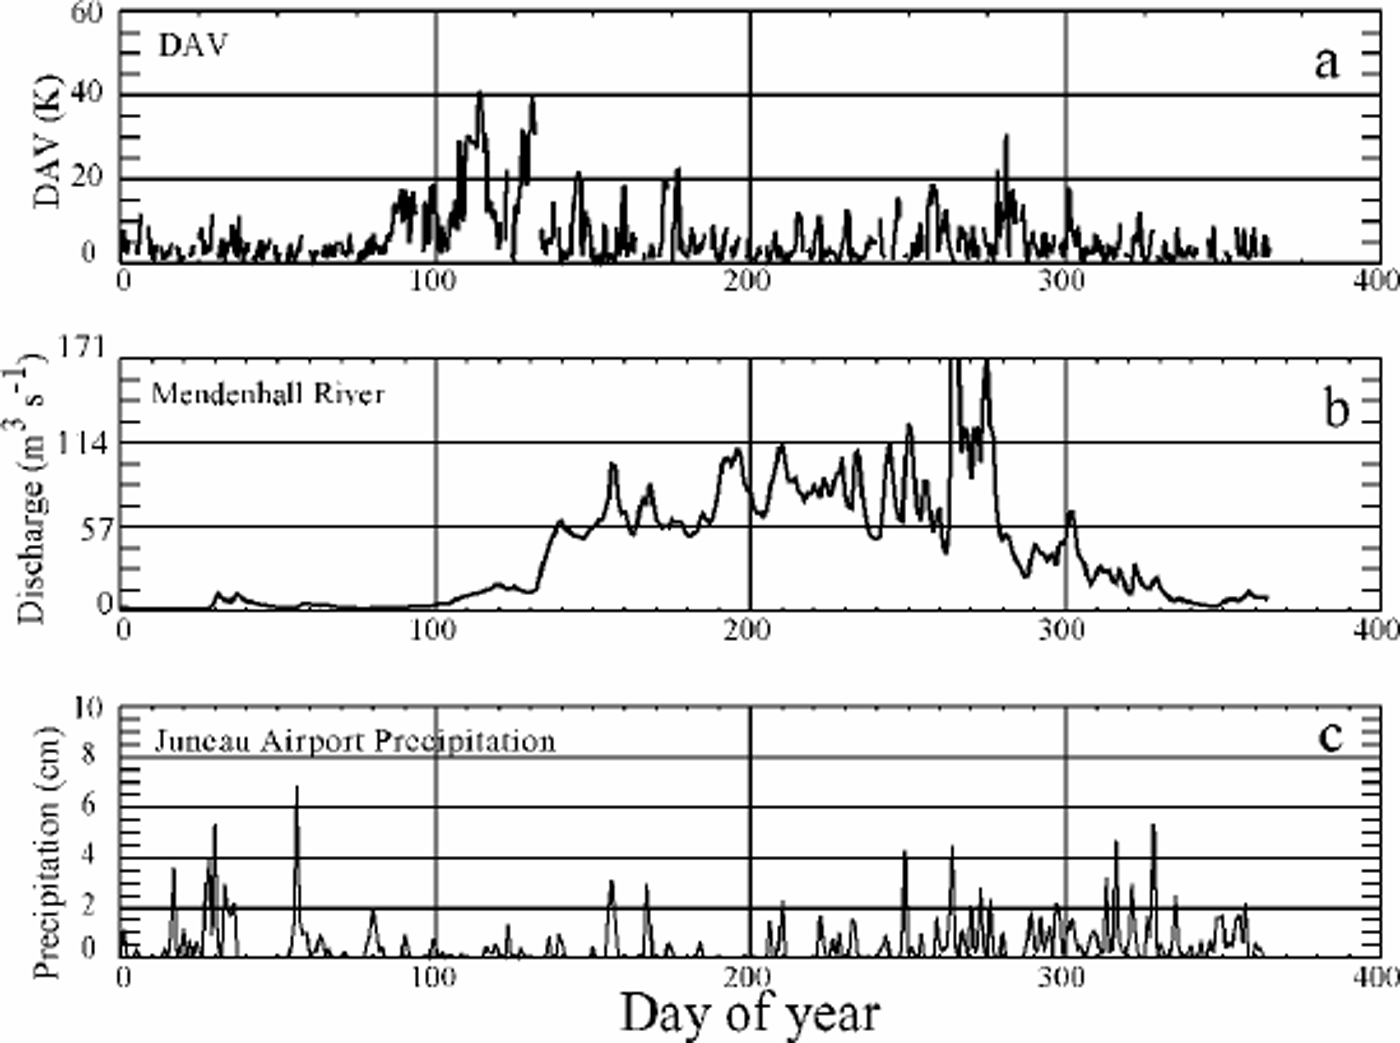
The discharge curves help relate the SSM/I DAV signal to snowpack metamorphism and release of liquid water to the hydrologic system. In mid-March 1993 (*day 130) the discharge on the Mendenhall River started to rise, with increasing rates reaching a significant and prolonged peak (or peaks) that was coincident with the end of the high-DAV period (Fig. 7a). The increase and rate of change was much greater than from precipitation alone. Pixel 1DAVare compared to the glacierized Mendenhall River basin discharge (Fig.7a and b). Discharge reached approximately 57 m3 s–1 (2000 cfs) at about the time of the end of the spring DAV. The significant discharge increases come at the end of the period of frequent melt–refreeze cycles. This relationship shows that the beginning of the high DAVcorresponds with the onset ofmelting, andthe end of high spring DAV (in maritime areas) corresponds to the time when the snowpack has started to release a large amount of meltwater. Because the Mendenhall River has mostly glacier contributions and not seasonal snow, its discharge continues to rise later in the ablation season. These characteristics of the river discharge reinforce the SSM/I snowmelt pattern correspondence with the physical state of the snowpack. Tb and DAV change in such a way that they give real information about melt onset, snowpack ripening and water release to channel flow.
Results And Conclusions
This research showed that melt onset and refreeze in snow-covered alpine regions with complex topography are detectable using a time series of combined ascending and descending (not averaged) EASE-Grid SSM/I Tb values. Early melt was detected using the DAV threshold (±10 K) independent of Tb (DAV method). A later, more developed melt was detected using both a DAV threshold (± 10 K) and a Tb threshold (>246K).
Summer Tb characteristics for maritime pixels, such as the Juneau Icefield, show a stabilization of night- and daytime Tb near 265 K after the initial melt-onset period. In maritime regions, the end of summer is characterized by a decrease in Tb and a second period of high DAV. During the fall refreeze period, DAV in maritime regions are of lower magnitude than those of the spring melt.
In contrast, on high-elevation pixels, high DAV persist through the melt season, and the end of the high-DAVperiod is equivalent to the end of the summer melt season. Tb continues to decrease to stable winter levels. High-elevation pixels have a dramatic drop to very low Tb levels in the early part of winter. Tb increases due to burial of the refrozen surface and stabilizes at a winter level near 230 K.
DAV are important for determining the melt-timing relationship to river discharge. Discharge curves from the Mendenhall River have a rapid increase in early spring that is close in time to the SSM/I-derived melt-onset dates. The discharge responds rapidly to the seasonal and glacial snow-melt. The end of the high-DAVperiodcoincides with the rapid rise in melt water. On the Mendenhall River, a drainage basin that provides almost entirely glacier runoff, there is even more discharge after the high DAV when the glacier is releasing meltwater during the day and night, as is evidenced by the return to small DAV on the Juneau Icefield. Discharge continues to be high or increase throughout the melt season. The relationship between DAV and discharge indicates that these SSM/I melt-onset methods are capturing real transitions in the melt cycle. The SSM/Imelt and refreeze time series and regional patterns, supported by interannual variations in stream discharge, are helpful means of determining when and where there is significant mass loss in glacierized mountainous regions.
Acknowledgements
SSM/I EASE-Grid satellite data come from the NSIDC, Boulder, CO. We would like to thank M. Miller, A. Pinchak, R. Asher and the Juneau Icefield Research Program for use of meteorological data. Discharge data were supplied by the U.S. Geological Survey. Precipitation data come from the U.S. National Oceanic and Atmospheric Administration. This research was supported by NASA’s Graduate Student Researcher Program/Goddard Space Flight Center grant NGT5-51 and NASA Land Surface Hydrology Program grant NAG5-7497.



