Implications
The search of molecular markers associated with meat quality traits is of particular interest in pigs as these traits are difficult to assess in live animals and thus, difficult to include in objectives of classical selection programmes.
Introduction
Since the first quantitative trait loci (QTL) mapping study in pigs was published by Andersson et al. (Reference Andersson, Haley, Ellegren, Knott, Johansson, Andersson, Andersson-Eklund, Edfors-Lilja, Fredholm, Hansson, Hakansson and Lundstrom1994), more than 5600 QTL affecting almost 550 different traits have been identified in different porcine populations (PigQTLdb; Hu et al., Reference Hu, Fritz and Reecy2007). Although meat quality traits are difficult to assess in live animals and are thus good candidates for marker-assisted selection, only a small part (about 15%) of the QTL identified so far concerns meat quality. Furthermore, most of the QTL were identified in studies using exotic populations of pigs, like Chinese or wild animals. When QTL are detected in such populations, they cannot be directly used in selection programmes and additional studies are required to confirm the existence of these QTL in commercial populations. Nevertheless, genome scans are carried out on an increasing number of crosses of commercial populations: Yorkshire × Berkshire (Malek et al., Reference Malek, Dekkers, Lee, Baas and Rothschild2001a and Reference Malek, Dekkers, Lee, Baas, Prusa, Huff-Lonergan and Rothschild2001b), Piétrain × Large White (Nezer et al., Reference Nezer, Moreau, Wagenaar and Georges2002), Iberian × Landrace (Varona et al., Reference Varona, Ovilo, Clop, Noguera, Pérez-Enciso, Coll, Folch, Barragan, Toro, Babot and Sanchez2002), Hampshire × Landrace (Karlskov-Mortensen et al., Reference Karlskov-Mortensen, Jorgensen and Fredholm2005) or Duroc × Piétrain populations (Liu et al., Reference Liu, Jennen, Tholen, Juengst, Kleinwachter, Holker, Tesfaye, Un, Schreinemachers, Murani, Ponsuksili, Kim, Schellander and Wimmers2007; Edwards et al., Reference Edwards, Ernst, Raney, Doumit, Hoge and Bates2008a and Reference Edwards, Ernst, Tempelman, Rosa, Raney, Hoge and Bates2008b) and even on purebred commercial populations (Evans et al., Reference Evans, Giuffra, Sanchez, Kerje, Davalos, Vidal, Illan, Noguera, Varona, Velander, Southwood, De Koning, Haley, Plastow and Andersson2003; Vidal et al., Reference Vidal, Noguera, Amills, Varona, Gil, Jiménez, Davalos, Folch and Sanchez2005; Tribout et al., Reference Tribout, Iannuccelli, Druet, Gilbert, Riquet, Guéblez, Mercat, Bidanel, Milan and Le Roy2008). All these studies revealed a large number of QTL, suggesting that different alleles are fixed in distinct commercial populations or that QTL are still segregating in purebred populations after many generations of selection.
Both Duroc and Large White breeds are major commercial pig populations. Nevertheless, the two breeds differ to some extent for several meat quality and production traits. In particular, Duroc pigs have a higher intramuscular fat content and are considered to have a better meat quality than Large White pigs. Pig breeds with a higher content of fat like Duroc also produce more cortisol (e.g. see Désautés et al., Reference Désautés, Bidanel and Mormède1997) due to the fact that secretion of cortisol favours the accretion of fat at the expense of proteins (Devenport et al., Reference Devenport, Knehans, Sundstrom and Thomas1989). Other stress hormones (adrenaline and noradrenaline), released by the sympathetic nervous system consecutively to slaughtering stress, can reduce muscle glycogen content and thus post-mortem acidification, leading to a degradation of meat quality by producing DFD-type (dark, firm and dry) meat (Fernandez and Tornberg, Reference Fernandez and Tornberg1991). The inhibition of stress hormone secretion could thus be associated with an improvement of both some fatness and meat quality traits.
In order to map QTL for meat quality and other associated traits, a three-generation resource population was developed at INRA by mating Large White sows to Duroc boars. The F2 animals were measured for a large number of meat quality traits. Stress hormone levels, which have been found to be related to meat quality in the F2 population (Foury et al., Reference Foury, Devillers, Sanchez, Griffon, Le Roy and Mormède2005), and major production traits were also measured. The F2 Duroc × Large White population has already allowed detecting QTL for intramuscular fat content and fatty acid composition in the longissimus dorsi muscle (Sanchez et al., Reference Sanchez, Iannuccelli, Basso, Bidanel, Billon, Gandemer, Gilbert, Larzul, Legault, Riquet, Milan and Le Roy2007). In this study, we investigated the QTL for other meat quality criteria, stress hormone levels and the main growth and carcass traits.
Material and methods
The animals were reared and slaughtered in compliance with national regulations applied in research and commercial slaughtering.
Animals and measurements
An F2 cross between Duroc and Large White pigs was carried out at the INRA GEPA experimental unit (Le Magneraud, Charente-Maritime, France). Eight Duroc boars from a nucleus herd (Selpa, Alliers, France) were mated to 37 Large White sows (F0 generation). Thirty-seven F1 litters were produced, among which 10 sires and 32 dams were randomly selected and mated to produce the next generation. Each F1 dam produced three litters with the same boar and a total of 775 F2 pigs were produced. Male F2 piglets were castrated shortly after birth. Piglets were weaned at 28 days of age and placed in post-weaning collective pens until 10 weeks of age. They were then transferred to a fattening unit and submitted to a performance test until approximately 20 weeks of age. During the fattening period, animals were conducted in contemporary groups (four groups of eight dams, raised for three litters representing 12 contemporary groups in total).
All animals were weighed at birth, at weaning, at the beginning and at the end of the fattening period. Pigs were slaughtered at an average liveweight of 104 kg (from 79 to 125 kg) in a commercial slaughterhouse. Carcass weight and length, as well as carcass fat depths at the shoulder, the last rib and the hip joint were measured shortly after slaughter. Additional fat and lean depths were taken using a Fat-o-Meat’er (SFK Technology A/S, Herlev, Denmark) probe to estimate carcass lean meat content (ELMC). Urine was collected after slaughter from the bladder in 186 F2 pigs in order to measure levels of stress hormones (cortisol, adrenaline and noradrenaline). Details on the measurement of these hormones can be found in Foury et al. (Reference Foury, Devillers, Sanchez, Griffon, Le Roy and Mormède2005).
On the day after the slaughter, the whole carcass was weighed and the half-right carcass was divided into five cuts, that is, ham, loin, belly, shoulder and backfat, which were individually weighed. Several meat quality criteria were also recorded on different muscles. Ultimate pH was measured on the adductor femoris (pHu-AF), longissimus dorsi (pHu-LD) and gluteus superficialis (pHu-GS) muscles using a Knick Portaness 910 pH meter (Knick GmbH & Co., Berlin, Germany) with a Mettler Toledo Probe (Mettler-Toledo International Inc., Urdorf, Switzerland) at 4°C. The water-holding capacity (WHC) and colour were also recorded on the gluteus superficialis (GS) and biceps femoris (BF) muscles. WHC was measured using a piece of filter paper put on the freshly cut surface of the muscle and was defined as the time for the paper to become wet (a higher value is associated with a better WHC). Colour was measured through the three coordinates (L*, a* and b* systems) obtained with a Minolta CR-300 chromameter (Konica Minolta, Tokyo, Japan) using the D65 illuminant option and an 11-mm orifice. Values of L* indicate lightness of the meat (a lower value is associated with a darker meat), while a* and b* represent the degrees of green-redness and blue-yellowness of the meat, respectively.
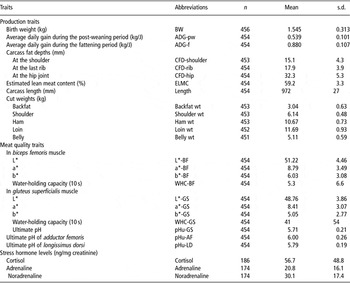
A total of 27 traits described in Table 1 were analysed: 11 meat quality traits, 13 production traits and three stress hormone concentrations. The number of F2 animals with both phenotype and genotype data ranged from 174 to 456 depending on the trait.
Number of records, means and s.d. for traits measured

Molecular analyses
The six F1 boar families with the largest number of offspring (from 71 to 101) were selected for molecular analyses. F1 sires were genotyped for 157 microsatellite markers, among which a set of 91 informative markers covering the porcine autosomes was selected. From three (for SSC15 and 18) to nine markers (for SSC7) were typed per chromosome. The telomeric parts of some chromosomes (SSC4, 5, 6, 12 and 15) were not covered by genotype markers. The average distance between adjacent markers was 24.6 cM on the sex-averaged map (see Sanchez et al. (Reference Sanchez, Iannuccelli, Basso, Bidanel, Billon, Gandemer, Gilbert, Larzul, Legault, Riquet, Milan and Le Roy2007) for the genetic map). One to six F1 boars were heterozygous (4.4 in average) for the 91 microsatellite markers. Thirty-one F0 animals, 27 F1 animals (six boars and 21 sows) and 456 F2 pigs were genotyped for this set of markers using DNA extracted from blood samples at the Labogena laboratory (Jouy-en-Josas, France).
Statistical analyses
Before QTL mapping analyses, traits were adjusted for environmental effects using the GLM procedure of SAS Institute (1999). All traits were corrected for the fixed effects of sex and contemporary group (fattening batch). Carcass traits were additionally adjusted for carcass weight, whereas meat quality traits and stress hormone levels were corrected for the date of measurement nested within a fattening batch.
Interval mapping analyses were performed on adjusted data using the QTLMAP software (Le Roy et al., Reference Le Roy, Elsen, Boichard, Mangin, Bidanel and Goffinet1998). A combined half-sib–full-sib model assuming that the population is a mixture of half- and full-sib families was used. For each cM along a chromosome, the hypothesis of one QTL (H1) linked to the set of markers considered was compared to the hypothesis of no QTL (H0) at the same location. Under H1, a QTL with a gene substitution effect for each sire and for each dam was fitted to the data. Likelihoods were then maximized under each hypothesis and the test statistic was computed as the ratio of likelihoods (LR). At the location with the highest LR, average substitution effects were estimated within each sire and dam family. Additional details on likelihood and gene substitution effect computations are given in Le Roy et al. (Reference Le Roy, Elsen, Boichard, Mangin, Bidanel and Goffinet1998). Approximate confidence intervals of QTL position were determined by the ‘drop-off’ method (Lander and Kruglyak, Reference Lander and Kruglyak1995).
Significance thresholds were empirically determined at the chromosome (suggestive) level, by performing simulations under H0, using the assumption of a polygenic infinitesimal model (Le Roy et al., Reference Le Roy, Elsen, Boichard, Mangin, Bidanel and Goffinet1998). A total of 5000 simulations were achieved for each chromosome × trait combination, and an approximate Bonferroni correction as described by Bidanel et al. (Reference Bidanel, Milan, Iannuccelli, Amigues, Boscher, Bourgeois, Caritez, Gruand, Le Roy, Lagant, Quintanilla, Renard, Gellin, Ollivier and Chevalet2001) was applied to obtain genome-wide (significant) levels. A genome-wide probability of 0.05 corresponded then to a chromosome-wide probability of 0.0027. When a suggestive or significant QTL was detected, values of effects estimated for each sire were tested using a Student’s t-test. When the probability (P) associated with the test statistics was lower than 5%, we considered that the value of the effect was different of zero and thus, that the sire was heterozygous for the QTL. Otherwise (P > 5%), the sire was considered as homozygous.
Results
The number of records, means and standard deviations of the traits studied are listed in Table 1.
The analyses led to the detection of 56 QTL. Seven QTL exceeded the genome-wide significance threshold. The 49 others only reached the suggestive threshold. All autosomes contained at least one QTL. One (SSC3 and 8) to nine (SSC17) QTL were detected per chromosome. In all, 24 of the 27 traits investigated were affected by one or several (up to seven) QTL. The only three traits with no QTL detected were carcass fat depth at the hip joint, belly weight and a* value of the gluteus superficialis muscle. Twenty QTL affected meat quality traits, 33 affected production traits and three QTL were identified for levels of stress hormones. For all QTL detected, one to five of the six F1 sires were found to be heterozygous, suggesting that QTL alleles were not fixed in Duroc and Large White founders.
QTL for meat quality traits
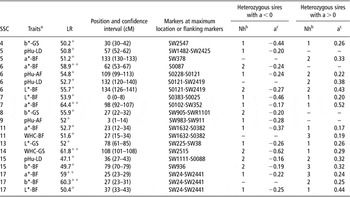
A total of 20 QTL affecting meat quality traits were detected on 11 chromosomes (4, 5, 6, 7, 8, 9, 11, 13, 14, 15 and 17). For each of these chromosomes, one to four traits related to meat quality were found significant at the chromosome-wide significance threshold (Table 2). We have identified four suggestive regions for pH measurements, nine suggestive regions for meat colour traits and two suggestive regions for WHC.
QTL detected for meat quality traits
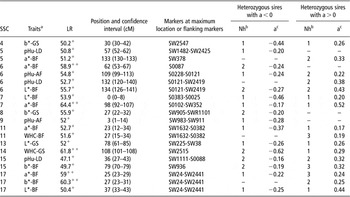
QTL = quantitative trait loci; LR = likelihood ratio; +, ++ = 5% and 1% chromosome-wide significance levels, respectively.
aSee Table 1.
bNumber of heterozygous F1 sires.
cAverage allele substitution effect of heterozygous F1 sires: Large White–Duroc alleles in phenotypic standard deviation.
For pH measurements, the most important effects (∼0.4 ph s.d. (phenotypic standard deviation)) were found for pHu-LD on SSC6. For this QTL, two F1 boar families were found to be heterozygous. Significant, but less important, effects (about 0.2 ph s.d.) were observed for pHu-AF on the same chromosome, but at a slightly different position. Other suggestive effects were found for ultimate pH measurements on SSC5, 9 and 15.
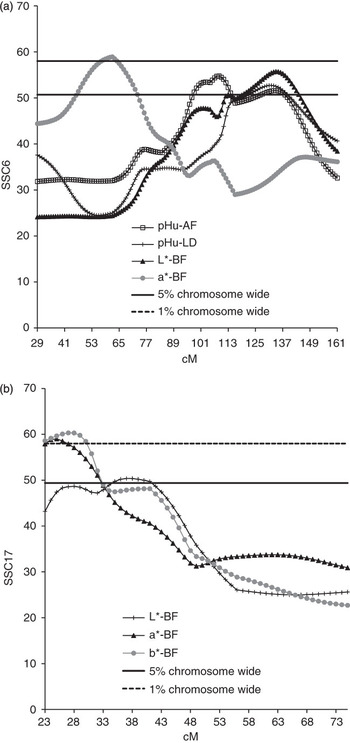
A total of 13 suggestive QTL were detected for traits related to meat colour in nine chromosomal regions. In four of these regions located on SSC4, 6, 7 and 17, QTL effects were close to 0.5 ph s.d. for at least one F1 sire. On SSC6, two distinct QTL were detected, the first one affecting a*-BF at 62 cM and the second one affecting L*-BF (Figure 1a). Meat colour was also influenced by two QTL regions on SSC7, with significant effects on L*-BF and on a*-BF. For L*-BF, the Duroc allele was associated with a lighter meat. Finally, a region of SSC17 had significant effects on the three Minolta coordinates of the biceps femoris muscle, with very similar most likely positions (Figure 1b). Additional suggestive QTL affecting meat colour traits were detected in our population on SSC5, 8, 11, 13 and 15, but their effects were lower than those of the above-mentioned QTL.
Likelihood ratio profile for meat quality traits on chromosomes 6 (a) and 17 (b).

Finally, two QTL acting on WHC were identified on chromosomes 11 and 14, with, in both cases, three boars identified as heterozygous. Large White alleles were systematically associated with a better WHC for the SSC11 QTL, but had favourable effects for only one of the three heterozygous F1 boars in the case of the SSC14 QTL.
QTL for production traits
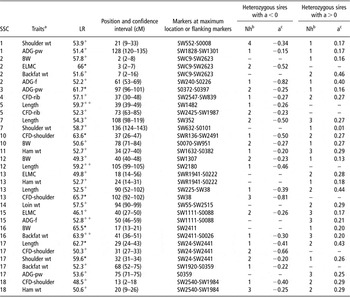
A total of 33 QTL were detected for production traits. They were located on all autosomes except SSC6, 8 and 9. Seven of them, located on SSC2, 3, 10, 13, 16 and 17 exceeded the genome-wide significance threshold (Table 3).
QTL detected for production traits

QTL = quantitative trait loci; LR = likelihood ratio; * = 5% genome-wide significance levels respectively; +, ++ = 5% and 1% chromosome-wide significance levels, respectively.
aSee Table 1.
bNumber of heterozygous F1 sires.
cAverage allele substitution effect of heterozygous F1 sires: Large White–Duroc alleles in phenotypic standard deviation.
The QTL located in the p-terminal region of SSC2, that is, in the IGF2 gene region, had genome-wide significant effects on ELMC and suggestive effects on backfat weight. The SSC3 QTL had significant effects on post-weaning growth. Two other QTL, located on SSC10 and 13, had genome-wide significant effects on shoulder fat depth. The SSC13 QTL had particularly large effects on the trait (−0.8 ph s.d.). Furthermore, on SSC17, genome-wide significant effects were detected for shoulder weight and carcass length and chromosome-wide significant effects were detected for several other traits. Finally, a genome-wide significant QTL was detected for body weight at birth on SSC16 (17 cM).
For all the heterozygous sires, the effects of the Duroc alleles were favourable for the SSC2 QTL, but unfavourable for the SSC13 and SSC16 QTL. For the three other QTL (SSC3, 10 and 17), the sense of the effect varied depending on the sire.
Additional QTL were suggested for birth weight on SSC2, 10 and 12; for growth rate on SSC1, 2, 15 and 17 and for body composition traits on almost all autosomes except SSC3, 6, 8, 9 and 10.
QTL for stress hormone levels
Three QTL with significant effects on stress hormone levels were detected on SSC7, 10 and 13. The SSC7 QTL affected the cortisol level. Four F1 sires were found to be heterozygous, with positive effects of Duroc alleles in two families and negative effects in the remaining two sires. The two other QTL were located on SSC10 and 13 and affected the noradrenaline and adrenaline levels, respectively. For these QTL, three and two F1 boars, respectively, were heterozygous. Duroc alleles were associated with a lower level of noradrenaline for the SSC10 QTL, but led to higher adrenaline levels for the SSC13 QTL (Table 4).
QTL detected for stress hormone traits at the 5% chromosome-wide significant level

QTL = quantitative trait loci; LR = likelihood ratio.
aSee Table 1.
bNumber of heterozygous F1 sires.
cAverage allele substitution effect of heterozygous F1 sires: Large White–Duroc alleles in phenotypic standard deviation.
Discussion
The low number of heterozygous F1 Duroc × Large White sires might explain the relatively low number of genome-wide significant QTL in this study. For 44 out of the 56 identified QTL, only one to three F1 boars were found to be heterozygous.
Owing to the great number of QTL detection studies in pigs for production traits and to a lesser extent for meat quality traits (237 papers are referenced in the PigQTLdb from 1994 to 2009; Hu et al., Reference Hu, Fritz and Reecy2007), most of the effects we found confirmed QTL, which had previously been described in other populations. However, we have located QTL, which has not been previously reported in the literature. The QTL located on SSC5, acting on ultimate pH of longissimus dorsi, had never been previously described. In addition, four new QTL were identified in our population for production traits: two with effects on birth weight and two with effects on growth rates. The first QTL acting on birth weight was located in the IGF2 region of SSC2. The effects of the IGF2-intron3–G3072A mutation were reported on carcass leanness and backfat thickness in several studies (e.g. Jeon et al., Reference Jeon, Carlborg, Tornsten, Giuffra, Amarger, Chardon, Andersson-Eklund, Andersson, Hansson, Lundstrom and Andersson1999; Nezer et al., Reference Nezer, Moreau, Brouwers, Coppieters, Detilleux, Hanset, Karim, Kvasz, Leroy and Georges1999) and also on prolificacy in sows (Buys et al., Reference Buys, Van den Abeele, Stinckens, Deley and Georges2006), but no significant effects were previously described on birth weight. However, another QTL close to the IGF2 region and acting on birth weight has been previously suspected in a Pietrain × Large White cross (Sanchez et al., Reference Sanchez, Riquet, Billon, Iannuccelli, Gogué, Fève, Le Roy, Bidanel and Milan2006). We also identified a second QTL for birth weight on SSC10, the Large White allele being responsible for an increase or a decrease of birth weight depending on the family. For QTL acting on growth rates, the first one detected on SSC17 had an effect on the post-weaning growth rate, whereas the second one, detected on SSC15, had an effect on the fattening growth rate. Although these five QTL had moderate effects, from 0.16 to 0.26 ph s.d., depending on the sire–trait combination considered, they could be useful to improve meat quality and growth traits in commercial populations.
Very few programmes were conducted to detect QTL for stress hormone levels. Cortisol levels were measured in the French experimental F2 Meishan × Large White population and a QTL for cortisol level was detected at 139 cM on SSC7 by Désautés et al. (Reference Désautés, Bidanel, Milan, Iannuccelli, Amigues, Bourgeois, Caritez, Renard, Chevalet and Mormède2002). Later, Ousova et al. (Reference Ousova, Guyonnet-Dupérat, Iannuccelli, Bidanel, Milan, Genêt, Llamas, Yerle, Gellin, Chardon, Emptoz-Bonneton, Pugeat, Mormède and Moisan2004) found a QTL for the plasma concentration of cortisol-binding globulin (CBG) and showed that the CBG gene, located in this chromosomal region, was a strong candidate locus for this QTL. QTL for noradrenaline and adrenaline levels were, to our knowledge, searched for the first time in our study, and therefore, no QTL were previously detected for these traits.
In the region of the CBG gene, where a QTL was identified for the cortisol level, we did not find any significant effect on production or meat quality traits. In the French F2 Meishan × Large White population, significant effects of the CBG region were identified for both cortisol level and leanness traits (Désautés et al., Reference Désautés, Bidanel, Milan, Iannuccelli, Amigues, Bourgeois, Caritez, Renard, Chevalet and Mormède2002; Ousova et al., Reference Ousova, Guyonnet-Dupérat, Iannuccelli, Bidanel, Milan, Genêt, Llamas, Yerle, Gellin, Chardon, Emptoz-Bonneton, Pugeat, Mormède and Moisan2004). These results have not been confirmed in the F2 Duroc × Large White population. No pleiotropic effects of QTL for levels of catecholamines (noradrenaline and adrenaline) were found for meat quality traits, although some relationships may exist between these two kinds of traits. However, QTL acting on catecholamines also acted on some fatness or leanness traits. Nevertheless, the results we have obtained in the Duroc × Large White population should be considered with caution as less than 200 F2 animals were measured for stress hormone levels.
The fact that only one to five of the six F1 sires were heterozygous for each identified QTL means that all QTL are segregating in at least one of the founder populations we used in this study. In particular, the QTL identified in the p-terminal end of chromosome 2 could be the IGF2 mutation (Van Laere et al., Reference Van Laere, Nguyen, Braunschweig, Nezer, Collette, Moreau, Archibald, Haley, Buys, Tally, Andersson, Georges and Andersson2003; Markljung et al., Reference Markljung, Jiang, Jaffe, Mikkelsen, Wallerman, Larhammar, Zhang, Wang, Saenz-Vash, Gnirke, Lindroth, Barrés, Yan, Strömberg, De, Pontén, Lander, Carr, Zierath, Kullander, Wadelius, Lindblad-Toh, Andersson, Hjälm and Andersson2009), although the animals were not tested for this mutation. The non-mutated allele, which has undesirable effects on carcass composition, would thus be present at a non-negligible frequency in the Large White population. In the same way, when opposite effects were found for different boars, as was the case for most of the QTL, it means that both favourable and unfavourable alleles are segregating in each of the Large White and Duroc parental populations. These results, therefore, suggest that not only meat quality traits but also stress hormone levels and production traits could be improved by the use of molecular markers in purebred Duroc and Large White pigs. It is of particular interest for meat quality traits, which are difficult to include in classical selection programmes.
Conclusion
Numerous QTL were detected in the F2 Duroc × Large White population. The use of the Duroc and Large White populations led to the identification of QTL, which are segregating in commercial populations, and thus that could be directly included in breeding schemes. In order to select efficiently favourable alleles, the use of markers very close to the causal mutation is necessary. High-density single-nucleotide polymorphism markers could be very useful to refine the location of some QTL. It could be particularly interesting for meat quality traits, which are often difficult to assess in live animals.
Acknowledgements
This study was supported by the INRA programme ‘Biological characteristics and meat quality in pigs’ and by a grant from the Animal Genetics Department. The authors thank all INRA ‘pig meat quality’ group participants for the brainstorming, which contributed to the setting up of this experiment. Thanks are extended to the entire staff of the pig experimental unit in Le Magneraud for animal caretaking and all measurements. The authors would also like to mention Labogena (Jouy-en-Josas, Yvelines, France) and the CRGS platform of Toulouse Midi-Pyrénées Genopole® (Toulouse, Haute-Garonne, France) for their technical assistance in genotyping.