I. INTRODUCTION
Cellulose is one of the most abundant materials on earth, forming the building block of plants, algae, and some animal structures. Cellulose is a linear polymer, which has several hydroxyl groups on its surface. Existence of these hydroxyl groups results in formation of strong hydrogen bonds between neighboring cellulose molecules that form microfibrils a few hundred nanometers in diameter and several micrometers in length. These fibrils consist of both crystalline and amorphous regionsReference Beck-Candanedo, Roman and Gray1, Reference Bondeson, Mathew and Oksman2 and can be divided into much smaller features called cellulose nanocrystals (CNCs) via different mechanical (homogenization, grinding, and microfluidizationReference Turbark, Snyder and Sandberg3–Reference Zimmermann, Pöhler and Geiger5) or chemical treatments (most commonly sulfuric acid hydrolysisReference Azizi Samir, Alloin and Dufresne6).
Similar to other nanomaterials, CNCs have attractive properties such as a high surface-to-volume ratio, high aspect ratio [length (L) to diameter (D) ratio], and low density (1.566 g/cm3)Reference Azizi Samir, Alloin and Dufresne6 that make them favorable for application in polymer composites. Consequently, there are numerous reports in literature that show the reinforcing characteristics of these crystals in polymers.Reference Favier, Chanzy and Cavaille7–Reference Lapa, Suarez, Visconte and Nunes11 In composite materials, the properties of the interphase is dictated by transverse mechanical properties, size, and surface characteristics of the nanoreinforcement.Reference Liu and Brinson12, Reference Long and Lequeux13 Thus, to better understand the role of CNC in polymer composites and increase its potential to be used in industrial scales, it is necessary to study the CNC transverse elastic modulus and its dependence on CNC size.
Although the axial (along the axis) elastic modulus of CNCs from different sources has been under investigation for many years,Reference Meyer and Lotmar14–Reference Iwamoto, Kai, Isogai and Iwata26 there are not many reports on the transverse elastic modulus (perpendicular to major axis, E t) of these materials.Reference Jaswon, Gillis and Mark17, Reference Tashiro and Kobayashi21, Reference Lahiji, Xu, Reifenberger, Raman, Rudie and Moon27
In 1968, using theoretical modeling of cellulose I, Jaswon et al.Reference Jaswon, Gillis and Mark17 estimated values of 76 and 51 and 57 GPa for axial and two perpendicular transverse directions, respectively. Similarly, in 1991, Tashiro and KobayashiReference Tashiro and Kobayashi21 predicated elastic moduli of 167 and 11 and 50 GPa for axial and two transverse elastic moduli of cellulose crystals, respectively. This elastic modulus anisotropy has been associated with the cellulose chain anisotropy in CNC structure. Just recently, the first experimental data on characterization of the transverse elastic moduli of CNCs using atomic force microscopy (AFM) was published.Reference Lahiji, Xu, Reifenberger, Raman, Rudie and Moon27 Lahiji et al. used AFM measurements and a physics-based model and calculated E t = 18–50 GPa for wood-derived CNCs. The molecular structure of a low density polymer such as cellulose is the major reason for the high elastic modulus observed in CNCs. There are multiple hydroxyl groups on the cellulose chain. These can make inter- and intramolecular hydrogen bonds, which have a key role in the mechanics of this material.Reference Meyer and Lotmar14, Reference Sakurada, Nukushina and Ito15, Reference Lyons28–Reference Treloar30
In the current study, peak force tapping mode (PF-TM), a relatively new technique in AFM, was used to study the nanomechanical properties (AFM tip–CNC adhesion force) of single CNCs. The structural properties of crystals derived from two different sources (wood and cotton) were compared. Moreover, transverse elastic moduli of these CNCs were studied using nanoindentation module in AFM in combination with both analytical contact mechanics modeling and finite element analysis (FEA). Therefore, the effect of CNC source was investigated on their transverse elastic modulus as well as the accuracy of different approaches for calculation of E t could be examined by comparing the results with theoretically predicted values. Finally, the variation of adhesion forces and E t along the CNC axis and their dependency on CNC source and diameter were studied.
II. EXPERIMENTAL PROCEDURES
A. Materials
CNCs were prepared by acid hydrolysis of cellulose as described by Beck-Candanedo et al.Reference Beck-Candanedo, Roman and Gray1 Filter paper (Whatman No. 1; Whatman, Clifton, NJ) and commercially available microcrystalline cellulose (MCC) were used as the source of cotton CNCs and wood CNCs, respectively. For this purpose, cellulose source in powder was stirred with 65% H2SO4 (v/v) for 50 min at 45 °C. The cellulose-to-acid ratio was 1:10 g/mL. After the mixture was centrifuged five times, it was subjected to ultrasonication (Branson Sonifier; Branson, Danbury, CT) for 15 min to break agglomerations and evenly disperse CNCs in water. To remove remaining salts, ultrafiltration (UF) was done until the conductivity was <10 μS/c (Ultrasette tangential flow UF device, pore size = 50 nm; Pall Corp., Ann Harbor, MI). Finally, an aqueous suspension of 1% CNC was obtained by concentrating the dispersion of CNCs in a Rotavaporizer R110 (Buchi, Flawil, Switzerland).
The samples used for AFM (Bruker, Santa Barbara, CA) imaging were prepared by placing a few drops of CNC dilute solution onto a 1.5- × 1.5-cm2 of freshly cleaved mica. To get a better dispersion of crystals on the mica surface, samples were rinsed with deionized water and blown dry before the droplets were dry. After rinsing and blow-drying, the CNCs remaining on the mica surface were strongly adhered to the mica.
B. AFM measurements
Bruker’s Dimension Icon AFM (Bruker, Santa Barbara, CA) was used for imaging and nanoindentation tests in this work. The combined nanoindentation and AFM capabilities made it possible to find the sample of interest by imaging and then to perform the nanoindentation. AFM images were acquired using PF-TM.Reference Pittenger, Erina and Chanmin31 In this technique, the cantilever is not resonated. Here, using the main Z piezoelement, the vertical motion of the cantilever is oscillated below its resonant frequency and for each individual tap, nanoscale material property and peak force is collected (one force curve is collected for each pixel on the image). Each force–separation (F–h) curve is then analyzed to generate material property maps with the same resolution as the height image. These include Derjaguin–Muller–Toporov (DMT) modulus,Reference Derjaguin, Muller and Toropov32 adhesion, and deformation maps.
A silicon cantilever with a nominal spring constant of 20–80 N/m and tip radius of 5–12 nm was used for both imaging and indentation studies. The deflection sensitivity of the cantilever was measured by acquiring a force curve on a hard sapphire surface. This was repeated at least in five positions to make sure that the value was consistent (85.38 N/m). The spring constant was acquired equal to 24.7 N/m using the Sedar method.Reference Ohler33 The tip radius was measured using the relative method. This method involves scanning a standard sample (Poly Styrene), with a known elastic modulus, and altering the tip radius until the expected value (2.7 GPa) was obtained in the DMT modulus channel (tip radius for 2-nm deformation was equal to 5 nm). Finally, the Poisson’s ratio value of 0.3 was used for all samples. These settings were kept constant for all the subsequent measurements.
AFM images consisted of 512 × 512 pixels. Scanning rate was changed according to the scan size and was <1 Hz at all times. The peak force was set such that the resultant average deformation in each scan line was not more than 2 nm. Other scanning parameters, such as integral and proportional gains, were automatically set by the Nanoscope software.
Nanoindentation in AFM
A raw AFM force curve is a plot of the position of the piezo (z in nanometer) that runs the AFM versus the output voltage of the photodetector (delta, in V). To convert this to a more common force–displacement or force–indentation height (F–h) curve, deflection sensitivity is used to convert the units of delta to nanometer. Force (F) is then calculated in nanonewton by multiplying the deflection of the cantilever by its spring constant, k (F = k∆). Indentation height (h, value of deformation) is calculated by subtracting the cantilever deflection from the vertical piezo position (z). For each sample (cotton and wood CNCs), at least 10 measurements were made. Additionally, several measurements were conducted along the axis of each CNC to investigate the variation of E t. Maximum indentation of 2 nm was applied at each point and the corresponding force was measured. Nanoindetation frequency (which is related to the loading rate) was 1 Hz.
C. Calculation of CNC transverse elastic modulus
After F–h curves are acquired in AFM, they can be fitted by several models to estimate the transverse elastic modulus of CNCs (E t). Here, two different approaches namely analytical continuum contact mechanics modeling and FEA were used and the results were compared to theoretical estimated values for E t.
1. Analytical contact mechanics
Various contact mechanics models exist for calculating the elastic modulus from AFM nanoindentation data. These include Hertz,Reference Hertz34 Johnson–Kendall–Roberts,Reference Johnson, Kendall and Roberts35 and DMT.Reference Derjaguin, Muller and Toropov32 Hertz model assumes that the contact is initialized at a single point and deformation in the indentation area is perfectly elastic. Moreover, little or no adhesion exists between the tip and the sample (in comparison to the applied load), and the spherical tip end and planar film with infinite thickness. The Hertz model has often been applied to the loading curves from AFM nanoindentation experiments by compressing a polymer material between AFM tip and planar substrates.Reference Domke and Radmacher36, Reference Tan, Sherman and Ford37 Based on the Hertz model, contact radius (a) and sample deformation or indentation depth (h) are:

and

where, R, F, and E red are tip radius, applied force, and reduced elastic modulus, respectively. Combining Eqs. (1) and (2) gives Eq. (3), which relates the indentation depth to the applied force:

where υ s and υ tip are the Poisson’s ratio of the sample and the tip, respectively:
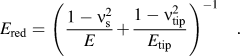
By assuming an infinite elastic modulus for the tip (E tip), E red is equal to the Young’s modulus of the sample (E) with a good approximation. In this work, the Hertz model [Eq. (3)] was applied to F–h curves, and the resultant elastic moduli were compared to the elastic moduli obtained from FEA. Hertz model has been used in similar cases, where one-dimensional materials (such as multiwalled carbon nanotubesReference Palaci, Fedrigo, Brune, Klinke, Chen and Riedo38 and viral nanotubesReference Zhao, Ge and Fang39) were placed on a substrate and indented by an AFM tip.
Application of the Hertz model is valid only if there is no adhesion between the tip and the samples. To satisfy this condition, relatively high spring constant cantilevers were selected, which helped to minimize the adhesion forces. Another important assumption in the Hertz model is that the contact radius (a) should be small in comparison to the tip radius (R). This assumption is satisfied due to the small indentation depths (2 nm) in the current study.Reference Chizhik, Huang, Gorbunov, Myshkin and Tsukruk40, Reference Tsukruk, Huang, Chizhik and Gorbunov41
It is worth mentioning that, in many cases use of Oliver–Pharr method has been proposed for analysis of nanoindentation data.Reference Feng, Yoon and Lee42 Although this method is very useful, it has been shown by several researchersReference Tranchida, Piccarolo and Soliman43 that application of this method is not appropriate for polymer materials due to their viscoelasticity.
2. Finite element analysis
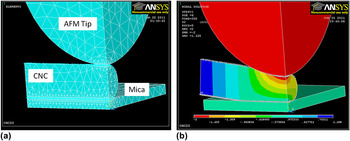
The elastic modulus was also estimated by tuning the theoretical elastic modulus value in the FEA model to match the theoretical prediction with experimental data. A three-dimensional (3D) quarter symmetry model containing approximately 13,000 elements was created in ANSYS (ANSYS Inc., Houston, TX). As shown in Fig. 1, a CNC was modeled as a solid cylinder with a 7-nm diameter; the AFM tip was modeled as a rigid sphere with 20-nm radius; and the substrate was modeled as a rigid block with properties of mica. It was assumed that the CNC, AFM tip, and substrate have isotropic mechanical properties. The AFM tip radius is larger than what was measured during calibration steps to account for the tip blunting.
Three-dimensional quarter symmetry model in finite element analysis (FEA); (a) shows the elements and finer mesh at the contact regions at cellulose nanocrystal (CNC)–atomic force microscope (AFM) tip and CNC–mica interfaces and (b) shows the deformation along the vertical axis at maximum indentation. The color contour in (b) represents the amount of deformation in the model, which varied from −2 nm (red) to 1.1 nm (dark blue). (color online)

Ten-node and 3D tetrahedral elements were selected for this model, and the mesh was refined where CNC contacted the substrate or the AFM tip. Two contact pairs, one between CNC and the mica and one between CNC and the AFM tip, were defined. To generate a stable model, vertical displacements equal to indentation height were applied to the nodes in the AFM tip. Additionally, all other degrees of freedom of the substrate were considered to be fixed. The deformation was applied to CNC by increasing the vertical displacement of the tip gradually until it reached the maximum value of −2 nm. Figure 1(b) represents the deformed shape of CNC and the amount of deformation in CNC, AFM tip, and mica. After the model was solved, the force was plotted as a function of displacement (indentation height) at the contact area between CNC and the AFM tip. This was repeated multiple times, while all parameters were kept constant except for the elastic modulus of the CNC.
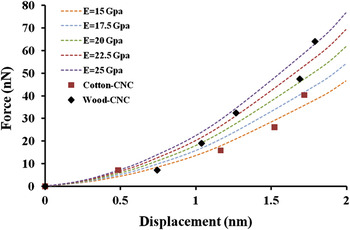
Figure 2 shows two representative F–h curves on a wood CNC (diameter equal to 3.1 nm) and a cotton CNC (diameter equal to 6.4 nm). It also includes several curves, with varying elastic modulus, obtained from FEA. Using this approach, the theoretical curve that could fit the experimental data with the least error was obtained for each AFM F–h curve. It is worth mentioning that the FEA model was solved with the assumption of perfect contact between CNC and the tip and at the central point on the CNC. For this reason, only F–h curves that were measured along the center of CNCs were selected for these calculations.
F–h curves on a wood CNC with diameter equal to 3.1 nm (black diamonds) and cotton CNC with diameter equal to 6.4 nm (red squares) along with fit curves with varying elastic moduli obtained from FEA. (color online)

III. RESULTS AND DISCUSSIONS
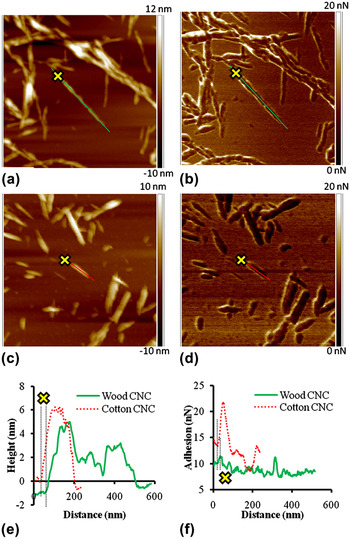
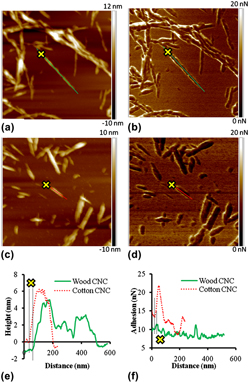
Figures 3(a)–3(d) depicts the topography and adhesion maps of representative wood CNC [Figs. 3(a) and 3(b)] and cotton CNC [Figs. 3(c) and 3(d)] obtained using PF-TM. Graphs in Fig. 3(e) show the change in CNCs’ height along their axes. These graphs were acquired by drawing a profile line on the height images [as shown in Figs. 3(a) and 3(c)].
1- × 1-μm2 (a, c) topography and (b, d) adhesion maps of (a, b) wood and (c, d) cotton CNCs. The topography (e) and adhesion (f) profiles were obtained along the lines shown on AFM maps. Dotted red lines and solid green lines correspond to cotton and wood CNCs, respectively. Yellow crosses show the direction of the profile lines. (color online)

As summarized in Table I, wood CNCs were longer (310 ± 45 nm) and had smaller diameter (4.2 ± 1.2 nm) in comparison to the cotton CNCs (length and diameter were 166 ± 34 and 5.9 ± 1 nm, respectively). These dimensions correlate well with previously published reportsReference Habibi, Lucia and Rojas44 and show that the acid hydrolysis of commercially available MCC resulted in higher aspect ratio CNCs. Usually, acid hydrolysis of native cellulose causes a reduction in the degree of polymerization to the so-called level-off degree of polymerization (LODP).Reference Battista, Coppick, Howsmon, Morehead and Sisson45 LODP has been shown to correlate well with the periodic crystal sizes along cellulose chains and, consequently, the length of CNCs after acid hydrolysis.Reference Habibi, Lucia and Rojas44, Reference Yachi, Hayashi, Takai and Shimizu46 In addition, the diameter of a CNC along its axis was not constant and typically underwent a 2- to 3-nm change. This is also consistent with previously reported data.Reference Bondeson, Mathew and Oksman2, Reference Azizi Samir, Alloin and Dufresne6
Summary of the atomic force microscopy measurements on individual cellulose nanocrystals (CNCs).

The adhesion maps demonstrate the amount of adhesion force (nN) between the AFM tip and the sample. For the measurements performed on cotton CNC samples, the adhesion was 9.2 ± 0.8 and 10.5 ± 1.1 nN on CNC and mica, respectively. For the measurements performed on wood CNC samples, the adhesion was 11.5 ± 1.2 and 13.3 ± 2.1 nN on CNC and mica, respectively. Here, several mechanisms can result in the contrast between mica and CNC including meniscus, contact geometry, and surface energy effects, as well as nanomechanical properties. In the current study, since the experiments were performed at ambient relative humidity, the meniscus effect (caused by water condensing at the contact region) can have a relatively high effect on the adhesion forces between AFM tip and CNC or mica. On the other hand, the elastic modulus of mica (∼170 GPaReference McNeil and Grimsditch47) is much higher than the expected transverse elastic moduli for CNCs (11–57 GPaReference Jaswon, Gillis and Mark17, Reference Tashiro and Kobayashi21). As a result, the amount of deformation generated by the same AFM tip force will be much less on a mica surface compared to CNC. Thus, the AFM tip–sample contact region is smaller on mica. Thus, less force will be needed to separate the tip from the surface. This means that, besides the differences in surface energy and contact geometry,Reference Lahiji, Xu, Reifenberger, Raman, Rudie and Moon27 the difference in hydrophilicity and mechanical properties of CNC and mica can result in the contrast observed in the adhesion images.
In addition, the adhesion forces measured on cotton CNC samples were higher compared to wood CNCs [Fig. 3(f)]. Since both cotton and wood samples were prepared using similar acid hydrolysis procedures and AFM PF-TM experiments were conducted in similar conditions, among the mechanisms mentioned above, the difference in mechanical properties of these crystals along their axes and with each other appears to be the only reason for such observations. This will be discussed further in the subsequent paragraphs.
Table I also presents the E t calculations completed using two different methods (Hertz contact mechanics and finite element). To follow the assumptions as close as possible, only experimental data obtained on the center line of CNCs was used for curve fitting. One should keep in mind that relating E t measured in the current study to a specific crystallographic orientation in CNCs (E t1 and E t2) is difficult because such orientation is not known when CNCs are placed on the mica surface. The fact that these orientations also depend on the shape of CNC after acid hydrolysis (that results in different planes exposed on the surface) makes this task even more challenging. When considering the values reported here, one should also remember that both Hertz and FEA models are for isotropic materials and were used to calculate an anisotropic material property here.
In average, the E t values calculated using the Hertz model were lower in comparison to the E t values calculated by the FEA method. The E t values calculated using FEA (24.8 ± 7.0 and 17.7 ± 5.0 GPa for wood and cotton CNCs, respectively) were much closer to the previously reported experimental dataReference Lahiji, Xu, Reifenberger, Raman, Rudie and Moon27 and theoretically estimated values.Reference Jaswon, Gillis and Mark17, Reference Tashiro and Kobayashi21 This is because the Hertz model is not accurate at low forces and when adhesion forces are present. In addition, as compared to FEA (spherical rod contact geometry), the real contact geometry in AFM experiments is reduced to a simpler spherical plane geometry in the Hertz model. Also, the effect of the substrate is taken into consideration in the FEA model, whereas it is neglected in the Hertz model. All these factors have a substantial effect on the E t calculations. For this reason, further analyses were conducted only on calculations based on AFM data and FEA models.
At this point, it is worth mentioning that the mechanical properties of CNC and mica are known to be anisotropic. AFM force–displacement curves in this study were obtained by applying a vertical force in direction of CNC diameter (transverse direction). As a result, the AFM F–h curves have captured the natural properties of CNCs and include the anisotropicity. Next, the FEA model was tuned to best fit this experimental data. Therefore, the values predicted by the FEA model are transverse elastic moduli of CNC samples, which as discussed above, match perfectly by previously reported values (experimental and theoretical). On the other hand, the elastic modulus of CNCs in axial directionReference Meyer and Lotmar14–Reference Lahiji, Xu, Reifenberger, Raman, Rudie and Moon27 is different and much higher than the ones reported here.
Note that the scatter in E t (shown by the standard deviations in Table I) can have several reasons, including: (i) indentation location uncertainty: not all the times did the AFM tip land on the highest point on CNC axis, and this can have great influence on the F–h curves obtained and (ii) change of tip radius with its roughness: if the roughness of the tip changes (due to inelastic deformations of tip asperities that occur during indentation), the effective tip radius forming the indentation changes, this can lead in uncertainty in load measurements.
Another interesting observation is that CNCs obtained from acid hydrolysis of wood have higher elastic moduli compared to those obtained from cotton (Table I). The reason for such observation can be explained by the difference in crystallinity of these CNCs. It has been shown that wood-based cellulose has a higher degree of crystallinity (77%) compared to cotton cellulose (71%).Reference Ioelovich, Leykin and Fogovsky48 On the other hand, the dependence of elastic modulus on the degree of crystallinity has been modeled by considering the samples as a composite consisting of crystalline and amorphous domains. These crystals can be either in a parallel or series arrangement,Reference Harris49, Reference Eichhorn and Young50 and the elastic moduli (E parallel and E series) can be calculated based on equations listed below:

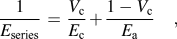
where E c and E a are elastic moduli of the crystalline and amorphous regions, and V c is the volume fraction of crystals in the material. Using either of the equations, it is clear that the elastic modulus increases with degree of crystallinity, thus it is expected that wood CNCs have higher E t compared to cotton CNCs.
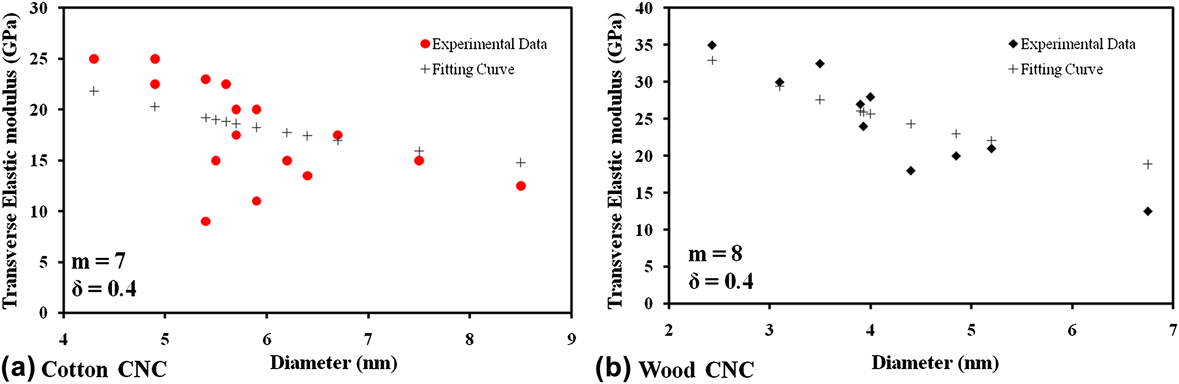
To study the size-scale effect on the mechanical properties of these crystals, the transverse elastic modulus was plotted against the diameter of various CNCs (Fig. 4). Black diamonds and red circles in Fig. 4 correspond to wood and cotton CNCs, respectively. In general, wood CNCs had higher transverse elastic moduli. More importantly, for both CNCs, the elastic modulus increases as the diameter decreases (size-scale effect). Similar behavior was observed on the adhesion force measurements.
Change in E t (calculated using FEA) with the CNC diameter (a) cotton CNCs (red circles and black crosses show the experimental data and the fitted curve, respectively) and (b) wood CNCs (black diamonds and black crosses show the experimental data and the fitted curve, respectively). The trend fitted curves clearly show that as the CNC diameter decreases, E t increases. m and δ resulted from fitting are shown on the graphs. (color online)
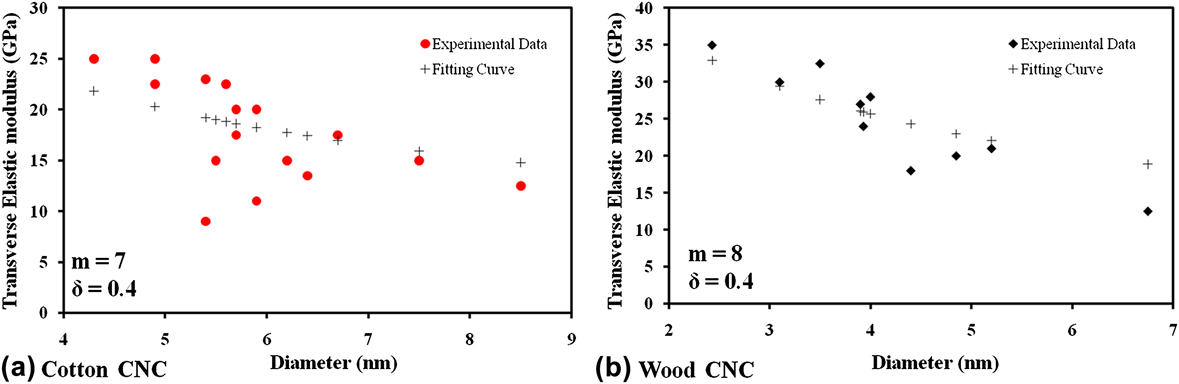
To the best of authors’ knowledge, size-scale effect on mechanical properties of CNCs has never been reported for CNCs. Several reasons can be behind such behavior in CNCs. Firstly, it can be correlated to the crystalline structures of CNCs and their relationship with the CNC diameter. Back in 1984, Atalla and VanderHartReference Atalla and VanderHart51 identified two allomorphs of native cellulose I (Iα and Iβ) using nuclear magnetic resonance spectroscopy. The major difference between these two structures is how the consecutive hydrogen-bonded planes are arranged on top of each other. Although I α has one-chain triclinic unit cells, I β consists of two-chain monoclinic unit cells. Both allomorphs are present in most kinds of natural cellulose, but I α is dominant in bacterial and algae cellulose and I β is dominant in higher plants such as cotton and wood.Reference Roman and Winter52 One other difference between these two allomorphs is their chain stiffness. At the equilibrium c-spacing and when hydrogen bonding is present, it has been shown that the chain stiffness is always higher for Iα (136–149 GPa)Reference Nishiyama, Sugiyama, Chanzy and Langan53, Reference Aabloo and French54 compared to Iβ (109–116 GPa).Reference Nishiyama, Langan and Chanzy55, Reference Finkenstadt and Millane56
As the CNC diameter decreases, its surface-to-volume ratio increases. Molecular chains at the surface layers should, in principal, be at a higher energy level compared to those at the core of CNC. Thermodynamically, there will be more likelihood for a metastable Iα crystalline phase to exist on the CNC surface. In fact, Iα has higher potential energy and lower density compared to Iβ.Reference Nishiyama, Langan and Chanzy55, Reference Kovalenko57 Dominance of Iα allomorph has been previously shown on the surface of cellulose crystals.Reference Baker, Helbert, Sugiyama and Miles58, Reference Malm, Bulone, Wickholm, Larsson and Iversen59 Thus, with decrease in diameter, I α/I β ratio can increase in CNCs. Since Iα has a higher elastic modulus compared to Iβ, smaller CNCs that have larger amount of Iα are expected to have higher elastic moduli.
To further quantify this hypothesis, the experimental data was fitted to a core–shell modelReference Zheng, Cao, Li, Feng and Wang60 as shown in Fig. 4. According to this model, CNC (with diameter D) is composed of a core and a shell (thickness of the shell is equal to δ). The elastic modulus of the whole CNC (E) can be correlated to the elastic moduli of the core (E c) and the surface (E s):

where s is a geometrical parameter and for circular cross section it is equal to 4δ/D, and m is the modulus ratio (m = E s/E c). Here m >1 and m <1 correspond to a surface layer stiffer and softer than the core, respectively, and m = 1 indicates that the surface layer has the same properties as the core. In this study, m was equal to 7 and 8 for cotton and wood CNCs, respectively (Fig. 4). This strengthens the assumption of higher elastic modulus on the surface of CNCs and consequently existence of size-scale effect in these materials.
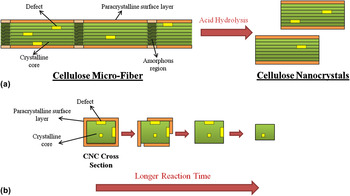
Another reason for CNCs to have higher elastic moduli at smaller diameters can be related to the state of structural defects and size-dependent crystallinity in the material. It can be assumed that the smaller CNCs have a higher degree of crystallinity and therefore fewer molecular defects. The size and crystallinity variations, on the other hand, depend on the CNC preparation process (acid hydrolysis).Reference Beck-Candanedo, Roman and Gray1 It has been shown that cellulose microfibers consist of a crystalline core, amorphous domains, and a paracrystalline surface [Fig. 5(a)].Reference Ioelovich, Leykin and Fogovsky48 The amorphous and defective regions in these fibers, which have faster kinematics,Reference Beck-Candanedo, Roman and Gray1 are mostly destroyed during strong acid hydrolysis [Fig. 5(a)].Reference Battista61–Reference Habibi, Goffin, Schiltz, Duquesne, Dubois and Dufresne63 During hydrolysis reactions, acids attack firstly the polycrystalline and then the crystalline core of cellulose [Fig. 5(b)].Reference Habibi, Lucia and Rojas44 Thus, longer reactions result in CNCs with higher crystallinity. This means that, when comparing CNCs with different sizes from a similar source, there is more crystallinity and fewer defects in smaller CNCs and this can explain the higher elastic moduli in smaller size CNCs.
(a) Schematic of crystal structure of cellulose along the fiber. Light and dark green correspond to crystalline and amorphous areas in cellulose, and orange represents the polycrystalline surface layer. Structural defects are shown by small yellow rectangles. During acid hydrolysis, amorphous regions are removed and CNCs are extracted. (b) Change in cross section of a CNC as the hydrolysis exposure increases. At longer reaction time, acid protons attack the polycrystalline surface and crystalline core of CNC and resultant crystals will have smaller diameter and fewer defects in their structure. (color online)

The size-scale effect has been previously reported for polymeric nanomaterials using both experimental and theoretical approaches.Reference Tan and Lim64–Reference Sun, Han, Wang and Lim67 Using AFM, the size scale has been related to the shearing of fibrils within nanofibers in poly(L-lactic acid) nanofibers.Reference Tan and Lim64 Similarly, a three-point bending test in AFM has shown this effect in electroactive polymer nanofibers and was correlated it to the orientation of polymer molecules during electrospinning.Reference Tan and Lim64 Surface elasticity and surface stresses have been used to explain this phenomenon as well. For instance, Curgul et al.,Reference Curgul, VanVliet and Rutledge66 using molecular dynamics simulations, showed that significant perturbed molecular confirmations occurred at the surface of polyethylene compared to its core. Sun et al.Reference Sun, Han, Wang and Lim67 used a strain gradient theory to predict the size-scale effect in polycaprolactone nanofibers and polypyrrole nanotubes.
The size-scale effect in CNCs can have a substantial role in the engineering of the mechanical properties of functional CNC-based biomaterials. For instance, it has been observed that the behavior of osteoblast cells can be regulated by the mechanical properties of the bone scaffolds.Reference Khatiwala, Peyton and Putnam68 It appears that the control over the size distribution of CNCs can be used to design more effective biomedical implants or tissue replacements.
IV. CONCLUSIONS
Acid hydrolysis was used to prepare CNCs from two different sources, namely wood and cotton. It was shown that wood CNCs had higher length and smaller diameter compared to cotton CNCs. Nanoindentation was combined with analytical contact mechanics modeling (Hertz model) and FEA to estimate the transverse elastic moduli (E t) of CNCs. It was also observed that the FEA modeling calculated the E t values more closely to the theoretically predictions. The E t for wood and cotton CNCs were estimated to be 24.8 ± 7.0 and 17.7 ± 5.0 GPa, respectively. The difference in E t for CNCs from different sources was correlated to the difference between their degrees of crystallinity and diameters. More importantly, it was observed that E t increased when CNC diameter decreased. Such behavior was explained by the increase of Iα (more rigid and metastable) portion in CNC crystal structure and reduction in structural defects.
ACKNOWLEDGMENTS
The authors acknowledge the National Science Foundation for the Grant No. 0820884 from the Division of Materials Research (DMR) and the Grant No. 11000806/1100572 from DMR and Civil, Mechanical, and Manufacturing Innovation (CMMI) divisions.