INTRODUCTION
The effect of continuous acceleration (runaway) of electrons in plasmas and gas-discharge gaps has been investigated for five decades (Dreicer, Reference Dreicer1959; Gurevich, Reference Gurevich1960). However, for an air gap with a highly nonuniform field only recently, with the advent of modern broadband instrumentation, it has been demonstrated experimentally (Mesyats et al., Reference Mesyats, Korovin, Sharypov, Shpak, Shunaillov and Yalandin2006, Reference Mesyats, Yalandin, Sharypov, Shpak and Shunailov2008a, Reference Mesyats, Shpak, Shunailov and Yalandin2008b) that the flow of runaway electrons (RE) is injected from the near-cathode region within the sub-nanosecond rise time of the accelerating pulse, it has a picosecond duration (less than 50 ps FWHM), and is not formed during the discharge, but, on the contrary, initiates the latter.
The problem of the presence of particles of anomalously high energy in the beams of RE has been of special interest in the investigations (see, e.g., Babich et al., Reference Babich, Loiko and Tsukerman1990; Baksht et al., Reference Baksht, Burachenko, Kozyrev, Kostyrya, Lomaev, Petin, Rybka, Tarasenko and Shljakhtun2009 and the cited literature). By the existing definition, anomalous energies are the energies that cannot be gained by accelerating particles at a maximum cathode voltage. This formulation conceptually implies that the amplitude of the voltage pulse and the shape of its front at the emissive surface of the cathode should be known exactly. Moreover, in experiments with picosecond resolution, it is necessary to determine precisely the time and voltage ranges in which the injection of REs begins and stops within the rise time of the accelerating pulse. Only knowing the mentioned parameters, we can adequately discuss the anomalies of the RE energy spectrum.
Unfortunately, the authors of above cited papers (Babich et al., Reference Babich, Loiko and Tsukerman1990; Baksht et al., Reference Baksht, Burachenko, Kozyrev, Kostyrya, Lomaev, Petin, Rybka, Tarasenko and Shljakhtun2009), in their numerous publications, give limited information relevant to the problem under consideration or the data reported are inadequately substantiated by the description of the methods, instrumentation, and measuring procedures used. This can be accounted for by a variety of reasons. It was practically impossible to obtain experimental data with necessary time resolution at the time when the investigations described in the review (Babich et al., Reference Babich, Loiko and Tsukerman1990) were carried out. At that time electron-beam tubes of the best domestic analog oscilloscopes of the SRG series (5–7 GHz bandwidth) did not provide picosecond resolution, which is now attainable with modern digital oscilloscopes. Besides, even the wide-band of analog recorders was substantially limited due to the necessity to use cable signal delay lines. Therefore, the efforts of experimenters who investigated effects that take place within the time range lying far beyond the transmission band of the instrumentation are worthy of respect. On the contrary, as to the work of Baksht et al. (Reference Baksht, Burachenko, Kozyrev, Kostyrya, Lomaev, Petin, Rybka, Tarasenko and Shljakhtun2009) that has been performed in the recent years with the use of modern measuring techniques, it is difficult to comprehend why only the data on the breakdown voltage of the spark gaps of the high-voltage generators (Zagulov et al., Reference Zagulov, Kotov, Shpak, Yurike and Yalandin1989) used in their experiments are reported instead of the pulse parameters immediately at the cathode. Besides, the significant variance in measurable was ignored in the overwhelming majority of cases, although it is clear that this could lead to incorrect conclusions in reconstructing the energy spectra of electron beams from the particle absorption curves of the foil filters. In our opinion, the circumstances above usually gave cause for the discussion of the anomalous energies of accelerated electrons that are observed both in gas-filled and in vacuum diodes. As a result, some theoretical considerations (e.g., Yakovlenko, Reference Yakovlenko2006) were not based on reliable experimental data.
The goal of the present work was by no means the revision of the experiments that have been performed previously by other researchers. Our task was to demonstrate the conclusions that can be made if the experimental approaches, measuring procedures and techniques used are adequate to the problem under investigation.
EXPERIMENTAL APPROACHES
To detect RE of “anomalous” energy, it was necessary to provide conditions under which the beam particles would be injected at amplitude value of pulsed cathode voltage.Footnote 1 Only in this mode, it has sense to determine the upper energy limit by the method of filters. Besides, complexity concerned the essential impossibility to have a couple of gages which would provide an absolute mutual picosecond lock-on between the recorded RE beam current pulse and the accelerating voltage pulse at the cathode, because the voltage gage and the current gage are located at different places, and the voltage probe (capacitive divider) cannot be placed immediately at the emitter. We already discussed this previously (Yalandin et al., Reference Yalandin, Reutova, Sharypov, Shpak, Shunailov and Mesyats2010b). Therefore, the accelerating pulse was initially chosen to have an amplitude margin (V max), so that all REs were certainly injected and accelerated within the voltage rise time. The time at which the RE injection ceased and the corresponding voltage (V off) (see Experiment 1) could be preliminarily estimated from time-of-flight measurements of the particle energy (Mesyats et al., Reference Mesyats, Shpak, Shunailov and Yalandin2008b) or, as it was done in the present work, by using a simple “statistical” technique (Yalandin et al., Reference Yalandin, Reutova, Sharypov, Shpak, Shunailov and Mesyats2010b). Thereafter, the voltage amplitude was gradually decreased from V max to V off. It is due to the opportunity to smoothly control the output voltage of the RADAN sub-nanosecond generators (Yalandin & Spak, Reference Yalandin and Shpak2001; Mesyats et al., Reference Mesyats, Korovin, Rostov, Shpak and Yalandin2004) that in the experiments under consideration could be realized. The RE current was measured with the use of a filter of fixed thickness that transmitted particles whose energy was greater than or equal to the energy that could be provided by their acceleration at a voltage at which RE acceleration stopped, V off (Experiment 2). Certainly, it would be correct to speak about the presence or absence of particles of anomalous energy in this experiment only when the voltage of the capacitive divider (Figs. 1 and 2a) would have been translated into the voltage pulse amplitude at the cathode emission surface (Fig. 2b) corresponding to no-load conditions. This is a principal issue, as the amplitude of a sub-nanosecond accelerating pulse at the cathode under no-load conditions differs from the double amplitude of the pulse recorded with the voltage gage located at a distance from the cathode. Moreover, the leading edge of the accelerating pulse is deformed as the latter is transferred from the gage to the cathode, and the coefficients of these transformations vary on varying the amplitude and duration of the pulses shown in Figure 2a.
Experimental arrangement: (1) cathode, (2) anode (grid with a foil filter), (3) screening foil, (4) current gage collector, (5) bushing insulator, and (6) capacitive voltage divider.

The generator voltage pulse of varied amplitude in a long homogeneous transmission line picked up at the capacitive voltage divider without reflections (a); the voltage divider pulse of maximum amplitude −228 kV (V 0) and the same pulse (V max) “delivered” to the cathode under no-load conditions (numerical simulation); V 1 represents the V 0 pulse whose amplitude was normalized by V max (b).

The measurements of the cut-off energy of accelerated particles in Experiment 2 made it possible to judge on the presence of anomalies, that is, on the events where the particle energy was over eV off. In a simultaneous numerical experiment, which was performed by using the KARAT code (Tarakanov, Reference Tarakanov1992) based on the particle-in-cell method, the voltage was determined at which an electron should start within the rise time of a pulse of amplitude V off to gain the maximum energy that was measured by using an absorbing filter. As a result, the upper limit of RE injection voltages (V real ≤ V off) was estimated more precisely than this could be done by the methods described earlier (Mesyats et al., Reference Mesyats, Shpak, Shunailov and Yalandin2008b; Yalandin et al., Reference Yalandin, Reutova, Sharypov, Shpak, Shunailov and Mesyats2010b). To check whether V real was determined correctly enough, it was estimated additionally on increasing the voltage amplitude from V off to V max (Experiments 3 and 4). In doing this, the maximum RE energy should increase due to the increase in voltage rise rate (Fig. 2a). This variation of the RE energy was kept track by full current cut-off by filters of varied thickness and compared with the energy calculated for trial particles started within the rise time at a fixed voltage V real.
If filters were not used (Experiment 5), the lower threshold voltage for RE injection, V start, could be determined by gradually reducing the pulse amplitude from V off: (V start < V real < V off). As a result, the critical electric field at which low-energy electrons went into the mode of continuous acceleration (runaway) was estimated for the cathode potential V start. Besides, by the known V start and V real the full duration of the RE beam at the start of the particles from the near-cathode region was determined, and the calculation gave an idea of the degree of the beam space-time compression after its acceleration and during the drift downstream of the anode.
Note that almost all of the above-mentioned stages of experiments and calculations were duplicated for the case where the cathode-anode separation of the discharge gap (Fig. 1) was increased by a factor of 2.5. In this case, the predicted limiting RE energies was compared with those obtained experimentally.
EXPERIMENTAL SETUP
Experiments were carried out on a picosecond high-voltage setup, whose operation principle and capabilities are described in detail elsewhere (Mesyats et al., Reference Mesyats, Korovin, Sharypov, Shpak, Shunaillov and Yalandin2006, Reference Mesyats, Yalandin, Sharypov, Shpak and Shunailov2008a, Reference Mesyats, Shpak, Shunailov and Yalandin2008b; Yalandin et al., Reference Yalandin, Reutova, Sharypov, Shpak, Shunailov and Mesyats2010b). No focusing longitudinal magnetic field was applied. The geometry of the air-filled diode and of the supply transmission line with a voltage divider (see Fig. 1) was the same as in the experiment (Yalandin et al., Reference Yalandin, Reutova, Sharypov, Shpak, Shunailov and Mesyats2010b) except for a different thickness of the edge of the tubular graphite cathode of diameter 6 mm. The gap between the cathode and the plane anode in the first series of measurements was 8 mm. The anode was a steel grid (12X18H10T; 30-μm dia wire; ~50% geometric transparency). The grid also protected the filter from the discharge that occurred in the gap upon the passage of the RE beam (Sharypov et al., Reference Sharypov, Shpak, Shunailov and Yalandin2008; Mesyats & Yalandin, Reference Mesyats and Yalandin2009). The filter was a stack of 15-μm thick aluminum foils. The stack thickness was controlled to within 1 µm. The stacked foils were clamped around the edges with a special holder whose straight-through aperture was 15 mm in diameter.
A collector gage with a sensitivity of 17.24 V/A with a transient response of no worse than 30 ps were used for measuring the RE beam current (Reutova et al., Reference Reutova, Sharypov, Shpak, Shunailov and Yalandin2008; Yalandin et al., Reference Yalandin, Reutova, Sharypov, Shpak, Shunailov, UImasculov, Rostov and Mesyats2010a). The gage signals of ~50 ps FWHM were transferred to a Tektronix TDS6154C real-time digital oscilloscope (15 GHz; 40 Gs/s, 28 ps transient response). The zero-line irremovable noise at the highest sensitivity of this device was at a level of ~5 mV. Thus, in the signals accumulation mode, the oscilloscope could certainly fix the presence of voltage pulses of minimum amplitude (5–10 mV). When the RE beam current passed through the gage aperture of diameter 9.5 mm attained 1–1.5 A (in this case, the gage signal was 17–26 V), the beam current record range was as high as 5 × 10³. This was somewhat greater than 104, the value attained in the case where reference oscillograms of signals of few millivolts were recorded at a maximum sensitivity in the averaging mode (over 50 pulses in the present experiments) and the noise was leveled. Noteworthy was low-jitter and stable start-up of the oscilloscope.
In all measurements, the current gage collector was screened with a 15-μm thick aluminum foil membrane. According to the data on the mean free path of monoenergetic electrons in aluminum (Baranov, Reference Baranov1974), this additional filter allowed the gage to detect particles of energy above 40 keV. Electrons with this energy have the mean free path in nitrogen more than 25 mm, and therefore they could pass through the 6-mm air gap between the anode foil and the screening membrane of the gage with insignificant losses. Thus, 40 keV can be considered the lower sensitivity limit for the electron energies measured in the experiments under consideration.
Note that the use of a current gage with an unscreened collector can result in uncontrollable variations in amplitude-time characteristics of the output signals. This is related, first, to a mismatch between the receiving (collector) section and the coaxial transmitting duct of the current gage. We have demonstrated this in detail in our previous work (Reutova et al., Reference Reutova, Sharypov, Shpak, Shunailov and Yalandin2008). Second, the unscreened collector located some distance from the anode foil can detect, along with current (like an antenna), the ultra wide-band signal that arises on injection of an electron beam with a picosecond leading edge through the anode foil. Note that in this case, we deal not with the electromagnetic pulse of the delayed discharge current that induces interference through the grid anode (Babich & Loiko, Reference Babich and Loiko2010).
It is necessary to note a feature of the configuration and arrangement of the cut-off filter. It was revealed that when a filter stacked of poorly compressed foils simultaneously served as the screen of the beam collector, a signal of unpredictable amplitude arose at the gage output. A probable reason for this is an induced electromagnetic and/or current pulse with a picosecond rise time, causing sparking between the foils of this type of filter. In particular, even a filter stack of total thickness 1200 µm (~0.7 MeV cut-off energy) incompletely eliminated the current gage signal. It is quite clear that this signal could be erroneously interpreted as produced by “anomalous” electrons whose energy was significantly greater than the energy that would be provided even by the maximum accelerating voltage (Fig. 2b). However, this “current signal of tens of milliamperes” completely disappeared as the filter foils were stacked tightly to ensure reliable contact. Certainly, good contact with the grounded case of the current gage was easier to provide when a thin single-layer foil screen was used. For this reason, the functions of the screen and the filter were separated, and the filter was combined with the flat anode of the accelerating gap and was placed just behind the grid, as shown in Figure 1.
A separate problem was to determine the actual parameters of the accelerating voltage pulse at the cathode. As mentioned, even the voltage divider (see Fig. 1) with a transient response better than 100 ps placed in a long homogeneous transmission line does not provide reliable data. Actually, for a pulse with a sub-nanosecond rise time even the bushing insulator section is a substantial inhomogeneity. Energy can be accumulated in this section of the duct due to multiple reflections in the ring circuits between distributed and discrete inhomogeneities (jumps of the insulation dielectric constant and of the line impedance). In the traveling wave mode, this stored energy will also be delivered to the cathode edge with a delay and extension in time, thus noticeably distorting the leading edge of the accelerating pulse (Morugin & Glebovitch, Reference Morugin and Glebovitch1964). The leading edge is additionally distorted because of the charging of the cathode-anode capacitance, and this implies that the field distribution in the electrode gap becomes predictable within a finite time. As we analyze injection processes within the pulse rise time (up to its peak), it makes no sense to speak of a stationary distribution of the accelerating potential at all. Thus, it is absolutely incorrect to obtain information on the amplitude of a no-load voltage pulse and on the shape of its leading edge at the cathode by merely extending twice in amplitude the waveforms taken off the voltage divider (Fig. 2a).
As the voltage divider cannot be placed immediately in the cathode region, in solving the problem one must take into account all distortions that arise in transferring the pulse detected by the divider (see Fig. 2a) to the cathode. This problem can be solved by numerical simulation (see Fig. 2b), and to do this, we conventionally apply KARAT, a completely electromagnetic code (Tarakanov, Reference Tarakanov1992). The model used correctly describes the actual geometry of the entire system (see Fig. 1) from the output section of the homogeneous transmission line to the point where the anode foil/grid is located. Moreover, as applied to the present investigations, the statement of the simulation problem combines the transport of the pulse in the mode of a traveling voltage TEM wave and the injection of trial particles from the cathode within a given time interval during the pulse rise time. For this reason, it is also important that in the numerical model the position of the plane where the current is measured (i.e., the position of the current gage collector) downstream of the anode would be set precisely. The dynamics of electron acceleration is analyzed by using the particle-in-cell method. It should also be noted that in this case it would be incorrect to solve the problem of emission of particles and to investigate the dynamics of energy gain by electrons in the approximation of a time-dependent cathode potential, as reflections from the duct inhomogeneities and dynamics of the field distribution in the gap will not be taken into account.
As can be seen from the calculation data (see Fig. 2b), the pulse V 0 of maximum amplitude −228 kV (see Fig. 2a) in the no-load mode not doubled, but increased by a factor of ~2.5 (V max≈ −570 kV). Besides, it is important that its leading edge was substantially distorted: To illustrate this, we show the pulse V 1 that represents the original signal V 0 whose amplitude is normalized by V max. It is clear that both the front duration and the voltage rise rate dV/dt within the voltage rise time have changed. Obviously, these are critical points in the determination of the maximum energy gained by electrons in the free acceleration mode for tens of picoseconds. Therefore, comparing the RE energies estimated by the results of current cut-off by foil filters with the predictions of the dynamics of free acceleration of electrons, we always imply that above mentioned problem of the voltage pulse transformation can be completely solved numerically for any amplitude and shape of the original voltage pulse (see Fig. 2a).
EXPERIMENTAL RESULTS
Experiment 1
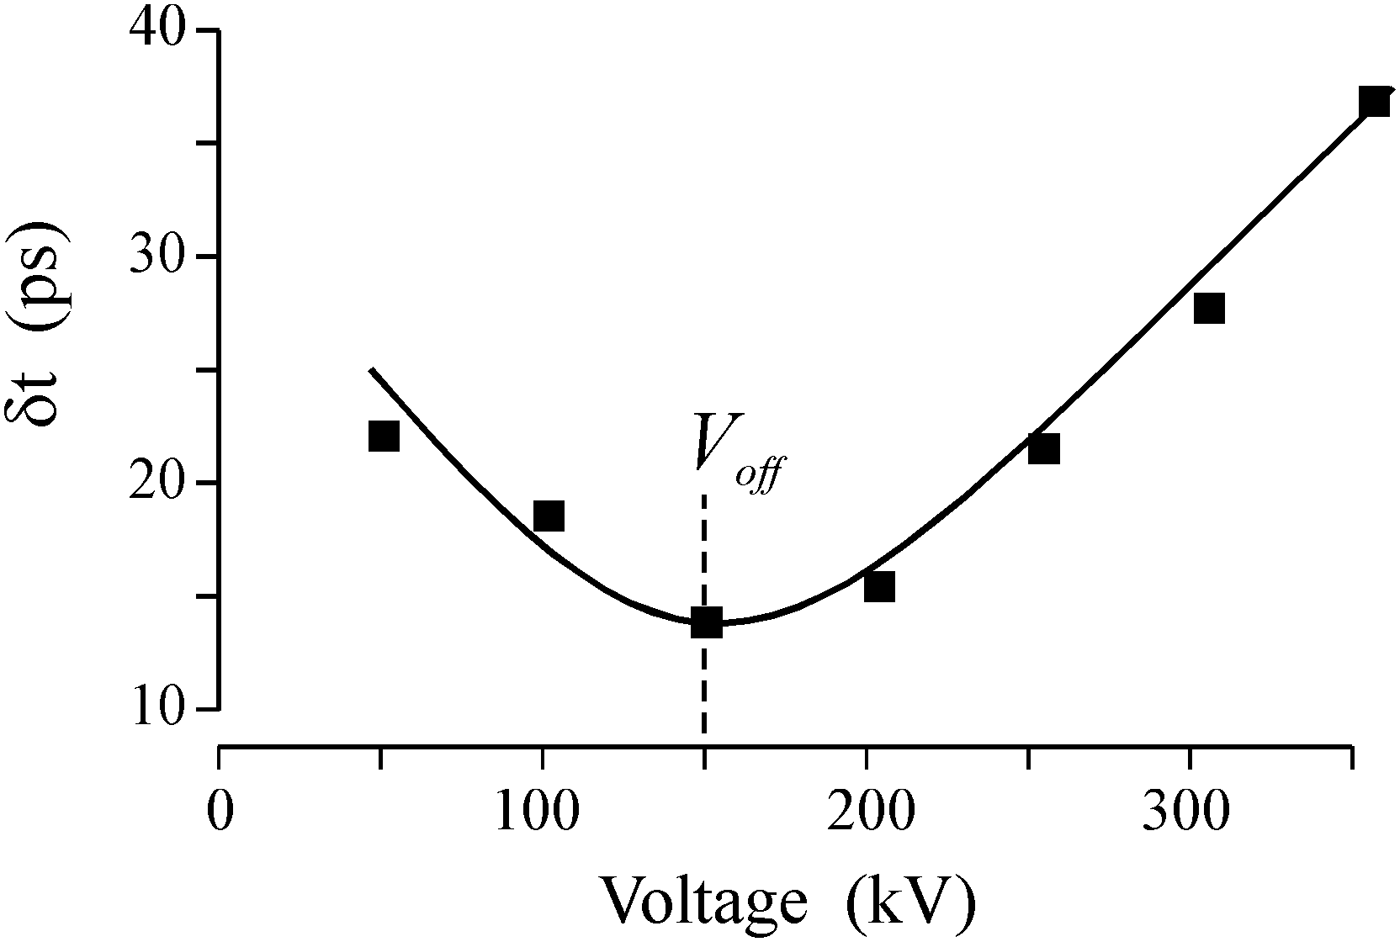
In preparation to the experiments, the graphite cathode was aged by ~104 pulses. Despite the rather long aging, the typical amplitude dispersion of the RE beams current/charge made 15–20% even when filters were not used (Reutova et al., Reference Reutova, Mesyats, Sharypov, Shpak, Shunailov and Yalandin2010). Figure 3 presents an experimental relation obtained by using the method (Yalandin et al., Reference Yalandin, Reutova, Sharypov, Shpak, Shunailov and Mesyats2010b) that was developed for estimation of the upper limit of RE injection voltages (V off) within the rise time of the pulsed voltage V max (t) applied to the cathode (see Fig. 2b). The estimation consisted in seeking a minimum of the spread in values of the delay time between a varied point of starting the oscilloscope time-base sweep within the rise time of the accelerating voltage pulse and a fixed level within the rise time of the RE current pulse. If the range of voltages at which a short RE beam was injected within an unstable rise time was far away from the pulse maximum and the oscilloscope was started by the voltage divider signal within this voltage range, the spread in values of the measured delay time was a minimum. It was noted (Yalandin et al., Reference Yalandin, Reutova, Sharypov, Shpak, Shunailov and Mesyats2010b) that this spread was close to the sum of the physical dispersion of the RE emission cut-off time and the unavoidable noise of the recorder. The relation presented in Figure 3 was re-calculated for accelerating voltage with consideration of the pulse transport to the cathode. In view of the above-mentioned transformations of the voltage pulse leading edge, it is clear that we may associate the point of the oscilloscope start within the rise time of the voltage divider signal with the actual cathode voltage only to within some limited accuracy. The reason is the difference between the rise times of the V 1 and V max pulses (see Fig. 2b). Therefore, the estimation of V off by the relation presented in Figure 3 is temporary.
The total spread of the measured time delay between a fixed level within the rise time of RE beam current and a varied point within the rise time of the accelerating voltage pulse at which the oscilloscope sweep was started.

The position of the voltage minimum in Figure 3 (V off≈ −150 kV) indicates that the range of RE injection voltages lies substantially below V max (see Fig. 2b). This suggests that the latest REs that start at a voltage close to V off and are accelerated subsequently within the pulse rise time will gain higher energies than eV off. Of course, the energy of the electrons can be estimated “from above” as the energy corresponding to complete current cut-off by a set of filters. However, even in that case it would be incorrect to judge on the presence or absence of particles of anomalous energy in the beam energy spectrum, as the REs were injected not at the peak of the pulse V max, whose amplitude reached −570 kV. On the other hand, based on the data about V off, we can roughly evaluate the values to which the amplitude of the accelerating pulse at the cathode should be reduced.
Experiment 2
If we gradually reduce the amplitude of the accelerating voltage pulse at fixed filter thickness, we can measure the threshold voltage for beam current cut-off to a rather good accuracy (within a percent), which corresponds to the ultimate sensitivity of the “gage-oscilloscope” system. When doing this, the cut-off electron energy should be compared with the maximum energy of freely accelerated electrons calculated for the case where a pulsed voltage with amplitude at which some minimum RE current was still recorded is applied to the cathode.
For measurements we used a filter whose thickness, including the screen of the gage collector, was 120 µm. Interpolation of reference data (Baranov, Reference Baranov1974) yields that the cut-off energy for this filter should be ~140 keV (Fig. 4, the dashed line “120 µm–140 keV”). This cut-off energy was chosen specially to be a little below of eV off value corresponding to the voltage minimum in Figure 3. Figure 5 presents the average RE current amplitude for particles passed through the 120-μm aluminum filter as a function of the amplitude of the accelerating voltage pulse at the cathode. Note that the range of average RE currents given in Figure 5, was varied from ~120 mA (point C) to ~100 µA (point B). Of special interest are the voltage amplitudes at points A and B between which the RE current cut-off actually takes place. Therefore, we give in Figures 5b and 5c the corresponding oscillograms obtained in the accumulation mode; here the different signals (RE current and cathode voltage) are not synchronized but clamped each other as “current-to-current” and “voltage-to-voltage.” As expected, with the filter the spread in passed RE current signal amplitudes was rather large (tens percent), and, moreover, it increased as the cut-off boundary was approached (see Fig. 5b). This is clear as even insignificant (and unavoidable) variations in amplitude of the accelerating voltage produced by a pulse generator become more and more substantial on approaching the cut-off energy. This fact definitely points to that the electrons energy spectrum cannot be analyzed by the method of filters all over the range of RE beam energies as the amplitudes of the voltage and current signals are insufficiently stable for doing this.Footnote 2 The decrease of the amplitude of the accelerating voltage traveling wave, measured by the capacitive voltage divider, from −54 kV (see Fig. 5b) to −42 kV (Fig. 5c) resulted in full disappearance of even occasional, individual bursts of the RE current downstream of the 120-μm filter.
The electron cut-off energy as a function of the thickness of an aluminum filter (interpolation of data on mean free paths of monoenergetic particles (Baranov, Reference Baranov1974)).

The average amplitude of the current of REs passed through a 120-μm aluminum filter as a function of the amplitude of the accelerating pulse at the cathode (a); oscillograms of signals of the RE beam current (I RE) and of the accelerating voltage pulse (V trav) at voltage amplitudes equivalent to those at the cathode for points B and A of plot (a), respectively (b, c). The delay between the I RE and V trav signals was the same, but arbitrary for all oscillograms. The oscillograms were recorded in the mode of accumulation of 50 pulses. The voltage amplitudes (−54 and −42 kV) were obtained by averaging of the recorded oscillograms.

Interpolation of the averaged pulse of amplitude −54 kV (Fig. 5b) was used to numerically simulate its transport to the cathode and to determine the energy of trial particles in the free acceleration mode. It was obtained that the pulse amplitude at the cathode increased to −145 kV (Fig. 6a). This was just the sought-for value of V real. Note that the voltage multiplication factor in the no-load mode was 2.68. The time interval for injection of trial particles was chosen arbitrarily and set equal to 160 ps. The corresponding region is bounded by a rectangle in Figure 6a. However, the latest particle started at the maximum voltage. From Figure 6b it follows that the maximum calculated energy of a trial electron reached ~143 keV. It should be noted that this refers to a particle that had started earlier than the voltage reached at maximum. The reason is obvious: The latest electron is accelerated during the pulse fall time. Thus, with the experimental data and the calculations three parameters are matched: the amplitude of the accelerating pulse (−145 kV), the predicted maximum energy of a trial particle freely accelerated by this voltage pulse (143 kеV), and the threshold cut-off energy (140 kеV) at which the filter still passes the RE beam current. Note that in the absence of the 120 µm filter (when only the 15-μm screen of the current collector that cut-off electrons of energy 40 keV was used only) the measured averaged RE current was 0.5 A. At point B in Figure 5a (before the cut-off) the maximum amplitude of the current signal was not above 1.5 mA (Fig. 5b). Thus, the fraction of electrons whose energy could be over the threshold cut-off energy for the filter equal to 140 kеV (and, in fact, the energy of freely accelerated electrons) in no case was more than 3 × 10⁻³. In view of the absence of a current signal after the cut-off (Fig. 5c), the probability of any anomaly in the energy spectrum appears to be even lower. This actually points to entire absence of electrons of anomalously high energy in the RE beam.
Numerical simulation of the delivery of a voltage pulse V trav (Fig. 5b) of amplitude –54 kV to the cathode where it increases to −145 kV (for comparison, the pulse of ultimate amplitude at the cathode (−570 kV) is shown). The rectangle encloses the 160-ps wide region of trial particle injection voltages (a); calculation data showing the dynamics of energy gain by trial particles. Data on the normalized kinetic energy are given for the first, the last, and the most high-energy electron. The sections where the energy does not vary correspond to the drift of particles passed through the anode over the observation plane at the beam gage collector (b).

When analyzing the relation presented in Figure 5a, one can raise a logical question as to why at such a considerable voltage margin from the latest point of RE injection to the point of its peak (−145 kV and −570 kV, respectively) the beam current measured downstream of the 120-μm filter gradually decreases with voltage amplitude? This becomes clear if we recall the character of the variation dV/dt during the pulse rise time on varying pulse amplitude (see Fig. 2a). As the RE injection voltage is limited from above (otherwise the RE beam current would not be cut-off so quickly and stably), the energy of the accelerated particles that have started within the given range of voltages during the rise time will increase with dV/dt. It is clear that the beam of electrons of increased energy passes through the cathode-anode air gap, the filter, and the comparatively small drift space downstream of the anode with smaller losses.
Experiments 3 and 4
In addition to the measurements presented in Figure 5, the upper limit of RE energies was determined by the cut-off energy threshold for filters of varied thickness. Measurements were performed for accelerating pulses with two fixed amplitudes. The RE current cut-off energy for the filters was also compared with the predicted energy of freely accelerated particles.
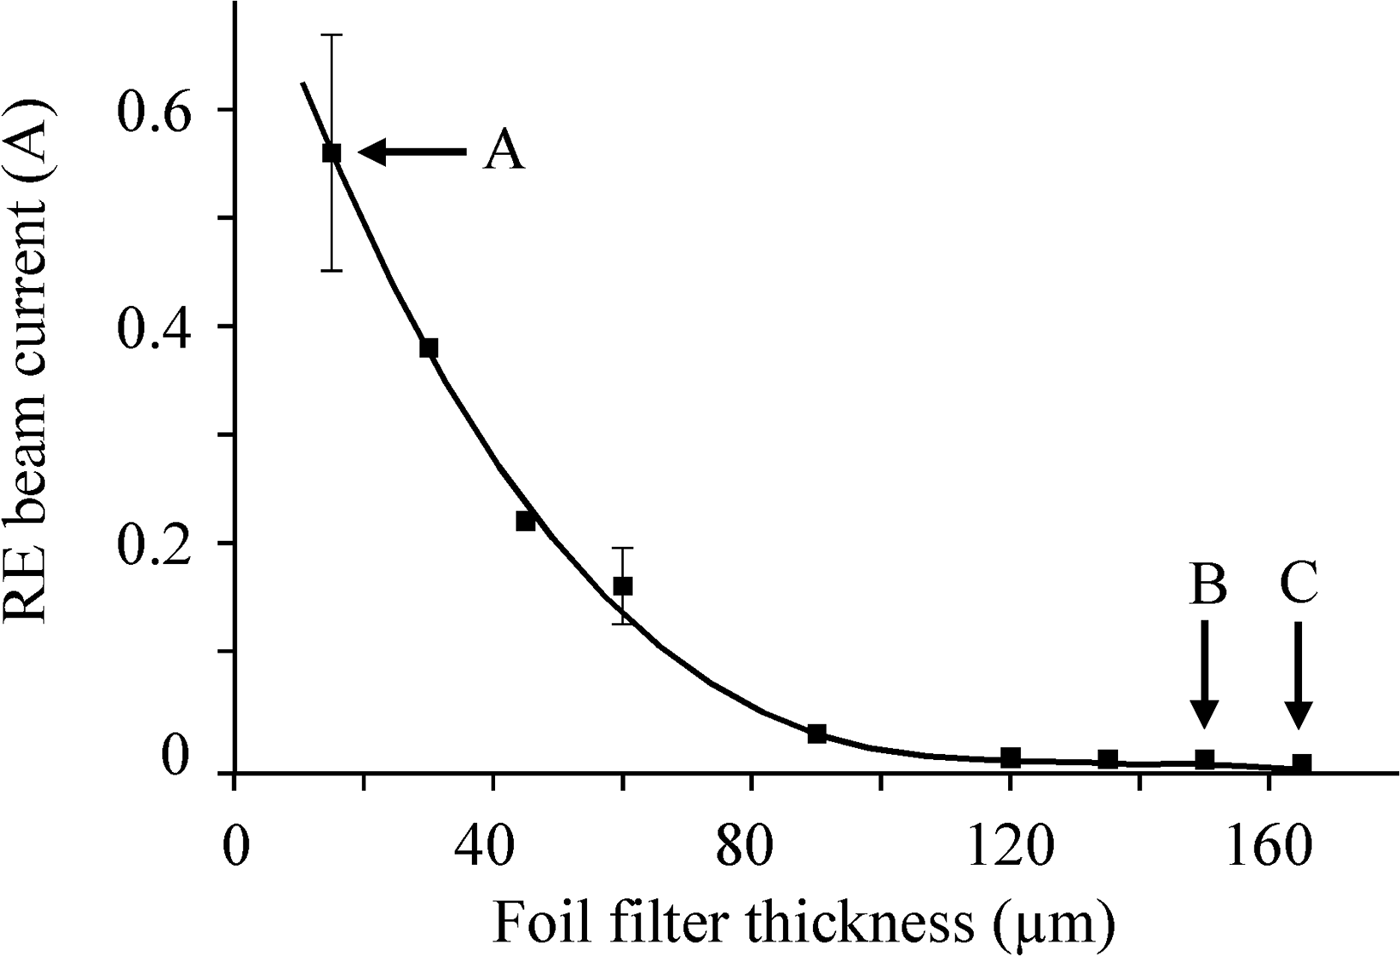
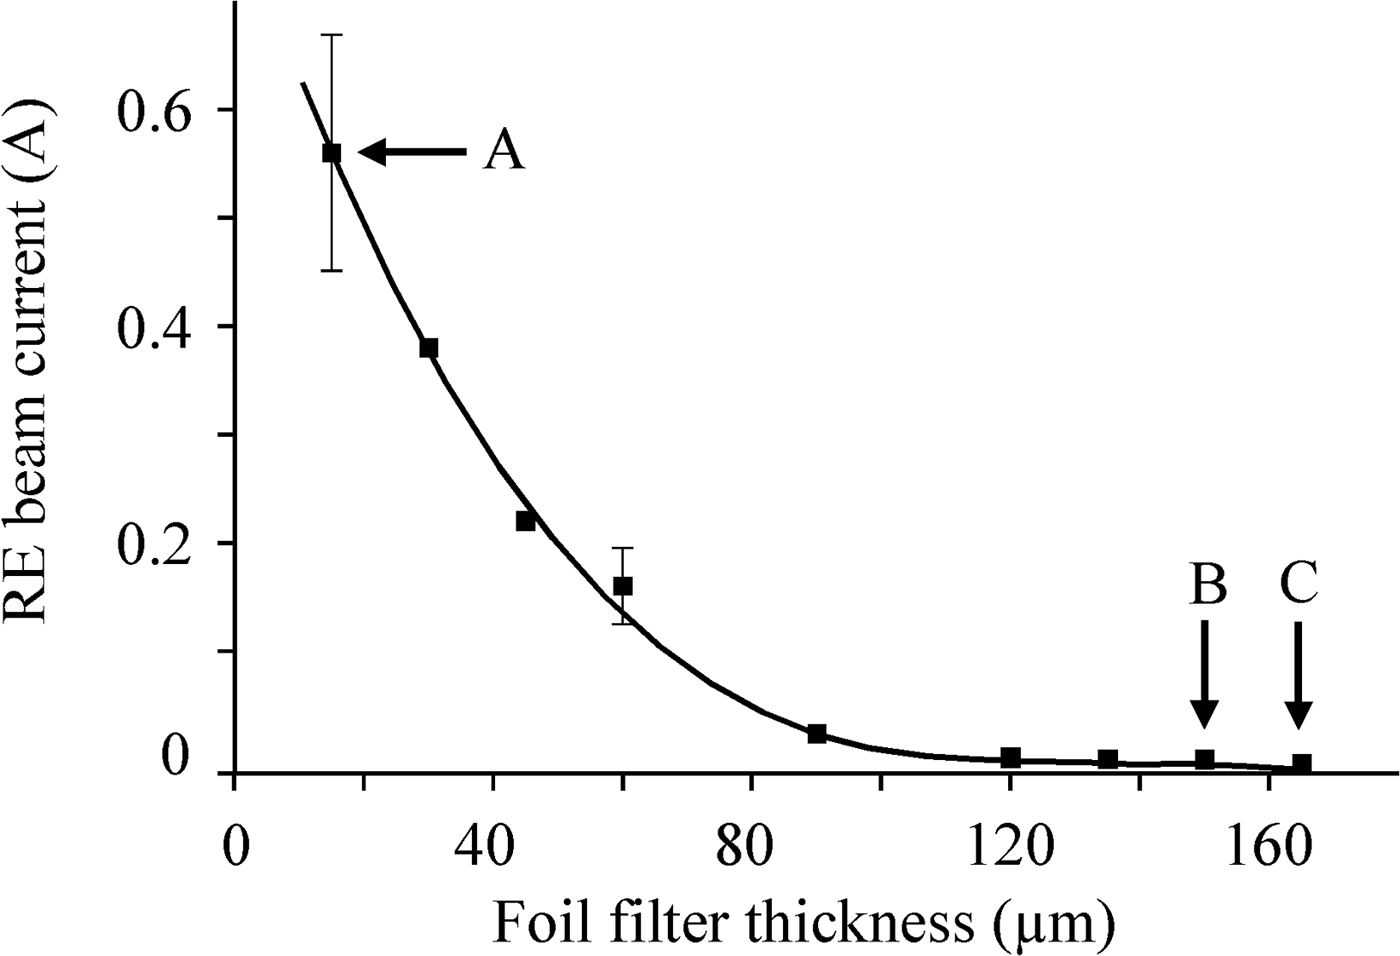
Figure 7 presents a curve that shows the decrease in RE current on increasing the thickness of the filter at a fixed amplitude of the accelerating pulse at the cathode (−165 kV, Fig. 8a). Complete cut-off of the RE current (point C) occurred at a filter thickness of 165 µm. For the previous value (point B, 150 µm) the maximum amplitude of RE current bursts reached ~200 µA, whereas in the case of no filter the RE current was over 0.6 A. As the cut-off energy for the 150-μm and the 165-μm filter was 160 and 170 keV, respectively (see Fig. 4), the RE gained a maximum energy in this range, and no more. It is clear that we may state this because the relation of pre-cut-off RE current and the total beam current was 4 × 10⁻⁴. In the simulation model, trial particles started within the pulse rise time (Fig. 8a) at voltages up to −145 kV, that is, in the range below the peak value (−165 kV). Recall that the value −145 kV was previously assumed the maximum voltage for injection of trial particles for the pulse shown in Figure 6a. The calculations (Fig. 8b) show that under these conditions the highest energy was gained by the latest trial electron, and it was 163 keV.
Attenuation of the current RE on varying the thickness of the aluminum filter. The amplitude of the accelerating pulse at the cathode was −165 kV.
Numerical simulation of the delivery of a voltage pulse of amplitude −165 kV to the cathode (for comparison, the pulse of ultimate amplitude (−570 kV)) is shown. The rectangle encloses the 130-ps region of injection of trial particles (a); calculation data showing the dynamics of energy gain by trial particles that have started from extreme points of the RE injection region (b).

Thus, the obtained particle injection voltage V real = −145 kV confirmed the agreement between the data of Experiment 3 and the calculations. The existence of this threshold voltage was additionally checked in Experiment 4 (Fig. 9), which was carried out similarly to the previous one with the maximum amplitude of the accelerating pulse at the cathode equal to −570 kV (Fig. 10a). The data obtained have shown that the energy maximum of the REs cut-off by filters of thickness 195 and 210 µm (see Fig. 9) was in the range 187–198 keV (see Fig. 4). This also agrees with the calculated maximum energy of a trial electron (~200 keV) (Fig. 10b) that started within the pulse rise time at the same voltage V real = −145 kV. Note that the closeness of the maximum RE energy to the cut-off energy threshold for the 210-μm filter has made it possible to detect accidental bursts of the RE current at point C (see Fig. 9) resulting from the instability of the voltage pulse. The burst amplitude, however, was at a level of (0.5–2) × 10−4 of the beam current not attenuated by a filter. With a filter of thickness more than 210 µm the current signal was entirely absent.
Attenuation of the current RE on varying the thickness of the aluminum filter. The amplitude of the accelerating pulse at the cathode was −570 kV.

Numerical simulation of the delivery of a voltage pulse of amplitude −570 kV to the cathode. The rectangle encloses the 109-ps wide region of trial particle injection voltages (a); calculation data showing the dynamics of energy gain by trial particles that have started from extreme points of the RE injection region (b).

Thus, it has been demonstrated that the beam of RE does not contain particles of anomalous energy, and the upper limit of cathode voltages has been determined experimentally (V real = −145 kV) at which RE injection ceases.
The reliability of the data obtained was checked for the conditions where the geometry of the acceleration gap was substantially changed: the cathode-anode gap spacing was increased from 8 to 20 mm. This should change the upper threshold of the voltage range where RE beam injection took place. The essence of the problem to be solved was the following: For the RE beam injection within an initially unknown period during the rise time of the accelerating pulse of maximum amplitude (−228 kV in the traveling wave), it was determined by using filters of variable thickness that the complete cut-off of the RE beam corresponded to a maximum particle energy of 270 keV. For this accelerating pulse, whose amplitude at the cathode increased to −570 kV, with a numerical model based on the method of trial particles, the time and voltage of particle injection within the pulse rise time have been found for which an electron starting under these conditions would gain energy of 270 keV. This voltage was −180 kV. Thereafter, assuming that the upper limit of the injection voltage is known, the pulse amplitude at the cathode was decreased so that it approached −180 kV. Obviously, such a pulse can accelerate electrons to no more than 180 keV if the beam does not contain electrons of anomalous energy. This was confirmed by the complete cut-off of the beam current by an aluminum filter of thickness 180 µm (see Fig. 4). The measurements accuracy was no worse than in the previous experiments.
Experiment 5
The methods and approaches described also allow one to estimate the lower threshold of the voltage (electric field) at which the conditions under which electrons of zero initial energy go into a continuous acceleration mode are satisfied. Actually, if the anode has no filter and only covered with a grid and the beam collector is protected with a screen of thickness 15 µm, the amplitude of the accelerating pulse can be reduced until the energy of the accelerated electrons becomes lower than the cut-off energy for the screen foil (40 keV, see Fig. 4). If the RE current disappears at a voltage corresponding to a calculated electron energy which is over the cut-off energy threshold for the screening filter, this voltage will be the sought-for lower threshold voltage. In view of the features of measurements on the picosecond scale, in the simulation, care was taken that the pulse duration, as its amplitude was decreased, remained sufficient for particle acceleration to occur (see Fig. 2a). Figure 11 presents an experimentally obtained relation between the RE beam current and the voltage amplitude for an 8-mm cathode-anode gap. As can be inferred from the oscillograms, no signal of the RE current was observed at point A of Figure 11 (Fig. 12a). The beam current took place at point B, but its value was completely determined by the statistical spread in amplitudes of the accelerating pulse (cf. Figs. 12b and 12c). The last oscillogram shows only a single current pulse, and therefore it is clear that for its occurrence the voltage pulse of maximum amplitude present in the packet of fifty recorded pulses was responsible. This pulse corresponds to amplitude of −74 kV at the cathode. Thus, the calculations have shown that the traveling pulse amplitude measured at the cathode by the voltage divider (−27 kV) in the no-load mode increased by a factor of 2.74.Footnote 3 The calculated energies of trial electrons that started within 10 ps at a voltage close to the accelerating pulse maximum fall in the range 54–66 keV. These energies are above the cut-off energy for the screening filter; therefore, the conditions under which RE emission arises at a cathode voltage of −74 kV can be considered criteria.
The amplitude (averaged over 50 pulses at each point) of the RE current passed through a fixed 15-μm aluminum filter (the screen of the beam current gage collector) as a function of the amplitude of the accelerating pulse at the cathode. The cathode-anode gap was 8 mm.

Oscillograms of the accelerating voltage pulse picked up from the capacitive voltage divider in the traveling wave mode (V trav) and of the RE current (I RE) for point A of Figure 11 where the RE current is absent and for two realizations of 50-pulse packets near point B of Figure 11 (b, c). The oscillograms were recorded in the accumulation mode.

Let us estimate the electric field at the cathode edge that corresponds to this voltage. Assume that the edge of the tubular cathode is hemitoroidal. This is a rather arbitrary assumption; however, there is no alternative as the actual emitter is a thin near-cathode gas layer ionized by field emission electrons as early as during the action of the nanosecond pre-pulse of voltage ~ 10–15 kV. Also, note that this plasma emitter is not continuous, but it is attached to discrete regions of initiating field-emission centers (see, e.g., Babich et al., Reference Babich, Loiko and Tsukerman1990; Mesyats & Yalandin, Reference Mesyats and Yalandin2009). From the numerical solution of the electrostatic problem (Tiunov et al., Reference Tiunov, Fomel and Yakovlev1989) it follows that at a cathode potential of −74 kV the electric field at the edge will be ~600 kV/cm. This is only by 20% greater than the classical critical field for nitrogen (~500 kV/cm) at which the condition that electrons of zero initial energy will go into the continuous acceleration mode (see, e.g., Korolev & Mesyats, Reference Korolev and Mesyats1998) is satisfied. The fit will be exact if we increase the radius of the cathode hemitoroidal edge from 0.2 to 0.35 mm, thus taking into account the presence of the ionized gas layer. If we then solve the relevant electrostatic problem for the case of an increased cathode-anode gap spacing (20 mm), we obtain that the same critical field will be attained at a cathode voltage of −84 kV. The seemingly insignificant change in lower threshold voltage from −74 to −84 kV was entirely confirmed in the experiment (−83 kV) carried for the 20-mm gap in which measurements were performed similarly to those presented in Figures 11 and 12.
The data obtained on the lower and the upper limit of voltages at which RE are injected within the voltage rise time are in fact the data on the full time interval in which an RE beam is generated. For the 8-mm gap, this interval in the accelerating pulse rise time is marked out in Figure 13a. For this case, when performing calculations for freely accelerated trial particles, one should suppose that the particles are injected within this limited interval. Thus, it has been found that the time interval within which RE are injected from the cathode (47 ps) was transformed in the plane of its detection by the current gage into the full pulse duration (measured between the times of injection of the earliest and the latest trial particle) (Fig. 13b) that was equal to 26 ps.Footnote 4 The range of energies of the accelerated particles at the anode was 130–200 keV.
Numerical simulation of the delivery of a voltage pulse of amplitude −570 kV to the cathode. The rectangle encloses the 47-ps wide region of trial particle injection voltages bounded by the onset of RE emission (V start) and beam cut-off (V real) thresholds (a); calculation data showing the dynamics of energy gain by trial particles that have started from extreme points of the RE injection region and the shortening of the beam current pulse full duration from 47 to 26 ps as the particles passes the distance from the injection region to the point of detection by the gage (b).

CONCLUSION
The experiments and numerical simulations presented were the advancements of the previous investigations of runaway electron beams performed by the authors. The goal of the study was to obtained detailed information on the effect of continuous acceleration of electrons in an electrode gap with a highly nonuniform field. The experiments were carried out with now best achieved real-time picosecond resolution. Citing experimental and calculation data that coincide within a few percents, the authors realize that this is not a typical case in picosecond high-voltage electronics. On the other hand, this is just the precision to which we usually calibrate the diagnostic instrumentation and gages of in-house design. Therefore, we can reasonably state that the absence of particles of anomalously high energy in the runaway electron beam is a proven fact, at least for air gaps with a highly nonuniform field. Also, there are strong grounds to believe that the criteria for electrons of zero initial energy to go into the continuous acceleration mode are not different from the classical ones.
ACKNOWLEDGMENTS
The work was supported in part by the basic research program “Problems of Physical Electronics, Charged Particle Beams, and Generation of Electromagnetic Radiation in High Power Systems” of the Presidium of the Russian Academy of Sciences and by the Russian Foundation for Basic Research grants Numbers 08-02-00183а, 10-08-00081а, and 11-08-00145a.