Metabolic syndrome (MetSyn) is not defined as a sole disease; however, it is characterised by the co-occurrence of at least three of the following risk factors: abdominal obesity, hyperglycaemia, insulin resistance, hypertension and dyslipidaemia(Reference Wang, Lee and Liu1–Reference Huang3). MetSyn is a certain public health challenge, and its rapid increase in regions like the Middle East underscores the need for effective nutritional and lifestyle interventions(Reference Wang, Lee and Liu1).
Beyond its well-established cardiometabolic complications, MetSyn is increasingly linked to less-recognised co-morbidities, particularly appetite dysregulation and mood disorders. A key hormonal player in this relationship is ghrelin, the primary orexigenic hormone, acting as a central signal of energy deficit to the brain. A consistent finding in the literature is that metabolically unhealthy obese individuals and MetSyn patients might exert lower concentration of ghrelin as compared with healthy subjects. The precise mechanism behind the reduced ghrelin levels’ involvement in metabolic disturbances, though, still requires further investigation(Reference Fahed, Aoun and Bou Zerdan4–Reference Skoracka, Hryhorowicz and Schulz12). Current research suggests that ghrelin-producing cells have a system closely tied to insulin and glucose levels in the blood, implying that insulin resistance and high blood sugar may suppress the release of ghrelin. This suppressed ghrelin concentration is proposed to be paradoxically associated with worse metabolic parameters. Dysregulation of ghrelin is also thought to contribute to aberrant appetite signalling, undermining dietary adherence and weight management efforts(Reference Ukkola, Pöykkö and Antero Kesäniemi8–Reference Ukkola, Pöykkö and Päivänsalo13). Recent evidence further illuminates ghrelin’s role beyond appetite, suggesting a protective function against chronic stress and depression. Higher ghrelin levels have been correlated with a lower risk of metabolic problems linked to chronic stress and depression, highlighting its possible therapeutic benefits in mitigating depression-like symptoms caused by chronic stress as well as metabolic disorders(Reference Kim, Nam and Shin7,Reference Gajewska, Strzelecki and Gawlik-Kotelnicka11,Reference Lutter, Sakata and Osborne-Lawrence14) . This is critically relevant given the established bidirectional relationship between MetSyn and depression, which is thought to be mediated by shared pathways such as chronic inflammation, disruption of the hypothalamic–pituitary–adrenal axis and the imbalance of hormones, including ghrelin. Consequently, a therapeutic strategy that modulates ghrelin could simultaneously address metabolic dysregulation, appetite control and depressive symptoms in MetSyn(Reference Wang, Chair and Wong15–Reference Al-Khatib, Akhtar and Kanawati19).
Dietary composition is a potent modulator of postprandial ghrelin response(Reference Skoracka, Hryhorowicz and Schulz12,Reference Lutsey, Steffen and Stevens20,Reference Andersen and Fernandez21) . Emerging research indicates that certain dietary factors, with fibre being particularly noteworthy, appear to markedly influence ghrelin levels and related pathways that affect appetite regulation and depressive symptoms, though findings remain nuanced(Reference Skoracka, Hryhorowicz and Schulz12,Reference Lutsey, Steffen and Stevens20–Reference St-Pierre, Rabasa-Lhoret and Lavoie22) . In this context, brown rice bran, as a nutrient-dense functional food rich in bioactive compounds comprised of vitamin E (tocotrienols and tocopherols), isoflavones, beta-carotene, anthocyanins, γ-oryzanol, polyphenols and dietary fibre, presents a promising dietary intervention. However, a critical gap exists in the evidence. While individual components are studied, the specific impact of brown rice bran powder (BRBP) on ghrelin physiology, appetite perception and depression scores in a MetSyn population has not been rigorously investigated through a randomised controlled trial (RCT) design(Reference Sarker and Rahman23–Reference Ghorbani, Shoaibinobarian and Zamani29).
Therefore, utilising data from our previous RCT(Reference Ghorbani, Shoaibinobarian and Zamani29), this secondary analysis aimed to determine the efficacy of an 8-week supplementation with 15 g/d of BRBP within a standard diet to modulate ghrelin levels, appetite control, depression, atherogenic indices and insulin resistance surrogate markers in MetSyn patients, compared with a standard diet alone. We hypothesised that BRBP supplementation would significantly enhance ghrelin levels, improve satiety, reduce depression scores and enhance atherogenicity and insulin resistance compared with a standard diet alone.
Method
Study design
The current trial is a secondary analysis of a single-centre, controlled, open-label, randomised trial investigating the effects of daily intake of BRBP (15 g) with a standard diet for 8 weeks in adults (male and female aged between 20 and 70 years) with MetSyn. The research design and data collection methods have been detailed in another source(Reference Ghorbani, Shoaibinobarian and Zamani29). In summary, between April 2022 and June 2023, we engaged a total of fifty individuals diagnosed with MetSyn, sourced from the cardiology outpatient clinic at Dr Heshmat Hospital in Rasht. The following factors were considered as inclusion criteria: patients who had MetSyn (≥ 3 parameters of MetSyn, such as hypertriacylglycerolaemia (≥ 150 mg/dl), low levels of HDL-cholesterol (< 50 mg/dl in women; < 40 mg/dl in men), hypertension (systolic ≥ 130 and/or diastolic ≥ 85 mm Hg), impaired fasting glucose (> 100 mg/dl) and central adiposity (> 102 cm in men; > 88 cm in women) or intake of medicine for each parameter). Additionally, subjects with a medical history of urolithiasis, gastrointestinal disorders, kidney diseases, cholelithiasis, autoimmune disorders and kidney diseases; those who consumed alcohol; or individuals with a history of drug abuse or consuming supplements (fibre, n-3, antioxidants, vitamins and minerals), which could affect the outcomes of the intervention, as well as those who changed their treatment during the intervention or did not intend to follow the trials’ instructions due to the taste of the powder or any personal reason, were also excluded from the intervention.
Based on age groups (20–45 years and 45–70 years), subjects were randomly assigned to either a standard diet group or a BRBP with a standard diet group using a computer-based stratified blocked randomisation method, with a block size of 4.
Approval for this research was granted by the Institutional Review Board of Research Affairs at Guilan University of Medical Sciences (GUMS), which thoroughly scrutinised and endorsed the study under research number 71213/3734. The GUMS Ethics Committee further validated both the design and methodological procedures of the study, assigning the ethics code number IR.GUMS.REC.1400.388. Committed to ethical standards, the research adhered to the guidelines articulated in the Declaration of Helsinki (2013), ensuring that all participants signed and dated informed consent documents before any research procedures began; the trial protocol was also documented in the clinical trial registration system (IRCT registration number: IRCT20180205038626N11, registration date: 2021-11-25; URL: https://en.irct.ir/trial/38346).
Intervention
As detailed in our previous report(Reference Ghorbani, Shoaibinobarian and Zamani29), at the beginning and end of the study period, each participant underwent a detailed interview conducted by a registered dietitian from the research team. These interviews were designed to collect comprehensive dietary intake data using the 24-h dietary recall method. Based on the initial assessments, individualised diets were formulated to align with each participant’s typical eating habits and personal preferences. Energy requirements and macronutrient distributions were calculated in accordance with the 2010 USDA Dietary Guidelines for Americans(30), resulting in a standard dietary composition of 55 % carbohydrates, 30 % fat and 15 % protein.
Participants were divided into two groups. The control group followed only the standard diet, while the intervention group was instructed to incorporate 15 g of brown rice bran (approximately one tablespoon in powder form) into their daily intake alongside the standard diet. All individuals diagnosed with MetSyn continued to receive routine medical care and any prescribed medications throughout the study. None of the participants in either study group were prescribed antidepressant or antipsychotic medications before or during the trial period.
The BRBP used in the trial was supplied by Giltaz Company with no role in the study’s design, conduct, analysis or interpretation. Its nutritional and phytochemical composition was analysed using validated food analysis techniques. HPLC, performed on an Agilent 1100 system, was used to measure total sugars, vitamin content and γ-oryzanol. The contents of insoluble and soluble fibre were determined using enzymatic-gravimetric methods. Fat content was assessed via the Soxhlet extraction technique, and protein levels were measured using the Kjeldahl method. All laboratory analyses were conducted at Viromed Laboratory in Rasht, Iran. The nutrient profile of BRBP per 100 g included 20·88 g of protein, 17·3 g of fat, 8·33 g of total sugars, 20·4 g of insoluble fibre and 2·3 g of soluble fibre. It also contained 7·1 mg of vitamin E, 4·8 mg of thiamin (B1), 30·2 mg of niacin (B3), 6·17 mg of pantothenic acid (B5), 1·8 mg of pyridoxine (B6) and 57 mg of γ-oryzanol. Safety evaluations confirmed that the BRBP was free from detectable levels of harmful mycotoxins, including aflatoxins B1, B2, G1, G2, ochratoxin A, zearalenone and deoxynivalenol. Microbiological analysis revealed that the total count of moulds and micro-organisms was less than ten colony-forming units per gram (CFU/g), and no traces of Escherichia coli or sulphite-reducing Clostridium were found, ensuring the product’s safety for consumption.
Demographic and anthropometrics measurements
Upon collecting the sociodemographic data of the recruited participants, which encompassed age and job status, a standard stadiometer and the Seca 755 medical scale with a precision of 0·1 cm and 0·5 kg, respectively, were utilised to measure height and weight in pre- and post-intervention. A computing of BMI was done using the formula weight (kg) divided by the square of height (m2)(Reference Ghorbani, Shoaibinobarian and Zamani29).
Biological sample collection and analysis
For measuring serum levels of ghrelin, fasting blood sugar and lipid profile, an 8 mL sample of venous blood in fasting conditions was collected from subjects at pre- and post-research periods. Sodium citrate was incorporated into the sterile containers to protect samples from coagulation. Plasma was separated from serum aliquots through centrifugation, and then both of them were stored in a − 70℃ freezer. The method of enzymatic-colorimetric (CPO-POD) was performed to assess the serum levels of total cholesterol, HDL-cholesterol and fasting blood sugar using cholesterol oxidase, cholesterol esterase and glucose oxidase, respectively, with commercial kits (MAN Co.) and an auto-analyser (Hitachi 917/Olympus 640). In addition, LDL-cholesterol was computed via the Friedewald formula. The Bionic Corporation commercial kit and glycerol phosphate oxidase were also used to assess the serum concentration of TAG in the same way. To assess the serum level of total fasting ghrelin, a double-antibody sandwich enzyme-linked immunosorbent was applied using the Human Ghrelin ELISA kit (Intra-Assay: CV < 10 %; Inter-Assay: CV < 12 %; Crystal Day kit, Cat No: E3091Hu (Bioassay Technology Co)).
Appetite assessment based on visual analogue scales
Individuals with MetSyn were asked to fill out a four-component visual analogue scale (VAS) questionnaire to evaluate their appetite rating. Various parameters were assessed in the VAS questionnaire, including desire to eat, feeling of fullness, satiety and hunger. Each single VAS scale was a 100 mm horizontal line with labels anchoring at both ends, elucidating the lowest (e.g. for fullness, ‘Not at all having a feeling of fullness’) and highest (e.g. for fullness, ‘Extremely fullness’) ratings of each parameter(Reference Lindeman, Huang and Dawkins31–Reference Tahavorgar, Vafa and Shidfar33). The investigators completed the VAS questionnaire at pre- and post-intervention. It should be mentioned that subjects did not have any information about their prior scores obtained from the VAS questionnaire.
Beck Depression Inventory
The Beck Depression Inventory (BDI) is a validated questionnaire to examine the status of depression. Such a questionnaire is self-reported and consists of twenty-one multiple-choice questions. The answer to each question has four categories, ranging from 0 (no symptoms of depression) to 3 (severe symptoms). Therefore, the total of all responses is between 0 and 63. For each single question, participants have to select the best options which represent their situation during the last 8 weeks(Reference Beck, Steer and Carbin34,Reference Beck, Ward and Mendelson35) .
Definition of the atherosclerosis-related indices and insulin resistance surrogate markers
The atherogenic status indices were estimated on the basis of these calculations:
-
 ${\rm{Atherogenic}}\;{\rm{coefficient}}\;\left( {{\rm{AC}}} \right) = \\{{{\rm{total}}\;{\rm{cholesterol}}\;\left( {{{{\rm{mmol}}} \over {\rm{l}}}} \right)\; - \;{\rm{HDL}} - {\rm{C}}\;\left( {{{{\rm{mmol}}} \over {\rm{l}}}} \right)\;} \over {{\rm{HDL}} - {\rm{C}}\;\;\left( {{{{\rm{mmol}}} \over {\rm{l}}}} \right)}}$
(Reference Tecer, Sunar and Ozdemirel36).
-
${\rm{Castelli}}\;{\rm{risk}}\;{\rm{index}} - {\rm{II}}\;\left( {{\rm{CRI}} - {\rm{II}}} \right)\; = {{{\rm{LDL}} - {\rm{C}}\;\left( {{{{\rm{mmol}}} \over {\rm{l}}}} \right)} \over {{\rm{HDL}} - {\rm{C}}\;\left( {{{{\rm{mmol}}} \over {\rm{l}}}} \right)}}$
(Reference Tecer, Sunar and Ozdemirel36,Reference Oguntola, Hassan and Duarte37) .
-
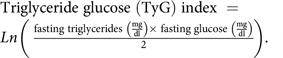
${\rm{Triglyceride}}\;{\rm{glucose}}\;\left( {{\rm{TyG}}} \right)\;{\rm{index}}\; =\\ \ Ln\left. {\left( {\;{{{\rm{fasting}}\;{\rm{triglycerides}}\;\left( {{{{\rm{mg}}} \over {{\rm{dl}}}}} \right) \times \;{\rm{fasting}}\;{\rm{glucose}}\;\left( {{{{\rm{mg}}} \over {{\rm{dl}}}}} \right)} \over 2}} \right.} \right)$
(Reference Yu, Wang and Zhang38).
-
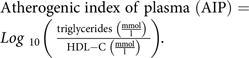
${\rm{Atherogenic}}\;{\rm{index}}\;{\rm{of}}\;{\rm{plasma}}\;\left( {{\rm{AIP}}} \right) =\\ Log{\;_{10}}\left. {\left( {\;{{{\rm{triglycerides}}\;\left( {{{{\rm{mmol}}} \over {\rm{l}}}} \right)\;} \over {{\rm{HDL}} - {\rm{C}}\;\left( {{{{\rm{mmol}}} \over {\rm{l}}}} \right)}}} \right.} \right)\;$
(Reference Tecer, Sunar and Ozdemirel36,Reference Oguntola, Hassan and Duarte37,Reference Dobiásová and Frohlich39) .
-
${\rm{Lipoprotein}}\;{\rm{combine}}\;{\rm{index}}\;\left( {{\rm{LCI}}} \right) =\\ {{{\rm{total}}\;{\rm{cholesterol}}\;\left( {{{{\rm{mmol}}} \over {\rm{l}}}} \right)\; \times \;{\rm{triglycerides}}\;\left( {{{{\rm{mmol}}} \over {\rm{l}}}} \right)\; \times \;{\rm{LDL}} - {\rm{C}}\;\left( {{{{\rm{mmol}}} \over {\rm{l}}}} \right)} \over {{\rm{HDL}} - {\rm{C}}\;\left( {{{{\rm{mmol}}} \over {\rm{l}}}} \right)}}$
(Reference Oguntola, Hassan and Duarte37,Reference Cai, Shi and Xue40) .
-
${\rm{Cholesterol}}\;{\rm{index}}\;\left( {{\rm{CHOLINDEX}}} \right) = {\rm{LDL}} - {\rm{C}}\;\left( {{{{\rm{mmol}}} \over {\rm{l}}}} \right) -\\ \; {\rm{HDL}} - {\rm{C}}\;\left( {{{{\rm{mmol}}} \over {\rm{l}}}} \right)$
-
(All patients had triglycerides < 400 mg/dl)(Reference Akpınar, Bozkurt and Acartürk41,Reference Olamoyegun, Oluyombo and Asaolu42) .
-
${\rm{Metabolic}}\;{\rm{score}}\;{\rm{for}}\;{\rm{insulin}}\;{\rm{resistance}}\;{\rm{index}}\;\left( {{\rm{METS}} - {\rm{IR}}} \right) = \\{{{\rm{Ln}}\;\left( {\left( {2 \times {\rm{fasting}}\;{\rm{glucose}}\;\left( {{{{\rm{mg}}} \over {{\rm{dl}}}}} \right)} \right) + \;{\rm{fasting}}\;{\rm{triglycerides}}\;\left( {{{{\rm{mg}}} \over {{\rm{dl}}}}} \right)} \right) \times {\rm{BMI}}\;} \over {{\rm{Ln}}\;\left( {{\rm{HDL}} - {\rm{C}}\;\left( {{{{\rm{mg}}} \over {{\rm{dl}}}}} \right)} \right)}}$
(Reference Bello-Chavolla, Almeda-Valdes and Gomez-Velasco43).





Sample size calculation and statistical methods
As described in our earlier report(Reference Ghorbani, Shoaibinobarian and Zamani29), the estimated sample size for the present trial was derived from the formula described below, taking Ito et al.(Reference Ito, Nakashima and Matsuoka44) as a reference, and targeted twenty-five participants per group, accounting for an expected dropout of approximately 15 %. A statistical power of 80 % was selected with the aim of achieving a minimum reduction of 27 mg/dl in total cholesterol. The significance level was set at α = 0·05 and the complement of power (β) at 0·20, with the group-specific standard deviations SD1 = 29·0 and SD2 = 33·5, yielding a detectable difference d = 27.
 $$N = 2 \times {(({Z_{1 - (\alpha /2)}}) + {Z_{1 + \beta }})^2} \times (SD_1^2 + SD_2^2))/{({\bar X_1} - {\bar X_2})^2}$$
The Shapiro–Wilk test was applied to evaluate the normality of data. Then, the comparison of between-group differences in quantitative and categorical variables was done using χ 2 and independent-sample t tests, respectively. ANCOVA controlling for the baseline values (and BMI changes in the case of analysing changes in ghrelin) was then conducted to explore the impacts of BRBP plus standard diet in comparison with standard diet alone on ghrelin levels, atherogenicity indices and insulin resistance surrogate markers as well as appetite and depression scores. Accordingly, the adjusted means and 95 % CI were demonstrated in the table. The test level for statistical significance was considered as P-value less than 0·05.
Moreover, to assess the effect size (ES) for each outcome, denoted as Cohen’s d(Reference Olamoyegun, Oluyombo and Asaolu42), the mean difference post-intervention was calculated and divided by the overall standard deviation. This calculation yields a standardised measure that reflects the difference between the BRBP plus standard diet group and standard diet group, allowing for a more comprehensive evaluation of the intervention’s impact. The classification of ES based on Cohen’s d values(Reference Olamoyegun, Oluyombo and Asaolu42) includes trivial for d < 0·2, mild for 0·20–0·49, moderate for 0·50–0·79 and large for d > 0·80. Statistical analysis was performed using STATA version 16 (StataCorp LLC).
Results
Sample description
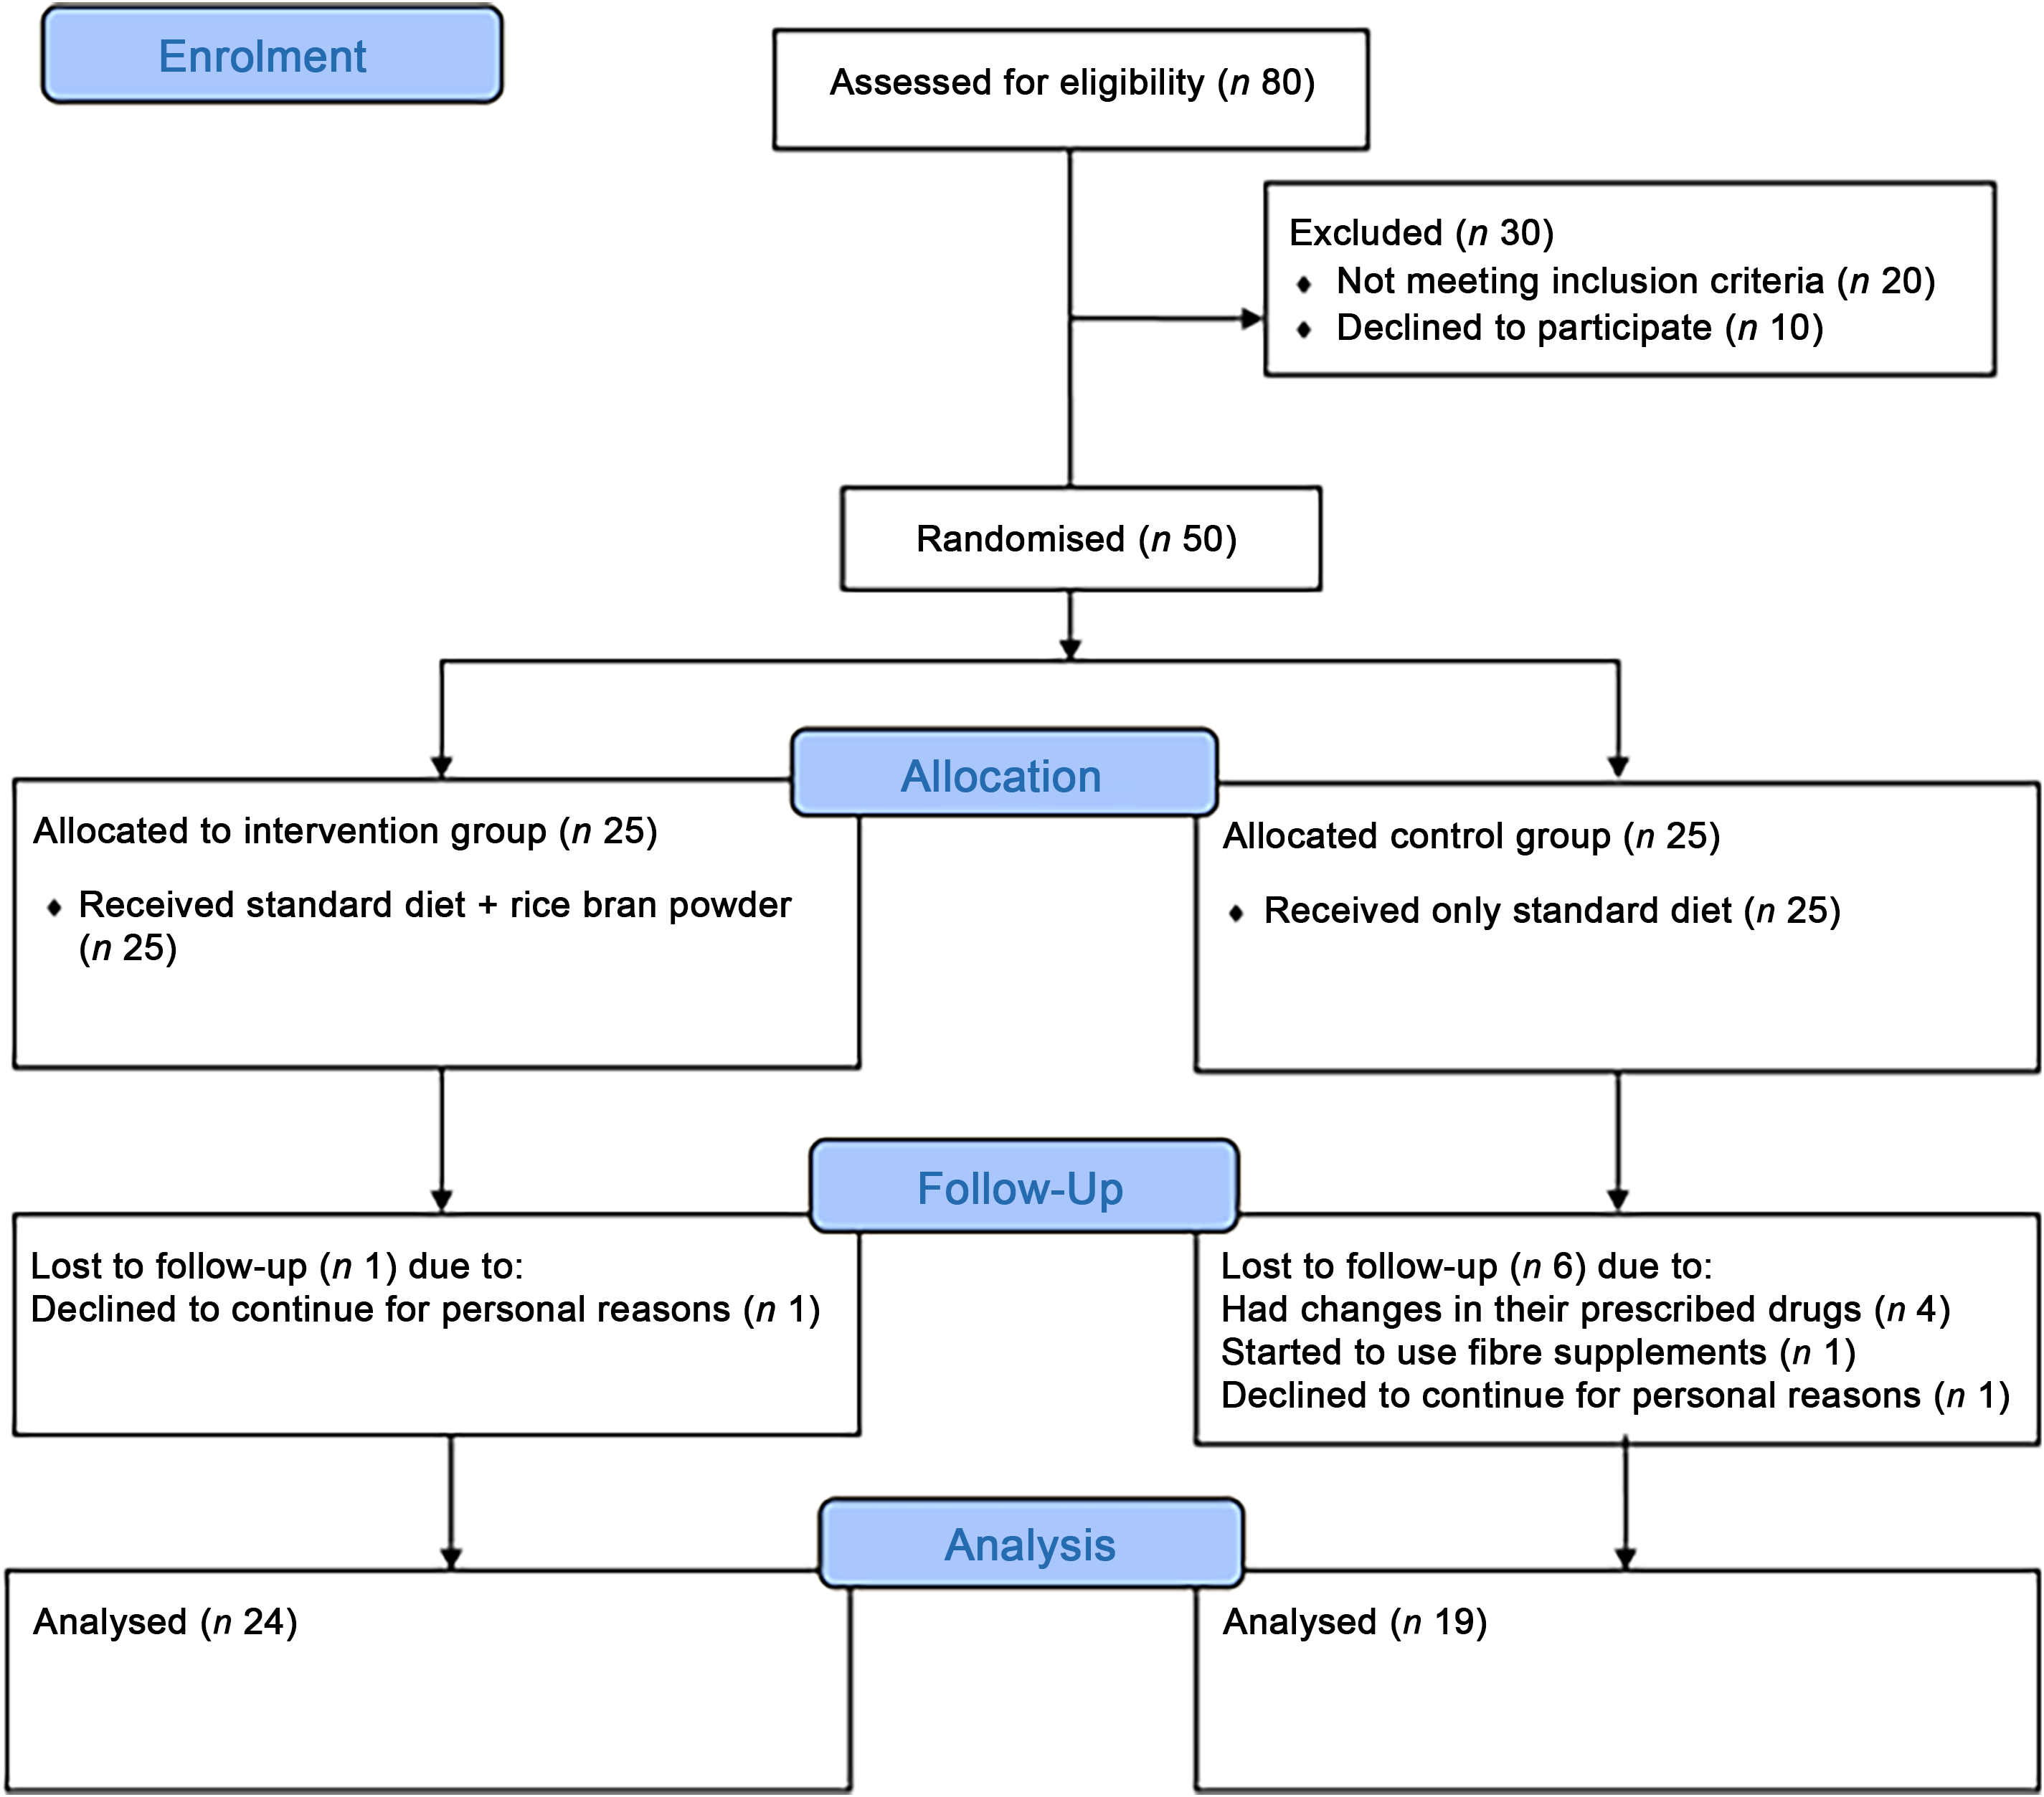
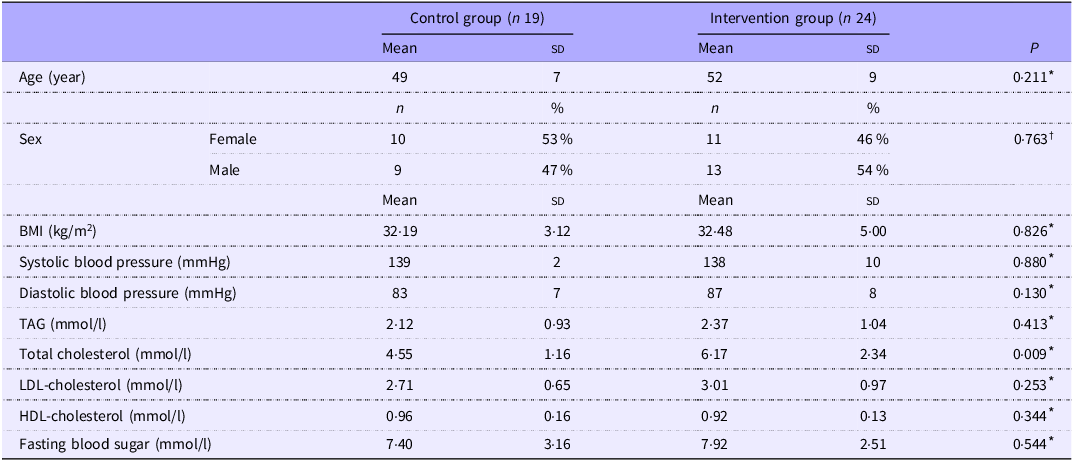
Overall, forty-three patients with MetSyn were analysed in the current investigation, of which twenty-four were treated with BRBP plus standard diet (intervention group) and nineteen only received standard diet plan (Figure 1). Reasons for withdrawal included personal circumstances (one from each group) and modifications to their therapeutic regimens (such as changes in prescribed medications (n 4) or using fibre supplement (n 1)) which affected five individuals in the control group. Detailed attrition data are illustrated in our previous report(Reference Ghorbani, Shoaibinobarian and Zamani29). Approximately half of the participants in both groups were female. The age was homogeneously distributed between two groups and on average was about 49 and 52 years, among control and intervention groups, respectively. The means of BMI of patients in the BRBP plus standard diet and standard diet groups were about 32·19 and 32·48 kg/m2, respectively, with no considerable differences between groups. The mean serum levels of metabolic factors at the enrolment were also equally distributed between the two studied groups, except those patients in the intervention group displayed significantly greater total cholesterol concentrations than the control group subjects (P-value = 0·009) (Table 1).
Flow diagram of studied patients.

Baseline demographic and clinical data of studied patients with metabolic syndrome in a randomised controlled trial of standard diet + rice bran powder v. standard diet alone

Data are reported as mean (sd) unless otherwise specified.
The data presented in the current table have been previously published in reference no. 29, albeit in a slightly different format.
* Independent-sample t test.
† χ 2 test.
Effects of intervention on serum ghrelin and appetite and depression scores
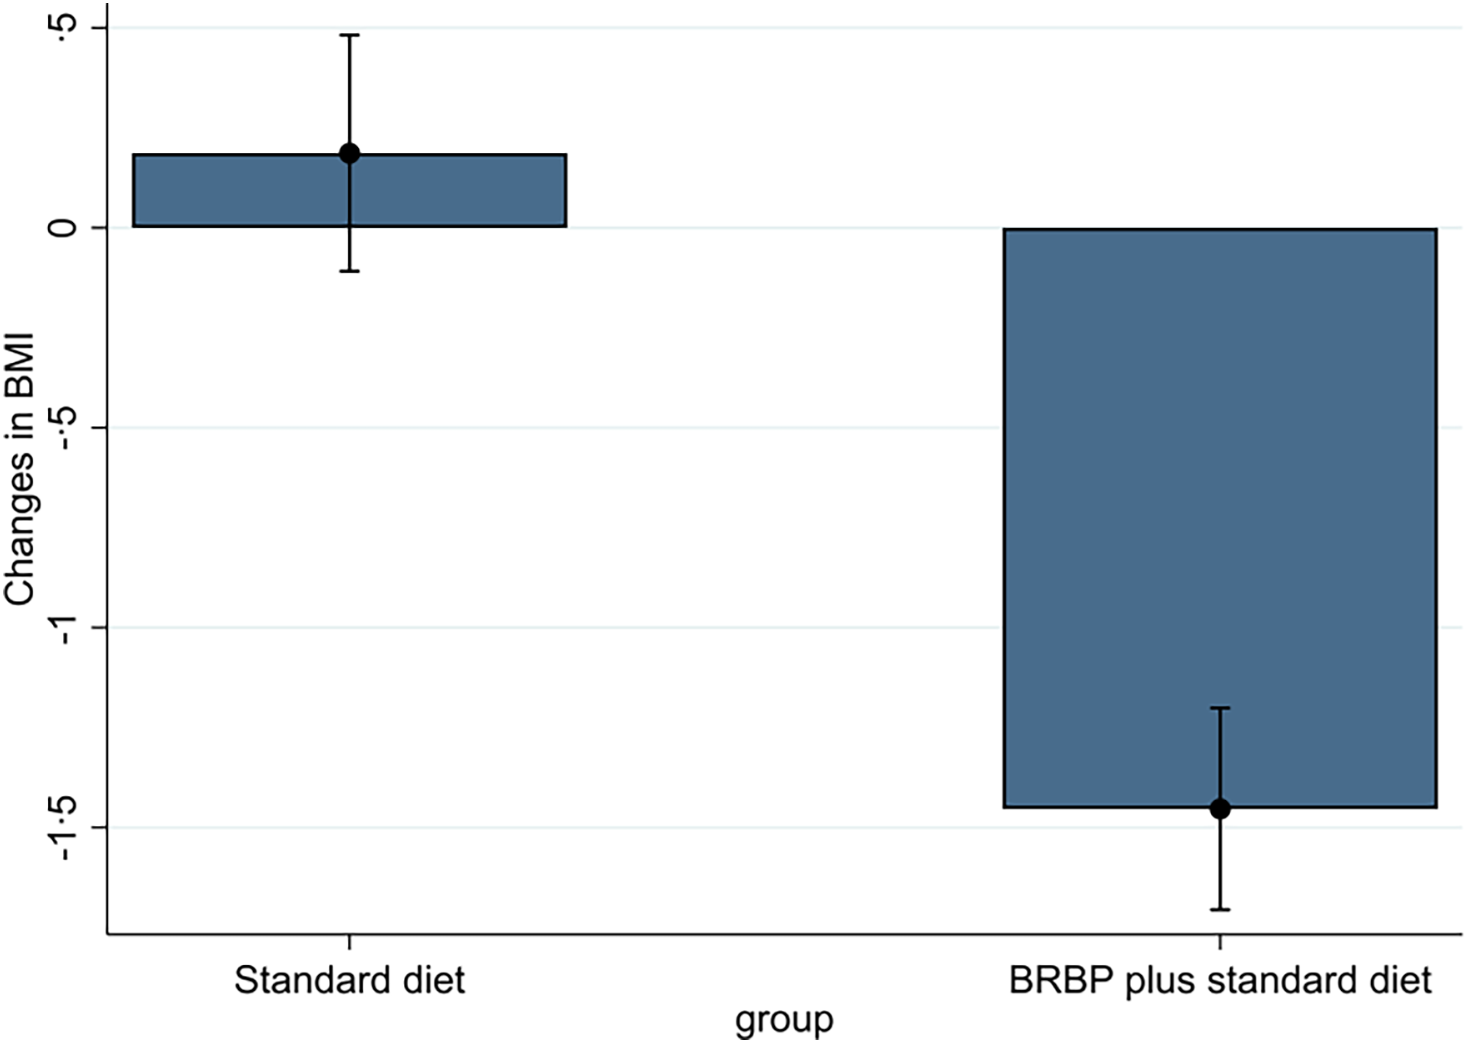
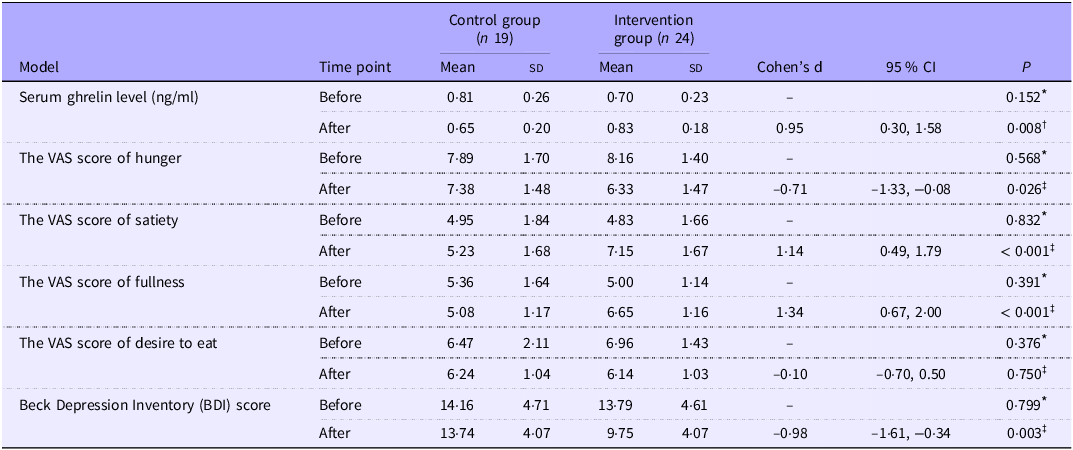
At study enrolment, no significant differences were observed between the groups in the serum levels of ghrelin, scores of feeling hunger, fullness, and satiety sensations, desire to eat, or depression. The detailed findings of the present RCT regarding anthropometric indices including BMI and WC have been published previously(Reference Ghorbani, Shoaibinobarian and Zamani29). Figure 2 highlights the effectiveness of the intervention in reducing BMI relative to the control group. There was a significantly greater reduction in the mean (sd) of BMI changes in the intervention group (–1·45 (1·24)) than in the controls (0·19 (1·29)) (Figure 2). After the 8-week trial, it was found that supplementing the standard diet with 15 g/d of BRBP significantly elevated serum ghrelin levels, with a large ES compared with the standard diet alone (baseline and BMI-adjusted mean (sd): 0·83 (0·18) v. 0·65 (0·20); ES: 0·95 (0·30, 1·58); P-value < 0·008, using ANCOVA) (Table 2).
Bar plot illustrating the mean changes in BMI before and after consumption of brown rice bran powder (BRBP) plus standard diet compared with standard diet alone in a randomised controlled trial on patients with metabolic syndrome. Each bar represents the mean BMI change for the respective group. Error bars indicate the standard error of the mean.

Changes in serum ghrelin, appetite and depression ratings before and after consumption of brown rice bran powder plus standard diet compared with standard diet alone in a randomised controlled trial on patients with metabolic syndrome

VAS, visual analogue scale.
Data are reported as mean (sd) unless otherwise specified.
Cohen’s d effect size: measured as the mean difference in change divided by the pooled standard deviation of the change, based on values adjusted for baseline.
* Independent-sample t test.
† ANCOVA adjusted for baseline values and mean changes in BMI.
‡ ANCOVA adjusted for baseline values.
In the same way, it was shown that compared with the subjects who followed a standard diet, the appetite level of the patients who additionally consumed 15 g/d of BRBP significantly improved, as reflected by moderately lower score of hunger feeling, and largely higher scores of satiety and fullness sensations (hunger baseline-adjusted mean (sd): 6·33 (1·47) v. 7·38 (1·48); ES: −0·71 (–1·33, −0·08); satiety baseline-adjusted mean (sd): 7·15 (1·67) v. 5·23 (1·68); ES: 1·14 (0·49, 1·79); fullness baseline-adjusted mean (sd): 6·65 (1·16) v. 5·08 (1·17); ES: 1·34 (0·67, 2·00); P-value ≤ 0·026, using ANCOVA). However, no meaningful differences were observed in the scores of desire to eat at the study endpoint (Table 2).
Analysing the BRBP effects on depression through comparing the BDI scores of the studied groups revealed that the mean BDI score was considerably and largely lower in the intervention group, as compared with the controls, after the 8-week trial (baseline-adjusted mean (sd): 9·75 (4·07) v. 13·74 (4·07); ES: −0·98 (–1·61, −0·34); P-value = 0·003, using ANCOVA) (Table 2).
Effects of intervention on novel atherogenicity and insulin resistance surrogate indices
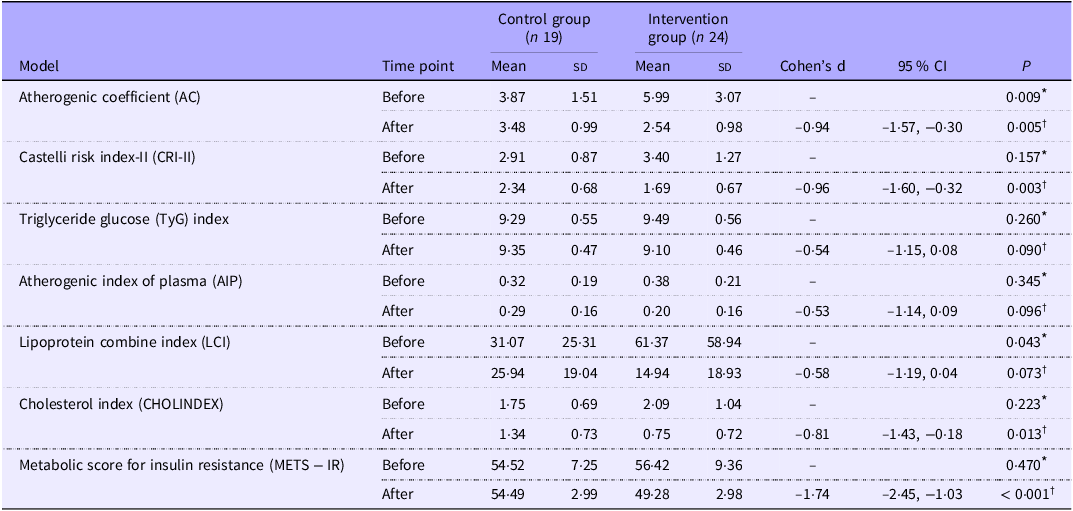
The detailed findings of the present RCT regarding serum lipid and glycaemic parameters have been reported previously(Reference Ghorbani, Shoaibinobarian and Zamani29). Table 3 presents post hoc analysis of changes in atherogenicity indices in patients with MetSyn before and after receiving 15 g/d of BRBP while adhering to the standard diet or following only a standard diet plan in this 8-week RCT. There were no significant differences at the baseline levels of CRI-II, TyG index, AIP, CHOLINDEX and METS-IR between the subjects in both BRBP plus standard diet and control groups. While, in the beginning, the patients in the intervention group were shown to have significantly greater mean values of AC and LCI (P-value < 0·05) (Table 3).
Changes in atherogenicity and insulin resistance indices before and after consumption of brown rice bran powder plus standard diet compared with standard diet alone in a randomised controlled trial on patients with metabolic syndrome

Data are reported as mean (sd) unless otherwise specified.
Cohen’s d effect size: measured as the mean difference in change divided by the pooled standard deviation of the change, based on values adjusted for baseline.
* Independent-sample t test.
† ANCOVA adjusted for baseline values.
At 8th week, the enhancements in the majority of indicators of atherogenicity and insulin resistance were revealed to be more pronounced among the patients who consumed BRBP plus standard diet in comparison with those who only received a standard diet plan. As such, following controlling for baseline levels of the indices in ANCOVA models, these patients demonstrated significantly lower AC, CRI-II, CHOLINDEX and METS-IR levels with large ES than the subjects in the control arm (AC baseline-adjusted mean (sd): 2·54 (0·98) v. 3·48 (0·99), ES: −0·94 (–1·57, −0·30); CRI-II baseline-adjusted mean (sd): 1·69 (0·67) v. 2·34 (0·68), ES: −0·96 (–1·60, −0·32); CHOLINDEX baseline-adjusted mean (sd): 0·75 (0·72) v. 1·34 (0·73), ES: −0·81 (–1·43, −0·18); METS-IR baseline-adjusted mean (sd): 49·28 (2·98) v. 54·49 (2·99), ES: −1·74 (–2·45, −1·03)) (P-value ≤ 0·013) (Table 3). In addition, marginally significant differences were noted in TyG index and LCI levels between the two studied groups following an 8-week intervention. Patients in the BRBP within standard diet group had a tendency of having moderately lower levels compared with the control group with moderate ES than the subjects in the control arm (TyG baseline-adjusted mean (sd): 9·10 (0·46) v. 9·35 (0·47), ES: −0·54 (–1·15, 0·08); LCI baseline-adjusted mean (sd): 14·94 (18·93) v. 25·94 (19·04), ES: −0·58 (–1·19, 0·04)) (P-value < 0·1) (Table 3).
Discussion
The findings of this secondary analysis demonstrate that an 8-week supplementation with 15 g/d of BRBP within a standard diet elicited a multifaceted beneficial response in individuals with MetSyn. Notably, we observed a significant increase in serum ghrelin levels, concomitant with improved subjective appetite ratings (reduced hunger, increased satiety and fullness), reduced depression scores, and improved atherogenic and insulin resistance indices.
The most intriguing finding of our study is the significant increase in total ghrelin levels following BRBP supplementation, which appears counterintuitive given its role as a hunger-stimulating hormone. However, this finding seems to partly align with the established physiology of ghrelin as a counter-regulatory hormone sensitive to energy balance(Reference Fahed, Aoun and Bou Zerdan4–Reference Skoracka, Hryhorowicz and Schulz12,Reference Triffoni-Melo, Castro and Jordão45–Reference Kim, Park and Park47) . Partly similar to our findings, Kim et al. (2024)(Reference Kim, Park and Park47) in a recent double-blind, placebo-controlled, crossover trial emphasise that specific fibres from barley rich in the soluble fibre β-glucan significantly improved subjective appetite measures using the VAS scores, lowered hunger and increased satiety and fullness scores compared with a placebo after 60 min; however, these findings did not correspond with significant changes in the physiological markers ghrelin and peptide YY (PYY)(Reference Kim, Park and Park47). Interestingly, while the BDF group had higher absolute ghrelin levels 60 min after glucose loading (807·5 ± 48·7 pg/ml v. 713·8 ± 40·4 pg/ml in the placebo group), the hormone’s dynamic pattern of postprandial decrease was maintained. The authors attributed the enhanced satiety not to ghrelin suppression alone but to a synergistic increase in anorexigenic hormones like PYY. This highlights that the net effect on appetite is determined by the balance between orexigenic and anorexigenic signals, and fibre may favourably shift this balance(Reference Kim, Park and Park47). Our results also align with another study reporting intake of modified oat bran led to a considerable mitigation in the serum concentration of ghrelin among twenty healthy individuals(Reference Juvonen, Purhonen and Salmenkallio-Marttila46). However, Wang et al. in 2023 indicated that a diet with 20 % wheat bran in sows could decrease the levels of ghrelin(Reference Wang, Wang and Xu48). Besides, in contrast to the present findings, another RCT conducted by Triffoni-Melo in 2023 on obese women on a short-term, high-fibre, calorie-restricted diet (1000 kcal/d) showed that such a diet has suppressed postprandial (after 60 min) acylated ghrelin but not total ghrelin(Reference Triffoni-Melo, Castro and Jordão45). However, it should be noted that this trial indicated the significant decrease in postprandial acylated ghrelin, and not total fasting ghrelin levels(Reference Triffoni-Melo, Castro and Jordão45). There are also a number of studies that failed to show significant changes in ghrelin levels in thirty-four Filipino subjects following consumption of brown rice in a trial study conducted by Golloso-Gubat et al. in 2016(Reference Golloso-Gubat, Magtibay and Nacis49). Wolever et al. in 2020 also reported that increasing the viscosity of oat β-glucan in a breakfast failed to exert a promising effect on the ghrelin concentration(Reference Wolever, Tosh and Spruill50). Inconsistencies in the standardisation of ghrelin level measurements, such as the timing of sample collection, collection methods, follow-up periods, sample storage and the RIA employed, could affect the precision and reproducibility of the findings. Besides, although ghrelin hormone has two forms including des-acylated ghrelin and acylated ghrelin(Reference Makris, Alexandrou and Papatsoutsos6), to the best of our knowledge, except for the study by Triffoni-Melo et al(Reference Triffoni-Melo, Castro and Jordão45), none of the others specifically focus on measuring the active form of ghrelin; instead, total ghrelin levels are typically assessed. Future research must measure acyl-ghrelin to clarify its specific dynamics in response to BRBP.
It should be noted that lower serum concentration of ghrelin has been linked to the progression of hyperglycaemia, insulin resistance, diabetes mellitus and hypertension, particularly in obese populations(Reference Kim, Nam and Shin7,Reference Jabbari, Kheirouri and Alizadeh9,Reference Koliaki, Kokkinos and Tentolouris51–Reference Cummings, Weigle and Frayo54) . Although there are several hypotheses have been explored in the recent studies, none of them report the accurate mechanism regarding the reduction of ghrelin levels in patients with metabolic disturbances. The most recent affirmed hypothesis suggests that hyperinsulinemia and hyperglycaemia may inhibit the secretion of ghrelin. This relationship could contribute to the lower ghrelin levels observed in obese individuals and those who suffer from insulin resistance-associated metabolic disorders, particularly MetSyn(Reference Kim, Nam and Shin7,Reference Jabbari, Kheirouri and Alizadeh9,Reference Koliaki, Kokkinos and Tentolouris51–Reference Cummings, Weigle and Frayo54) . Interestingly, there is a complex inverse relationship between ghrelin and BMI. Ghrelin levels tend to be lower in individuals with obesity and higher in lean individuals, including those with anorexia nervosa, suggesting a counter-regulatory signal to prevent further weight gain in obesity(Reference Schaefer, Kühnel and Enge10,Reference Gajewska, Strzelecki and Gawlik-Kotelnicka11) . In our initial analysis of the same RCT(Reference Ghorbani, Shoaibinobarian and Zamani29), greater reductions in anthropometric measurements, specifically BMI and WC, were noted compared with the controls. These findings likely triggered a compensatory rise in ghrelin, an evolutionary adaptation to defend body weight and promote energy intake(Reference Kim, Park and Park47). To account for this dynamic in our analyses, we controlled the ANCOVA models examining BRBP effects on serum ghrelin for changes in BMI over the trial. Hence, the observed increase in serum ghrelin levels following BRBP consumption also reflects adjustment for BMI changes.
It should be borne in mind that ghrelin secretion is not merely responsive to short-term fasting but also adapts to long-term changes in energy balance(Reference Triffoni-Melo, Castro and Jordão45). Hence, this compensatory mechanism is well documented in weight-loss interventions, where elevated ghrelin poses a significant challenge to long-term weight maintenance by promoting hyperphagia and potential weight regain(Reference Triffoni-Melo, Castro and Jordão45). Crucially, our trial showed that, despite the rise in ghrelin, participants reported markedly improved appetite control. Alongside the ghrelin elevation, BRBP participants reported lower hunger and greater satiety and fullness than those following the standard diet (ES: d = –0·71 for hunger, d = 1·14 for satiety, d = 1·34 for fullness). This pattern aligns with a countervailing influence of BRBP on perceived appetite despite ghrelin elevation. Supporting this, Golloso-Gubat et al. found that 6 weeks of brown rice consumption reduced feelings of hunger and increased satiety compared with white rice in healthy participants(Reference Golloso-Gubat, Magtibay and Nacis49).
This discrepancy highlights the complex nature of appetite regulation, which involves not only circulating hormone levels but also neural pathways, sensory cues and psychological factors. It suggests that the net effect on appetite is determined by the balance between orexigenic signals (e.g. ghrelin) and anorexigenic signals (e.g. PYY and glucagon-like peptide-1)(Reference Schaefer, Kühnel and Enge10,Reference Gajewska, Strzelecki and Gawlik-Kotelnicka11,Reference Kim, Park and Park47) . Additional factors may contribute to subjective sensations of hunger and satiety independently of ghrelin and PYY, including individual variability in hormone sensitivity and postprandial metabolic responses, where some individuals experience satiety at lower hormone concentrations and others require higher levels to perceive similar effects(Reference Schaefer, Kühnel and Enge10,Reference Gajewska, Strzelecki and Gawlik-Kotelnicka11,Reference Kim, Park and Park47) .
We postulate that improving appetite sensation by BRBP in the current study may predominantly be attributed to the satiety-promoting properties of the bran layer of rice owing to slowing down the rate of gastric emptying and tending to prolong the process of nutrient absorption during digestion. Moreover, SCFA, resulting from the fibre fermentation of brown rice bran, could induce prolonged gastric emptying and elevate feelings of satiety(Reference Bornhorst, Chang and Rutherfurd55–Reference Salari, Mahdavi-Roshan and Kheirkhah60). Moreover, brown rice bran may be able to stabilise the serum level of glucose and consequently inhibit the production of acyl-ghrelin, which influences the hypothalamus to stimulate hunger sensation(Reference Chang, Hong and Jung61–Reference Delhanty, Neggers and Van der Lely63). However, acknowledging the subjective nature of appetite ratings, it remains unclear whether the rise in ghrelin levels reflects a normalisation of dysregulated ghrelin dynamics in patients with MetSyn or supports the hypothesis that elevated ghrelin following weight loss may exacerbate difficulties in sustaining long-term weight loss, thus contributing to the high failure rates commonly associated with dietary interventions aiming to reducing weight(Reference Makris, Alexandrou and Papatsoutsos6,Reference Thom, McIntosh and Messow64) . Nonetheless, given the limited understanding of the impact of BRBP on ghrelin levels and appetite ratings, further research is necessary to elucidate this relationship in greater detail.
Additionally, considering the findings of the current intervention on depression status of the studied subjects, it was indicated that the patients who received BRBP in addition to the standard diet plan tended to have a largely lower BDI score after following an 8-week intervention compared with the patients who only followed a standard diet plan (large ES: −0·98). A number of studies have also achieved similar results(Reference Mamiya, Kise and Morikawa65,Reference Um, Kim and Yoon66) . An animal study highlighted that consumption of pre-germinated brown rice for 30 d accounted for a significant antidepressant effect in male mice through increasing the level of serotonin and reduction in the ratio of 5-hydroxyindoleacetic acid/5-hydroxytryptamine(Reference Mamiya, Kise and Morikawa65). Such results were also confirmed in another in vivo research for mice with chronic restraint stress-induced depression(Reference Um, Kim and Yoon66). Moreover, brown rice bran is abundant in γ-oryzanol, n-3 fatty acid and vitamin E, which are suggested to provide antidepressive, antihypertensive and antioxidant effects. Thus, our current conclusion regarding the reduction of depressive symptoms may be explainable according to the antidepressant impacts of brown rice bran(Reference Mehdi and Haleem67,Reference Lindqvist, Dhabhar and James68) . With respect to the possible mechanism, brown rice bran may contribute to normalising the hyperactivity of the hypothalamic–pituitary–adrenal axis, reducing the expression of monoamine oxidase, sustaining the serum levels of monoamine and alleviating the secretion of dopamine, norepinephrine and serotonin(Reference Um, Kim and Yoon66). Experimental studies additionally suggest that higher ghrelin levels, similar to when it is injected under the skin, may help reduce anxiety and depression. This increase in ghrelin, often together with energy-restricted diets, might contribute to the currently observed antidepressant effects of BRBP(Reference Kim, Nam and Shin7,Reference Gajewska, Strzelecki and Gawlik-Kotelnicka11,Reference Lutter, Sakata and Osborne-Lawrence14) .
With respect to the efficacy of BRBP on novel atherogenicity and insulin resistance indicators, the current findings showed that AC, CRI-II, CHOLINDEX and METS-IR levels (indices primarily based on cholesterol or fasting blood sugar ratios) most likely reduced following receiving 15 g/d of BRBP plus standard diet in comparison with the MetSyn participants who exclusively followed standard diet plan (large ES: −0·94, −0·96 and −0·81, respectively). Regarding other parameters, including TyG index and LCI, which appeared to mainly related to TAG levels, the estimated ES indicated a medium improving effect following consuming 15 g/d of BRBP plus standard diet compared with the standard diet alone (moderate ES: −0·54, −0·53 and −0·58, respectively), though the between-group comparisons demonstrated marginally significant differences (P-value < 0·1). The comparatively modest changes in TAG-related indices, which align with our earlier findings(Reference Ghorbani, Shoaibinobarian and Zamani29), likely reflect the temporal sequence of improvements, wherein insulin resistance improves before TAG metabolism fully normalises. Although to the best of our knowledge there is no similar trial in which the levels of atherogenicity and insulin resistance surrogate markers are investigated following BRBP supplementation, these results are at least partly in accordance with the available evidence indicating lipid-lowering impact of rice bran(Reference Ito, Nakashima and Matsuoka44,Reference Saphyakhajorn, Sirirat and Sapwarobol69–Reference Li, Borresen and Jenkins-Puccetti75) . It can be mentioned that administration of BRBP, as a functional food, with standard diet might exert a favourable effect on managing lipid profile and improve insulin resistance due to its high quality of nutraceutical components including vitamin E (tocotrienols and tocopherols), γ-oryzanol and fibre. Compelling evidence proposed a significant role of γ-oryzanol in ameliorating atherogenic status through various ways such as controlling the lipogenic enzyme activities and elevating the faecal excretion of bile acids and cholesterol. In addition, experimental investigations have suggested that brown rice bran contributed to the decrease of serum level of insulin and Homeostatic Model Assessment of Insulin Resistance score and augmented sensitivity to insulin. Brown rice bran may also be able to stimulate the expression of glucose transporters-4 and 5 (GLUT-4 and GLUT-5) as well as ameliorate insulin receptor activity and insulin receptor substrate-1. Remarkably, SCFA generated from the fermentation of BRBP fibre by beneficial gut bacteria can influence the balance of lipids and glucose in the liver. Additionally, these SCFA can serve as precursors for cholesterol, ultimately leading to a reduction in cholesterol synthesis. Impressively, studies suggest that ghrelin may be involved in promoting the breakdown of fats while simultaneously inhibiting insulin secretion. Consequently, in individuals with MetSyn who particularly exhibit signs of insulin resistance, higher levels of ghrelin might encourage a reduction in insulin production and facilitate greater fat breakdown. Accordingly, the observed result of a rise in ghrelin levels following BRBP plus standard diet could also contribute to alleviating insulin resistance and improving insulin sensitivity(Reference Sarker and Rahman23,Reference Sapwarobol, Saphyakhajorn and Astina24,Reference Sivamaruthi, Kesika and Chaiyasut26,Reference Sivamaruthi, Alagarsamy and Thangaleela27,Reference Tsaban, Yaskolka Meir and Zelicha53,Reference Mahdavi-Roshan, Salari and Kheirkhah59,Reference Hundemer, Nabar and Shriver76–Reference Mohamed, Ahmed and Abd Elbast78) .
Clinical relevance of the current findings
The findings from this 8-week study indicate that consuming 15 g/d of brown rice bran (approximately one tablespoon in powder form) within a standard dietary plan could be a promising therapeutic tool for the complementary management of MetSyn. Its ability to significantly enhance subjective appetite regulation (effectively decoupling ghrelin levels from hunger perception) might directly address a key barrier to dietary adherence. Furthermore, concurrent improvements in atherogenic risk profiles, insulin resistance surrogate markers and depressive symptoms would position BRBP as a multi-targeted intervention capable of addressing several core facets of MetSyn simultaneously.
Future direction
According to the current findings, a high-fibre intervention such as BRBP holds promise for obesity and MetSyn management by increasing satiety even when ghrelin levels rise, a pattern that might often be observed after weight loss and thought to complicate long-term weight maintenance. To build a robust evidence base for these effects, future research should address several key areas. First, extended, well-designed placebo-controlled trials (using matched bran-free powder) that include participants without MetSyn are needed to track both active (acylated) and inactive (des-acylated) ghrelin forms beyond the intervention period. Building on this, studies should adopt a multifaceted strategy including measuring a broad array of appetite-regulating hormones (e.g. glucagon-like peptide-1, leptin, PYY and GIP), evaluating potential improvements in central ghrelin sensitivity and determining whether favourable appetite and ghrelin dynamics persist over the long term. Additionally, future work should investigate the microbiome’s role in mediating these effects by examining fibre-driven shifts in gut microbial communities and SCFA production. Finally, broadening investigations to include populations without MetSyn will be essential to enhance the generalisability of the findings.
Strengths and limitations
This study has several notable strengths. To our knowledge, there is no similar trial aiming to assess the effects of BRBP administration on appetite and weight-regulating pathways. In addition, a face-to-face interview for each single subject was performed by our study dietitian, and each participant received a customised standard diet. The focus on BRBP is particularly relevant for the Iranian population, as the study was conducted in Guilan province (a major rice-producing region), making it an inexpensive and culturally pertinent dietary intervention.
However, the findings must be considered in light of several limitations. The open-label design, which lacked a placebo control, alongside the short 8-week intervention period, may constrain the interpretation of the results. Although we employed strategies to mitigate confounding, including randomisation, dietary standardisation and ANCOVA models adjusted for baseline values and BMI (in the case of serum ghrelin analysis), the potential for residual confounding persists including physical activity, smoking and medication effects. Additional limitations include the reliance on self-reported appetite and depression assessment data, which are subjective and susceptible to bias. Future studies would benefit from incorporating objective biomarkers. Finally, the hormonal analysis was restricted to ghrelin, omitting other critical appetite regulators like leptin, PYY, glucagon-like peptide-1 and GIP, which provides an incomplete metabolic picture. Consequently, these results should be interpreted with caution.
Conclusion
In summary, this secondary analysis reveals that an 8-week open-label trial delivering 15 g/d BRBP within a conventional diet elicits a multifaceted beneficial response in individuals with MetSyn. The most intriguing finding is a significant increase in serum ghrelin levels, which occurred alongside markedly improved subjective appetite ratings (reduced hunger, increased satiety and fullness). Beyond appetite, BRBP supplementation yielded significant improvements in depression scores and key metabolic indices, including novel markers of atherogenicity (AC and CRI-II) and insulin resistance (METS-IR). These effects are likely mediated through BRBP’s rich bioactive composition, including dietary fibre, γ-oryzanol and vitamin E complexes, which may influence gut–brain axis signalling, metabolic function and neuroregulation. Practically, BRBP emerges as an inexpensive, culturally appropriate and effective functional food adjuvant to standard dietary therapy for MetSyn. It offers a promising strategy to improve metabolic health, enhance satiety and support psychological well-being, thereby potentially improving long-term adherence to weight management plans. Nevertheless, given the study’s limitations, namely the small sample size and the absence of a placebo control, further research is needed to elucidate these effects in greater detail. Future research should prioritise longer-term, placebo-controlled trials that include a full panel of appetite hormones (including acylated ghrelin, leptin, PYY and glucagon-like peptide-1) and objective biomarkers to fully elucidate the mechanisms behind these compelling clinical benefits.
Acknowledgements
The authors would like to thank the Giltaz Company, which donated the powders with no conflict of interest. The donating company was not involved in study design, acquiring data, statistical analysis, results interpretation or publication. None of the authors had any affiliation with this company. The authors also extend their gratitude to the patients who participated in the study as well as Ms Nargeskhatoon Shoaibinobarian for her kind cooperation in baseline data collection.
This study was financially supported by Guilan University of Medical Sciences, Rasht, Iran (registered with research number 71213; 3734).
None of the authors have any conflict of interest to disclose.
M. M-R. and Z. Gh.: conceptualisation, funding acquisition, methodology, project administration and supervision. Z. Gh. and F. D.: formal analysis, validation, visualisation and writing the original draft. M. M-R., E. Z., A. S., P. P., Z. A., Z. Gh. and F. D.: methodology, investigation and resources. Z. Gh., M. M-R., F. D., E. Z., A. S., P. P. and Z. A.: writing review, editing and approving the final draft.