Introduction
Sprayers have revolutionized the agriculture industry by allowing the famers to control weeds, disease, and pests resulting in increased harvestable yields (Razali, Reference Razali2012). Smart spraying systems use selective spraying methods in which crop, plant, weed and disease information is obtained by sensors to control nozzles for real-time spot-spraying. The control systems typically make decisions based on input from the sensors and adjusts the output spray based on a computer algorithm. Smart sprayer technology has benefits such as; uses water more efficiently, less agrochemical wasted in non-target areas, more environmentally friendly (from less agrochemical being applied), reduction in soil erosion and potential for an increased yield. Spot-application of agrochemical using a smart sprayer has great potential to achieve high yield, with potentially lower risk to the environment compared to conventional spraying methods. A variety of smart spraying methods for spot-specific herbicide application have been developed and tested to reduce production costs and to ensure environmental sustainability. WeedSeeker® (NTech Industries, Inc., Ukiah, CA, USA) is a common spraying system that is able to target and spray green foliage, however, it is limited to use with the detection of green foliage (Rizzardi et al., Reference Rizzardi, Prostko, Rains, Vellidis and Morari2007). Percival et al. (Reference Percival, Brown and Harrington2014) used WeedSeeker® Model 650 sensors mounted on a 6.1 m wide boom sprayer to target and spray weeds during spring pre-emergence and fall post-emergent herbicide applications within wild blueberry fields. The sprayer was also used to apply fungicide saving 16.7 to 26.7% agrochemical by shutting off nozzles in bare-soil areas.
Esau et al. (Reference Esau, Zaman, Chang, Schumann, Percival and Farooque2013) developed and tested a prototype variable rate sprayer with a machine vision sensor boom located in front of an all-terrain vehicle for small scale spot-applications of agrochemical in wild blueberry fields using a 6.1 m wide sprayer boom. Esau et al. (Reference Esau, Zaman, Chang, Groulx, Schumann and Farooque2014a) developed and tested a prototype variable-rate sprayer with a machine vision system located in front of a farm tractor for large scale spot-application of herbicides in wild blueberry using a 12.2 m wide sprayer boom mounted behind the tractor. Esau et al. (Reference Esau, Zaman, Groulx, Chang, Schumann and Havard2014b) modified a smart sprayer to operate with a machine vision system mounted on the rear sprayer boom and compared the target detection and spraying accuracy with the older version of sprayer equipped with front mounted sensor boom. The authors suggested that the rear mounted machine sensor boom was a superior system with reduced positioning error and lower construction and material costs and should be tested for a wider range of agrochemical applications.
Wild blueberries are a naturally grown crop that are native to North Eastern North America. Annis and Stubbs (Reference Annis and Stubbs2004) showed a significant reduction in fruit production in stems with disease as compared to healthy plants. Foliar diseases Septoria leaf spot and blueberry rust have also caused a reduction in wild blueberry yields (Percival and Dawson, Reference Percival and Dawson2009). The application of chlorothalonil (Bravo®) and Boscalid/ pyraclostrobin (Pristine™) fungicide have found to lower Septoria leaf spot and blueberry rust. This application resulted in an increased harvestable yields of 13.3% over the non-treated control (Percival and Dawson, Reference Percival and Dawson2009). Percival and Burnham (Reference Percival and Burnham2013) found that proper fertilizer and fungicide use prolonged wild blueberry leaf retention and suppressed foliar pathogens resulting in an increased harvestable yield. In Georgia more than 80% of the blueberry producers frequently apply fungicides to control disease resulting in increased yields (Scherm et al., Reference Scherm, NeSmith, Horton and Krewer2001).
Materials and methods
Development of rear mounted machine vision system on smart sprayer
A smart sprayer integrated with rear boom mounted machine vision technology, image processing software and control system, was achieved for agrochemical application in wild blueberry fields (Fig. 1). The smart sprayer system consisted of nine digital color cameras (UI-1220SE/C, IDS Imaging Development System Inc., Woburn Mass., USA) connected to a 2.8-GHz Intel® Core™ i7-860 CPU and 4 GB RAM computer via USB 2.0 active link cables (Sabrent CB-USBXT, Miami, Fla., USA). Image processing software specifically designed for applications in wild blueberry fields processes each image and sends triggering information to a 12 VDC relay switch box that powers the appropriate solenoid valve opening the spray nozzles in the specific section that the target was initially identified. An on-board flow regulating system allows the line pressure to stay constant while turning on/ off different combinations of nozzles.
Smart sprayer for spot-specific application of agrochemical.

Image processing
Image processing algorithms were developed and tested primarily for use with the specific agrochemical applications suited for the wild blueberry industry. During spring and fall herbicide applications weeds can typically be targeted using the color contrast between the green target weeds and the reddish brown background wild blueberry plants and soil surface. Further details of the sensing system using digital photography technique can be found in Chang et al. (Reference Chang, Zaman, Esau and Schumann2014). During in season herbicide and fungicide applications texture analysis is required to help differentiate between the wild blueberry plants and weed species that are typically similar in color. Nine µEye cameras were equally spaced at 1.52 m apart and each cover the area for control of three spray nozzles. Each image was broken into three sections (0.51 m wide by 0.914 m tall) for individual nozzle control. The cameras were positioned on the sprayer boom to maintain a height of 1.2 m off the ground surface to enable the images from each camera to cover the complete boom width without over or under lapping. The cameras were positioned 0.18 m in front of the spray nozzles. Each image represents an area on the ground surface equal to 1.52 m wide by 0.914 m tall. For rapid image processing only the front portion (1.52 m by 0.28 m) of the image is used and the remainder is disregarded. The image acquisition time was found to be 0.015 s. The processing time required for the PC to analyze the nine images simultaneously was 0.135 s. An additional 0.052 s time delay was required for the PC to send a triggering signal to turn on the solenoid valve and spray. The maximum travel speed while spraying was 1.77 m s-1.
Field Experiment
The smart sprayer was tested for fungicide application performance at the Middle Road field (45.425706, -63.497650) in Debert, Nova Scotia, Canada. During the time of selection, the field was in the vegetative sprout year of the biennial crop production cycle. The field was well-developed and had been commercially managed using traditional growing practices over the past decade. Conventional rates of fungicide for disease control, herbicide for weed management and insecticide for pest control were applied. Bravo® and Proline® fungicides are tank mixed and applied to protect the plants from disease that could potentially reduce yield in the field. TruPhos Magnesium (29% phosphoric acid, 5% soluble potash and 4% magnesium) and ZincMax (10.2% zinc and 0.5% boron) foliar fertilizers were also tank mixed with Bravo® and Proline® fungicides to increase the plants nutrient supply with the hopes to increase yield. An RTK-GPS was used to manually map the field boundary and bare soil areas in the field. The total field size was 5.26 ha and nine tracks each 75 m long were marked with flags. The nine test tracks were broken into three replications of three different application techniques [control (CN) – 0.0 L ha-1 Bravo®/ Proline®/ TruPhos Magnesium / ZincMax; uniform applicaiton (UA) – 4.94 L ha-1 Bravo®, 0.35 L ha-1 Proline®, 3.71 L ha-1 TruPhos Magnesium, 1.24 L ha-1 ZincMax; spot-application (SA) – 4.94 L ha-1 Bravo®, 0.35 L ha-1 Proline®, 3.71 L ha-1 TruPhos Magnesium, 1.24 L ha-1 ZincMax applied only to foliage areas].
On July 21, 2014 the smart sprayer was used to apply the treatment application to each test track. The temperature during the time of application was 25.5 °C with a relative humidity of 47%. The average wind speed was 10 km h-1 directed to the North (Environmental Canada Weather Archive). A mixing station was used to properly mix the two fungicide and two liquid foliar fertilizer blends together. The ground speed during the field application was 6±0.2 km h-1. The fungicide application rate was set to 4.94 L ha-1 Bravo®, 0.35 L ha-1 Proline®, 3.71 L ha-1 TruPhos Magnesium and 1.24 L ha-1 ZincMax with a total flow volume of 187.1 L ha-1. The total amount of agrochemical was recorded from the display screen on the flow controller after completion of each track. The agrochemical application amounts were used in combination with the percent bare soil coverage to determine the amount of agrochemical savings that was achieved from each test track. Ten randomly selected locations within each track were marked using a field stake and the position was recorded using an RTK-GPS for use for plant parameter data collection.
On October 9, 2014 a 16-megapixel Fujifilm finePix HS30EXR digital color camera was used to visually record the effect of Bravo® and Proline® fungicide and foliar fertilizers on plant growth and leaf retention. The camera was pointed downward at a height of 1.0 m above the ground to capture a digital image from each of the ten plots within each track. A wooden frame measuring 0.5×0.5 m was placed on the ground beforehand to identify the area where the image was to be taken. The 90 images were randomly numbered and saved on a memory stick. Five different classes were developed based on plant leaf retention [(a)-complete leaf defoliation, (b)-partial leaf defoliation, (c)-no leaf defoliation (mostly red plants), (d)-no leaf defoliation (red/green plants), (e)-no leaf defoliation (mostly green plants)] (Fig. 2). The images were given to five people who separated each the images into one of the five classes based on their visual observation of the leaf retention. The results were averaged and converted to a percentage of leaf retention per image. The data was checked for normality and constant variance. The minimum, maximum, mean and S.D. of the percent of healthy plants for all applications were determined using Minitab®. The mixed-model procedure at 5% level of significance was used to test the significance of the treatments. LS means comparison was used to determine if the visual plant leaf retention varied with the treatment methods (SA, UA and CN).
Wild blueberry plant leaf retention classification chart used to rank the digital images taken of the plots from each track [(a)-complete leaf defoliation, (b)-partial leaf defoliation, (c)-no leaf defoliation (mostly red plants), (d)-no leaf defoliation (red/green plants), (e)-no leaf defoliation (mostly green plants)].

On December 22, 2014 plant growth parameters were measured from the ten plots within each of the nine tracks to assess the effect of Bravo®, Proline® and foliar fertilizer. A wooden quadrat measuring 0.15×0.15 m was used to mark out the area for stem density measurements. Six blueberry stems from each 0.15×0.15 m sample area were randomly cut using a knife to measure the stem height, stem diameter, number of branches, and number of floral buds. The six recordings taken from each quadrat were averaged to show the number per stem. Classical statistics was used to calculate minimum, maximum, mean and S.D. using Minitab®. ANOVA and LS means with 95% confidence interval was performed to examine and compare the effect of Bravo®, Proline® and foliar fertilizer on the plant parameters with SA, UA and CN.
The wild blueberry yield was manually harvested on August 20, 2015 using a 36 tooth hand rake from within a 0.5×0.5 m wooden quadrate at each of the ten plots in each track to assess the effect of the fungicide and fertilizer tank mix on harvestable yield. The blueberries were collected from the vine as well as any blueberries that dropped onto the ground. The collected yield and leaf debris samples were packaged in a sealed plastic bag and later separated and weighed at the DAL-AC lab. Classical statistics was used to calculate minimum, maximum, mean and S.D. using Minitab®. ANOVA and LS means with 95% confidence interval was performed to examine and compare the effect of Bravo®, Proline® and foliar fertilizer on harvestable yield with SA, UA and CN.
Results
Visual observation from the field tests as well as an applied map recorded during the time of application indicated that the smart sprayer performed well for spot-application of agrochemical on foliage and shutting the nozzles off in bare soil zones in the test tracks. The image processing software could be modified to be less sensitive to detecting small foliage areas however, it is best to have the smart sprayer target all areas of foliage so nothing is missed to ensure that the blueberry plants are well protected from disease. The CN tracks did not have agrochemical applied so no polygons were recorded during travel.
Each test track had a total area of 1027.5 m2. SA tracks 3, 4, and 6 had 116.0 m2, 177.5 m2, and 97.4 m2, bare soil coverage, respectively. UA tracks 2, 5, and 8 had similar bare soil coverage; 101.2 m2, 110.7 m2, and 120 m2, respectively. Flow controller data showed the SA of Bravo®, Proline® and foliar fertilizer savings ranged was 12% with SA. The SA savings were dependent upon the percentage of bare soil that was present in each track. The agrochemical savings from SA have a direct impact on the farmers input cost. The average amount of agrochemical saved was 100%, 0% and 12% with CN, UA and SA, respectively. The average bare spot coverage was 7.7%, 10.8% and 12.7% with CN, UA and SA, respectively. UA had the highest amounts of total application applied to the test tracks because it was applied to both foliage areas and bare soil areas in each test track. Variation in the UA could have been caused by starting the nozzles too early without the tractor in motion causing a slight spike in application at the start of the track or stopping the nozzles too early or late causing under or over application at the end of the test track. The control tracks show 100% agrochemical savings because no application was applied. The results would be expected to show higher agrochemical savings using SA from a developing field that had a higher proportion of bare soil.
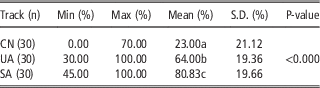
The digital image results suggested that the application of Bravo®, Proline® and foliar fertilizer significantly improved the wild blueberry leaf retention and visual plant healthiness. The percentage of healthy plants varied from 0 to 70% in the CN tracks, 30 to 100% in the UA tracks and 45% to 100% in the SA tracks in the field (Table 1). The UA and SA showed the application of Bravo®, Proline® and foliar fertilizer increased the percentage of healthy plants by 41.0 and 57.8% points, respectively. ANOVA comparison (P-value<0.000) showed UA and SA of Bravo®, Proline® and foliar fertilizer had a significantly higher percentage of healthy plants as compared to the CN tracks. Bravo® has been suggested to reduce foliage disease keeping the blueberry plants green and healthy improving carbohydrate production for the developing floral buds (Percival and Dawson Reference Percival and Dawson2009). SA tracks showed the highest percentage of healthy plants most likely due to the significant plant variability that exists in wild blueberry fields. Large variation in percentage of healthy plants with CN (S.D.=21.12) could have been due to the natural variation of blueberry rust and Septoria leaf spot damage. Each wild blueberry field has several different clones and some of them may be more resistant against blueberry rust and Septoria leaf spot than others.
Summary statistics and ANOVA comparison of percentage of healthy green plants from CN, UA and SA tracks.

Means followed by different letters are significantly different
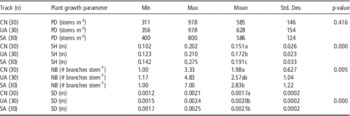
ANOVA test (P-value=0.416) showed no significant difference between blueberry plant density 585, 628 and 586 stems m-2 in CN, UA and SA tracks, respectively (Table 2). This most likely was because new blueberry stems are already formed in early spring of the sprout year (McIsaac, Reference McIsaac1997). There was a significant difference (P-value<0.000) between mean stem heights 0.151a, 0.172b and 0.191c m in CN, UA and SA tracks, respectively. Reasons why the UA and SA tracks had higher stem heights were most likely due to the ability of the foliar fertilizer to increase the nutrient supply causing increased growth. Similarly, there was a significant difference (P-value=0.005) with number of branches per stem 1.98a, 2,57ab, 2.83b in CN, UA and SA, respectively. There was also a significant difference (P-value<0.000) between stem diameters 0.0017a, 0.0020b and 0.0021b m between CN, UA and SA tracks, respectively. The reasons for UA and SA tracks having larger stem diameters would also likely be due to the ability of the foliar fertilizer to increase the plants nutrient intake causing amplified plant growth compared to the CN tracks.
Summary statistics and ANOVA comparison of plant density (PD), stem height (SH), number of branches (NB), and stem diameter (SD) for determining the precision of SA technique relative to the UA with the smart sprayer applying Bravo® and Proline®. Reference was made to CN tracks.

Means followed by different letters are significantly different
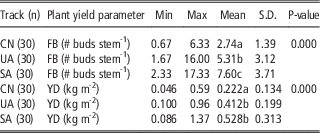
Results suggested that the application of Bravo®, Proline® and foliar fertilizer significantly increase the floral bud count as compared to CN tracks. The mean values of floral buds per stem were 2.74a, 5.31b, and 7.60c in CN, UA and SA, respectively (Table 3). The UA and SA of Bravo®, Proline® and foliar fertilizer increased floral bud formation by 93.8 and 177.4%, respectively over the CN tracks (Table 3). Results were similar to that found by Percival and Dawson (Reference Percival and Dawson2009). Results from the harvested yield collection showed the mean wild blueberry fruit yield was 0.222a, 0.412b and 0.528b kg m-2 in CN, UA and SA tracks, respectively (Table 3). ANOVA (P-value<0.000) indicated that the harvested yield was significantly higher in the UA and SA tracks as compared to the CN tracks. The Bravo®, Proline® and foliar fertilizer increased the harvestable yield by 85.6 and 137.8%, respectively over the CN tracks. These results are in accordance with Percival and Dawson (Reference Percival and Dawson2009) who found that Bravo® fungicide significantly increased harvestable yields. The variance in blueberry fruit yield parameters could have been caused from external factors such as soil properties, insect damage, pollination, winter kill and seasonal or clonal variations other than the Bravo®, Proline® and foliar fertilizer application. The results from this experiment suggest that Bravo®, Proline® and foliar fertilizer can be applied on a spot-specific basis and is beneficial for increased plant healthiness, stem height, stem diameter, number of branches and floral bud count resulting in an increased harvestable yield.
Summary statistics and ANOVA comparison of floral buds (FB) and blueberry yield (YD) for determining the precision of SA technique relative to the UA with the smart sprayer applying Bravo®, Proline® and foliar fertilizer. Reference was made to CN tracks.

Means followed by different letters are significantly different
Conclusion
The Bravo®, Proline® and foliar fertilizer savings with SA ranged from 10.0 to 12.6% based on bare spot coverage within field. Bravo®, Proline® and the foliar fertilizer did not show any significant difference on plant density however, stem height, stem diameter and number of stem branches all were significantly higher with the application applied. The percentage of healthy plants was higher by 41.0 and 57.8% points for UA and SA, respectively over the CN. There was a significant increase in floral buds with both UA (93.8%) and SA (177.4%) of Bravo®, Proline® and foliar fertilizer as compared to CN. There was also a significant increase in harvestable yield by 85.6 and 137.8% for UA and SA, respectively over the CN. The SA savings while using the smart sprayer have a direct impact on farmers input costs associated with the agrochemical application. The smart sprayer equipped with rear mounted sensing system has a great potential to reduce the farmers input costs and increase farm profitability of the wild blueberry growers. Further improvements could be made to the image processing software to include shape feature recognition for a wider range of applications. This feature could improve in-season usage for herbicide with greater potential for agrochemical savings. A faster computer would allow for higher resolution cameras to be used which could help to improve the image processing capabilities.
Acknowledgements
This work was supported by Doug Bragg Enterprises Limited, Oxford Frozen Foods Limited, Wild Blueberry Producers Association of Nova Scotia, Agri-Futures Nova Scotia and the Nova Scotia Department of Agriculture Technology Development Program. The authors would like to thank Joe Slack (president, Slack Farms Ltd.) and Tom Groves (farm manager, Slack Farms Ltd.) for their assistance during the experiment.