Introduction
Colloidal semiconductor nanocrystals (NCs) are a powerful tool for bioimaging and biosensing as fluorescent markers.[ Reference Alivisatos 1 ] Specific properties required for a fluorescent NC in the biomedical application are: (i) water dispersibility, (ii) pH stability, (iii) photostability, and (iv) low interactions between NCs and biomolecules for long term. These properties of colloidal semiconductor NCs have been studied in detail on cadmium or lead-chalcogenide NCs.[ Reference Michalet, Pinaud, Bentolila, Tsay, Doose, Li, Sundaresan, Wu, Gambhir and Weiss 2 ] However, high toxicity of these material is always a concern for the in vitro and in vivo applications.[ Reference Tsoi, Dai, Alman and Chan 3 ]
Silicon (Si) NCs have been attracting significant attention in biomedical fields due to the low toxicity.[ Reference Bhattacharjee, Rietjens, Singh, Atkins, Purkait, Xu, Regli, Shukaliak, Clark, Mitchell, Alink, Marcelis, Fink, Veinot, Kauzlarich and Zuilhof 4 ] Water-dispersible Si NCs are obtained by surface functionalization with hydrophilic molecules such as amine groups,[ Reference Rosso-Vasic, Spruijt, Popovic, Overgaag, van Lagen, Grandidier, Vanmaekelbergh, Dominguez-Gutierrez, De Cola and Zuilhof 5 , Reference Warner, Hoshino, Yamamoto and Tilley 6 ] carboxylic acid groups,[ Reference He, Su, Yang, Kang, Xu, Zhang, Fan and Lee 7 , Reference Yu, Hessel, Bogart, Panthani, Rasch and Korgel 8 ] and poly(ethylene glycol) chains,[ Reference Xu, Li, Zhang, Purkait, Alb, Mitchell, Grayson and Fink 9 ] and micelle-encapsulated structures.[ Reference Erogbogbo, Yong, Roy, Xu, Prasad and Swihart 10 , Reference Pi, Yu and Yang 11 ] These organic functionalized Si NCs usually exhibit luminescence in the ultraviolet–visible (UV–VIS) ranges, and those having luminescence in the near-infrared (NIR) biological window region (1.2–1.8 eV) are very limited.
Recently, we have developed a new type of all-inorganic colloidal Si NCs. The Si NCs have high boron (B) and phosphorus (P) concentration shells (B and P co-doped Si NCs)[ Reference Sugimoto, Fujii, Imakita, Hayashi and Akamatsu 12 – Reference Fujii, Sugimoto and Imakita 15 ] and are dispersed in water and alcohol without organic ligands. The all-inorganic Si NCs exhibit bright and stable luminescence in the biological window.[ Reference Sugimoto, Fujii, Fukuda, Imakita and Akamatsu 14 ] It is beneficial to develop the process to functionalize the surface with organic molecules without scarifying the solution dispersibility and the NIR luminescence efficiency for further applications. With the molecules, NCs can be chemically immobilized onto the specific surface of biosensing devices and biomaterials such as protein and antibody by conjugation via peptide bond,[ Reference Zhang, Chittasupho, Duangrat, Siahaan and Berkland 16 ] thiol bond,[ Reference Xing, Chaudry, Shen, Kong, Zhau, Chung, Petros, O'Regan, Yezhelyev, Simons, Wang and Nie 17 ] and azide alkyne cycloaddition.[ Reference Kolb, Finn and Sharpless 18 ]
In this work, we functionalize the surface of B and P co-doped Si NCs with allylamine (AAm) and acrylic acid (AAc) in order to immobilize the Si NCs on biomolecules. We show the specific binding property of surface functionalized Si NCs. In the functionalization process of Si NCs, the photoluminescence (PL) properties should not be strongly modified. Otherwise, the process cannot be applied for the development of Si NC-based biophotonic materials and devices. In conventional Si NCs, exciton wavefunctions penetrate to the surface and thus the PL properties are very sensitive to the surface chemistry. In fact, a very large shift of the PL wavelength is reported for Si NCs with different surface molecules.[ Reference Dasog, De Los Reyes, Titova, Hegmann and Veinot 19 ] We will study the effect of the functionalization processes on the PL wavelength, spectral shape, intensity, and lifetime in detail. We show that the PL wavelength and spectral shape of functionalized Si NCs are almost identical with those of Si NCs before the processes. Confinement of excitons to the core of B and P co-doped Si NCs is considered to be the origin of the very robust PL.[ Reference Fujii, Sugimoto and Imakita 15 ]
Experimental methods
Materials
Hydrofluoric acid (HF, 46%), methanol (MeOH, >99.8%), AAm (>98.0%), AAc (>98.0%), 2-morpholinoethanesulfonic acid, monohydrate (MES) and (3-aminopropyl)trimethoxysilane (APTMS, 97%) were purchased from Wako Pure Chem. Indust., Ltd. 3-glycidyloxypropyltrimethoxysilane (GOPTS, >95.0%), 1-(3-dimethylaminopropyl)-3-ethylcarbodiimide, hydrochloride (EDC, >98.0%) and N-hydroxysuccinimide (NHS, >98.0%) were purchased from Tokyo Chem. Industry Co., Ltd.
Preparation of colloidal B and P co-doped Si NCs
Colloidal B and P co-doped Si NCs were prepared using a previously published procedure.[ Reference Sugimoto, Fujii, Imakita, Hayashi and Akamatsu 12 ] Borophosphosilicate glass (BPSG) films containing B and P co-doped Si NCs were first prepared by co-sputtering of Si, B2O3, P2O5, and SiO2. Then, the film was thermally annealed at 1100 °C for 30 min in a N2 atmosphere. B and P co-doped Si NCs embedded in BPSG matrices were obtained. The film was dissolved in a HF solution for 1 h in order to etch out the BPSG matrices. The isolated Si NCs were separated from the HF solution by centrifugation and were then transferred to MeOH. A majority of Si NCs were dispersed in MeOH. Precipitates were removed by centrifugation, and only the supernatant liquid was collected. As will be described later, the purified solution was very clear and no further precipitates were formed over several years. In B and P co-doped Si NCs, a heavily B and P-doped Si shell is formed on the surface.[ Reference Fujii, Sugimoto and Imakita 15 ] The shell induces negative potential (ζ-potential: approx. –35 mV at pH 7) on the surface of NCs and prevents the agglomeration by electrostatic repulsion.
Surface functionalization of Si NCs by hydrosilylation
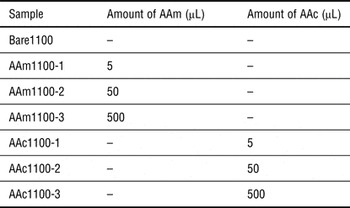
The hydrosilylation process was performed in a glove box (N2 atmosphere, oxygen level is below 100 ppm). The 5–500 µL of a monomer AAm or AAc was added into 500 µL of MeOH solution of Si NCs (200 µg/mL) and heated at 30 °C for 30 min. The solution was then centrifuged (10,000 × g for 7 min) using Amicon Ultra-0.5 10k filter column (Merck Millipore Corp., UFC501096) to remove residual AAm or AAc molecules. Distilled water was added to the column to disperse the Si NCs in water. The process was repeated more than five times to remove the residues completely. The final products were stored in ambient condition. The concentration of final products is ~150 µg/mL in 500 µL of water, and thus, most of Si NCs remain in water after the functionalization. We prepared samples with changing the amount of a monomer AAm or AAc in a Si NC solution. The list of the samples studied in this paper is shown in Table I. Hereafter we refer to a sample by the name designated in the left-most column of the table.
List of samples.

Material characterization
The optical transmittance spectra of the colloidal solutions were obtained using a spectrophotometer (SHIMADZU, UV-3101PC). The size of the NCs was estimated by transmission electron microscope (TEM) (JEOL, JEM-2100F). We confirmed that the average size estimated from TEM image is very close to that estimated by dynamic light-scattering measurement.[ Reference Sugimoto, Fujii, Imakita, Hayashi and Akamatsu 13 ] IR absorption spectra were obtained by a reflection-absorption geometry with the incident angle of 5° in dry air (PerkinElmer, Spectrum GX). The samples for IR absorption measurement were prepared by dropping colloidal solutions onto Au-coated Si wafers. The number ratio of Si–H, Si–O–Si, Si–C, and B–O–B bonds was roughly estimated from IR absorption intensity by taking into account the oscillator strengths of the vibration modes.[ Reference Tenney 20 – Reference Mukhopadhyay and Ray 22 ] To study the specific binding property, tapping-mode atomic force microscope (AFM) (SII, SPA400) was used in an ambient condition. PL spectra were measured by a scanning monochromator equipped with a photomultiplier tube and a liquid-N2 cooled InGaAs NIR photodiode (HORIBA, Fluorolog-3). The excitation source was a monochromatized Xe lamp (405 nm). The spectral response of the detection system was corrected with the reference spectrum of a standard halogen lamp. Time-resolved PL measurement was performed using a spectrometer equipped with a charge-coupled device with an image intensifier (ICCD) (Princeton Instrument, PI-Max). The excitation source was modulated 405 nm light. All the measurements were carried out at room temperature.
Immobilization of AAm-functionalized Si NCs (AAm-Si NCs) on substrate
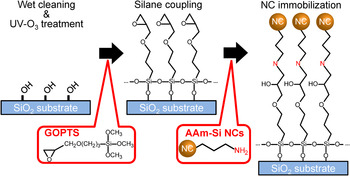
AAm-Si NCs can be chemically immobilized by GOPTS self-assembled monolayers (SAMs) on a SiO2 substrate. The GOPTS molecules have an epoxy terminal and three methoxysilane groups, which react with a Si–OH terminal on the substrate.[ Reference Kamra, Chaudhary, Xu, Johansson, Montelius, Schnadt and Ye 23 ] Scheme 1 shows protocols for AAm-Si NC immobilization on SiO2 substrates. The SiO2 substrates (1 × 1 cm2) were first rinsed by acetone, IPA, and distilled water in ultrasonication bath for each 10 min, and then cleaned by the UV ozone process (SAMCO, UV-1). After the UV ozone process, the surface of a SiO2 substrate is terminated by OH. This OH termination can react with GOPTS by dehydration condensation (silane coupling reaction). The substrates were immersed in the mixture of 10 mL methanol and 100 µL GOPTS for 1 day in dark. After the process, the substrates were rinsed by methanol and distilled water, and then dried in N2 gas. The GOPTS-modified substrate was immersed into AAm-Si NC solution (3.5 µg/mL, 1 mL) for 12 h in order to stabilize the NCs on a substrate with covalent bonds. During this procedure, amines on the surface of Si NCs react with the epoxy group via the active amine hydrogen.[ Reference Kamra, Chaudhary, Xu, Johansson, Montelius, Schnadt and Ye 23 ] We also prepared a GOPTS-modified substrate immersed in bare Si NC solution (3.5 µg/mL, 1 mL) for 12 h as a control sample. Finally, the substrates were carefully rinsed by distilled water and dry in N2 gas.
Protocols for immobilization of AAm-Si NCs on a SiO2 substrate.

Immobilization of AAc-Si NCs on substrate
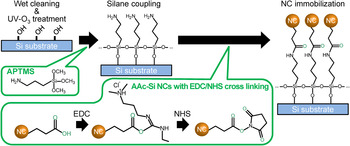
AAc-Si NCs can be chemically immobilized by APTMS SAMs on a Si substrate. APTMS molecules have an amino terminal and three methoxysilane groups, which react with Si–OH on the native oxide layer of the substrate.[ Reference Allen, Sorbello, Altavilla, Castorina and Ciliberto 24 ] Scheme 2 shows protocols for AAc-Si NC immobilization on a Si substrate. The Si substrates (1 × 1 cm2) were first rinsed by acetone, IPA, and distilled water in ultrasonication bath for each 10 min, and then dried in N2 gas and cleaned by the UV ozone process. At this procedure, we use the native oxide layer on the Si substrate for silane coupling reaction. The substrates were immersed in the mixture of 10 mL methanol and 100 µL APTMS for 1 day in dark. After the process, the substrates were rinsed by methanol and distilled water, and then dried in N2 gas. AAc-Si NCs are activated by EDC/NHS coupling reaction.[ Reference He, Su, Yang, Kang, Xu, Zhang, Fan and Lee 7 ] EDC/NHS-activated acids can react with amines to form the peptide bond. For EDC/NHS cross-linking, we prepared 400 mM EDC solution and 100 mM NHS solution dissolved in 100 mM MES buffer (pH 4.7), and then mixed (1:1 EDC/NHS). Approximately 1 mL of AAc-Si NCs dispersed in water (3.5 µg/mL) were mixed with 6 µL of EDC/NHS mixture and were incubated for 10 min. During this procedure, the carboxylic acid can be esterified to an NHS ester by dehydration reaction with EDC and NHS. The APTMS-modified substrate was immersed into EDC/NHS-activated Si NC solution for 1 h in order to stabilize the NCs on substrate with a peptide bond. We also prepared an APTMS-modified substrate immersed in bare Si NC solution (3.5 µg/mL, 1 mL) treated with EDC/NHS for 1 h as a control sample. Finally, the substrates were carefully rinsed by distilled water and dry in N2 gas.
Protocols for immobilization of AAc-Si NCs on a Si substrate.

Results and discussion
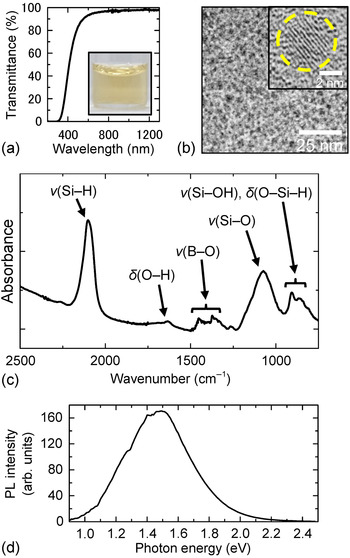
Figure 1(a) shows a transmittance spectrum of B and P co-doped Si NCs dispersed in distilled water (Bare1100). The transmittance is higher than 90% in the NIR range, which indicates that light scattering by large agglomerates is negligibly small and NCs are well dispersed in water. Figure 1(b) shows a TEM image of co-doped Si NCs. For the TEM observations, the water solution is dropped on a carbon-coated Cu mesh. The NCs form a two-dimensional array and no three-dimensional agglomerates are observed in a wide area. The average diameter obtained from the TEM images (4.4 ± 0.7 nm) agrees well with that measured by a dynamic light scattering method.[ Reference Sugimoto, Fujii, Imakita, Hayashi and Akamatsu 13 ] This also confirms that NCs are almost perfectly dispersed in the solution. In the high-resolution TEM image in the inset of Fig. 1(b), lattice fringes corresponding to {111} planes of Si crystal (0.314 nm) can be seen.
(a) Transmittance spectrum of B and P co-doped Si NCs dispersed in distilled water (Bare1100, ~150 µg/mL). The inset shows the photograph. (b) TEM image (inset: high-resolution TEM image), (c) IR absorption spectrum, and (d) PL spectrum.

Figure 1(c) shows an IR absorption spectrum of Bare1100 after storing NCs in MeOH for 3 h. A strong peak at 2100–2200 cm–1 is the stretching vibration mode of Si–H bonds, which is necessary for the hydrosilylation reaction. A peak at ~1070 cm–1 is the Si–O–Si asymmetric stretching vibration mode. The weak peaks of the H–O–H bending (1600–1750 cm–1), B–O–B stretching (1300–1500 cm–1), Si–OH stretching (800–900 cm–1), and O x –Si–H y bending modes (800–900 cm–1) are also observed. No peaks assigned to organic substances are observed.[ Reference Sugimoto, Fujii, Imakita, Hayashi and Akamatsu 12 ] Taking into account the oscillator strengths of the vibration modes,[ Reference Tenney 20 – Reference Mukhopadhyay and Ray 22 ] the number ratio of the Si–H, Si–O–Si, and B–O–B bonds is roughly estimated to 86%, 7%, and 7%, respectively. Note that the composition of the surface changes during storage in MeOH. Since the number of Si–H bonds decreases and that of O-related bonds increases during storage, we use freshly etched Si NCs for the functionalization process.
Figure 1(d) shows a PL spectrum of Bare1100. A broad PL peak in the NIR region (~1.5 eV) is assigned to be due to optical transitions between donor and acceptor states in NCs.[ Reference Sugimoto, Fujii, Imakita, Hayashi and Akamatsu 12 , Reference Sugimoto, Fujii, Imakita, Hayashi and Akamatsu 13 ] The PL quantum yield of Bare1100 is ~4%.[ Reference Sugimoto, Fujii, Fukuda, Imakita and Akamatsu 14 ] The small dips in the PL spectrum are due to absorption by water (see Fig. S1 in Supplementary material).
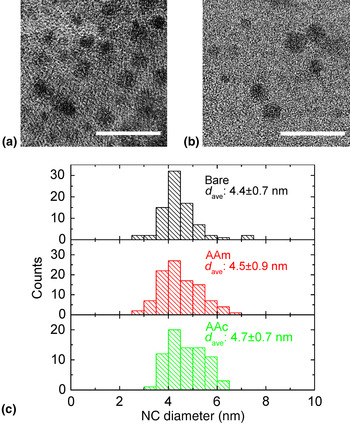
Figures 2(a) and 2(b) show TEM images of co-doped Si NCs functionalized with AAm (AAm1100-2) and AAc (AAc1100-2), respectively. Similar to Bare1100 [Fig. 1(b)], no three-dimensional agglomerates are observed. This indicates that the solution dispersibility is maintained after the functionalization processes. The size distributions of bare and functionalized Si NCs estimated from TEM images are shown in Fig. 2(c). No notable changes of the size distribution are observed.
TEM images of Si NCs functionalized by (a) AAm (AAm1100-2) and (b) AAc (AAc1100-2). The scale bar represents 20 nm. (c) Size distribution of the samples (Bare, Bare1100; AAm, AAm1100-2; AAc, AAc1100-2; respectively).

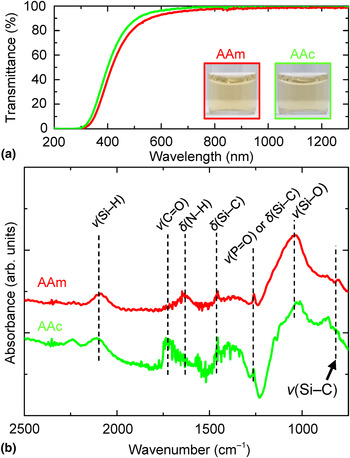
Figure 3(a) shows transmittance spectra of surface functionalized Si NCs in water (AAm1100-2 and AAc1100-2). The transmittance in the NIR range is very high, which also evidences high water dispersibility of the functionalized Si NCs. Slight shift of the spectrum is simply due to small difference of the amounts of NCs in solutions.
(a) Transmittance spectra of surface functionalized Si NCs dispersed in distilled water (AAm1100-2 and AAc1100-2, ~150 µg/mL). The inset shows the photographs. (b) IR absorption spectra of surface functionalized Si NCs (AAm1100-1 and AAc1100-2).

Figure 3(b) shows IR absorption spectra of functionalized Si NCs. Weak peaks assigned to the Si–C stretching (~790 cm−1), Si–C deformation (1450–1460 cm−1), and Si–C bending modes (1250–1270 cm−1)[ Reference Yang, Bley, Kauzlarich, Lee and Delgado 25 ] appear, while the Si–H stretching mode becomes weak. The number ratios of the Si–H, Si–O–Si, Si–C, and B–O–B modes are roughly 55%, 39%, 1%, and 5%, respectively, in AAm1100-2 and 49%, 38%, 1%, and 12%, respectively, in AAc1100-2.[ Reference Tenney 20 – Reference Mukhopadhyay and Ray 22 ] Furthermore, peaks assigned to the N–H deformation (1560–1650 cm−1) and C = O stretching modes (~1730 cm−1) are observed in AAm- and AAc-Si NCs, respectively. All the results strongly suggest that AAm and AAc molecules are functionalized on the surface of Si NCs. The number of AAm and AAc molecules on each Si NC roughly estimated from the number ratio of the Si–C mode (1%) is 10. Note that signals from residual reaction agents, e.g., the C = C stretching (1640–1680 cm–1) and C = C wagging modes (900–950 cm–1) are almost undetectable.
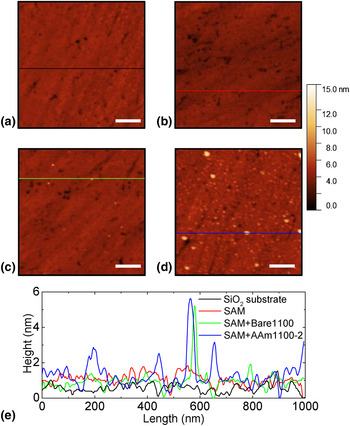
Figures 4(a)–4(d) show AFM topography images of AAm-Si NCs on a GOPTS SAM/SiO2 substrate. On a SiO2 substrate without a GOPTS SAM [Fig. 4(a)] and on a GOPTS-modified substrate [Fig. 4(b)], no particle-like structures are seen. On the control sample, i.e., a GOPTS-modified substrate immersed in the solution of bare Si NCs [Fig. 4(c)], adsorption of a few Si NCs are seen. On the other hand, when a GOPTS-modified substrate is immersed in the solution of AAm-Si NCs, much larger (about 20-fold larger) number of NCs are observed in the AFM image [Fig. 4(d)]. Therefore, AAm-Si NCs are effectively immobilized on a GOPTS-modified substrate. The size of the particles, estimated from the height profiles of the AFM images [Fig. 4(e)] is consistent with the size distribution of Si NCs obtained by the TEM observations.
(a) AFM topography image of SiO2 substrate. (b–d) SiO2 substrate with GOPTS SAM immersed in (b) distilled water, (c) Bare1100 solution, and (d) AAm1100-2 solution. The scale bar represents 200 nm. (e) Height profiles at the positions marked in the topography images. Each profile is obtained by subtracting the lowest height as an offset value from the measured height.

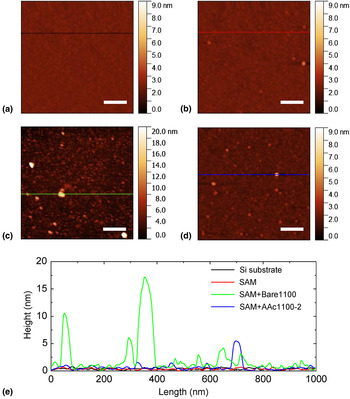
Figures 5(a)–5(d) show AFM topography images of AAc-Si NCs on an APTMS SAM/Si substrate. Figs. 5(a) and 5(b) are AFM images of bare and APTMS SAM/Si substrates, respectively. Figure 5(c) shows an AFM image of a control sample, i.e., an APTMS/Si substrate immersed in bare Si NC solution. A very large number of NCs are adsorbed and large agglomerates are formed. This can be seen clearly in the height profile in Fig. 5(e). The adsorption of very large amount of Si NCs is due to electrostatic attraction between Si NCs with negative surface potential (ζ-potential, –30 mV)[ Reference Sugimoto, Fujii, Imakita, Hayashi and Akamatsu 12 , Reference Sugimoto, Fujii, Imakita, Hayashi and Akamatsu 13 ] and cationic amino groups (NH3 +) on the APTMS SAM. Figure 5(d) shows the AFM image of an APTMS/Si substrate immersed in AAc-Si NC solution. In this case, no agglomerates are observed and Si NCs are attached to the substrate individually, indicating that non-specific adsorption is suppressed in AAc-Si NCs. The NC density on the substrate is ~50 particles/μm2. The AFM image indicates that AAm-Si NCs are effectively immobilized on a GOPTS-modified substrate.
(a) AFM topography image of Si substrate. (b–d) Si substrate with APTMS SAM immersed in (b) distilled water, (c) Bare1100 solution, and (d) AAc1100-2 solution. The scale bar represents 200 nm. (e) Height profiles at the positions marked in the topography images. Each profile is obtained by subtracting the lowest height as an offset value from the measured height. Note that the color scale in (c) is larger than that in (a), (b), and (d).

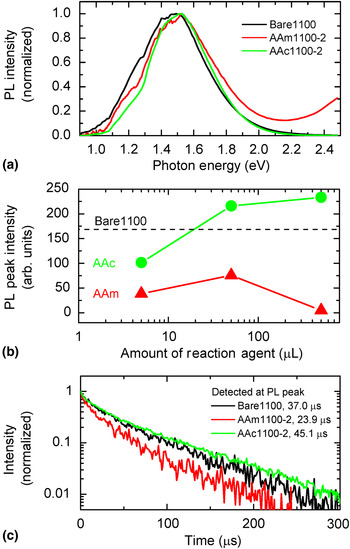
It is very important that PL properties of Si NCs are not strongly modified by surface functionalization processes for many applications. We thus study the PL properties of AAm- and AAc-Si NCs. Figure 6(a) shows normalized PL spectra of AAm- and AAc-Si NCs (see Supplementary material Fig. S2 for PL spectra of other samples). The PL shifts slightly by the processes, although the shift is very small compared with the width of the PL band. The PL quantum yield of AAm1100-2 and AAc1100-2 are ~1.8% and 5.0%, respectively. The PL spectrum of AAc-Si NCs immobilized on a substrate is similar to those in solution (Fig. S3). Figure 6(b) shows the PL intensity as a function of the amount of reaction agents. The amount of Si NCs in solution is fixed (100 µg/mL, 500 µL) to compare the PL intensity. PL intensity of AAm-Si NCs is smaller than that of Bare1100 irrespective of the amount of reaction agent. On the other hand, that of AAc-Si NCs exceeds that of Bare1100 when the amount of reaction agents is large.
(a) Normalized PL spectra of Si NCs dispersed in water. (b) Amount of reaction agent dependence of PL peak intensity at NIR range of Si NCs dispersed in water. The dash line represents PL peak intensity of Bare1100. (c) PL decay curves of Si NCs dispersed in water. The time in the legend indicates PL mean lifetime (τ).

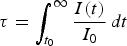
Figure 6(c) shows PL decay curves of Bare1100, AAm1100-2, and AAc1100-2. The mean lifetimes defined by
 $\tau = \int_{t_0}^\infty {\displaystyle{{I(t)} \over {I_0}}\,dt} $
, where I(t) is the PL intensity as a function of time t and I
0 is the initial intensity at time t
0, are shown in the figure. The lifetimes of functionalized Si NCs are very similar to that of Bare1100. This confirms that the luminescence mechanism is not modified by the surface functionalization. The insensitiveness of the PL property to the surface molecules arises possibly from a highly B and P co-doped shell.[
Reference Fujii, Sugimoto and Imakita
15
] The shell isolates an exciton effectively from the surface and an intrinsic recombination process remains after the functionalization. The observed lifetimes are comparable with those reported previously on alkyl or styrene-terminated Si NCs,[
Reference Yang, De Los Reyes, Titova, Sychugov, Dasog, Linnros, Hegmann and Veinot
26
,
Reference Yu and Korgel
27
] and are much longer than nanoseconds lifetimes reported for amine or carboxyl-functionalized Si NCs.[
Reference Rosso-Vasic, Spruijt, Popovic, Overgaag, van Lagen, Grandidier, Vanmaekelbergh, Dominguez-Gutierrez, De Cola and Zuilhof
5
,
Reference De los Reyes, Dasog, Na, Titova, Veinot and Hegmann
28
,
Reference Warner, Rubinsztein-Dunlop and Tilley
29
]
The non-radiative recombination rate is correlated with the area density of dangling bonds at the NC surface.[ Reference Liu, Zhang, Yu, Qiao, Gresback, Pi and Yang 30 ] In Fig. 6(c), the lengthening of the lifetime in AAc1100-2 suggests that non-radiative processes via surface defects are effectively suppressed by the functionalization. On the other hand, the shortening of the lifetime in AAm1100-2 is due to defect formation by alkaline etching of Si NC surface during the AAm hydrosilylation process because of the high pH of the reaction solution (>pH 12). The difference of PL intensity with the type and amount of reaction agent [Fig. 6(b)] may be related to surface defects. Compared with bare Si NCs, PL intensity of AAm-Si NCs was decreased because the number of surface defects were increased by alkaline etching. In contrast, PL intensity of AAc-Si NCs was increased with the decrease of the number of surface defects due to surface passivation. The dependence of the amount of reaction agent in AAc-Si NCs is explained by surface passivation, but that in AAm-Si NCs is unclear.
In Fig. 6(a), a weak PL can be seen in the UV range in AAm-Si NCs. In some papers, the UV PL of amino-group terminated Si NCs is assigned to the exciton recombination via direct band gap in Si NCs[ Reference Warner, Hoshino, Yamamoto and Tilley 6 , Reference Warner, Rubinsztein-Dunlop and Tilley 29 ] or nitrogen and oxygen-related localized states.[ Reference Rosso-Vasic, Spruijt, Popovic, Overgaag, van Lagen, Grandidier, Vanmaekelbergh, Dominguez-Gutierrez, De Cola and Zuilhof 5 , Reference Dasog, De Los Reyes, Titova, Hegmann and Veinot 19 , Reference De los Reyes, Dasog, Na, Titova, Veinot and Hegmann 28 ] Another possible origin of the UV PL is fluorescence from AAm itself (see Supplementary material, Fig. S4).
Conclusions
We have succeeded in fabricating amino- and carboxyl-functionalized Si NCs dispersible in water and exhibiting PL in the NIR range toward immobilization on biomolecules and biodevices. AFM observations reveal that AAm- and AAc-Si NCs are immobilized on GOPTS- and APTMS-modified substrates, respectively. The functionalization process does not significantly affect the PL energy and lifetime of Si NCs. The high insensitiveness of the PL property to the chemical process may arise from the specific structure of B and P co-doped Si NCs, i.e., a high B and P concentration shell is formed on the surface and excitons are confined in the core of Si NCs. The development of ligand-functionalized Si NCs dispersible in water and exhibiting NIR PL paves the way for the development of Si-based environmentally friendly nano-light-emitter used in biosensing and bioimaging.
Supplementary material
PL spectrum of Si NCs and transmittance spectrum of water, PL spectra of surface-functionalized Si NCs, PL spectrum of surface-functionalized Si NCs immobilized on a substrate and fluorescence spectra of organic molecules.
The supplementary material for this article can be found at https://doi.org/10.1557/mrc.2016.51
Acknowledgments
TK and HS acknowledge support from Grant-in-Aid for JSPS Research Fellow (27-4138 and 26-3120). This work was partly supported by KAKENHI (JP15J04138 and JP16H03828), Visegrad Group (V4)-Japan Joint Research Project on Advanced Materials “NaMSeN”, Hyogo Science and Technology Association, and Kyoto Technoscience Center. The authors thank Dr. Kenji Imakita for helpful discussion.