Introduction
The waters off the West Antarctic Peninsula (WAP) support some of the highest rates of phytoplankton primary production in the whole of the Southern Ocean and play a large role in biogeochemical cycling (Arrigo et al. Reference Arrigo, van Dijken and Long2008, Clarke et al. Reference Clarke, Meredith, Wallace, Brandon and Thomas2008). The marine environment of the WAP is strongly influenced by the offshore Antarctic Circumpolar Current (ACC; Fig. 1) that impacts the western shelf with intrusions of relatively warm upper Circumpolar Deep Water (uCDW; Fig. 2) across the shelf-break (Martinson et al. Reference Martinson, Stammerjohn, Iannuzzi, Smith and Vernet2008). Along the shelf, glacial meltwater and melting sea ice stratify the water column to form relatively fresh Antarctic Surface Water (AASW) in the summer mixed layer overlying the permanent pycnocline that extends to the nutrient-rich and carbon-rich uCDW (Meredith et al. Reference Meredith, Venables, Clarke, Ducklow, Erickson and Leng2013). The AASW caps the cold and saline remnant of the winter mixed layer, called the Winter Water, which is identified by a minimum in potential temperature (Venables et al. Reference Venables, Clarke and Meredith2013). The Winter Water in spring and summer reflects the (biogeochemical) signatures of the surface layer of the preceding winter; however, some modification through advection, mixing and remineralization of organic matter is probable. Mixing of uCDW with overlying AASW and Winter Water forms modified CDW (mCDW) over the shelf, which is channelled into the coastal zone through numerous glacially eroded canyons (Smith et al. Reference Smith, Hofmann, Klinck and Lascara1999, Martinson et al. Reference Martinson, Stammerjohn, Iannuzzi, Smith and Vernet2008). Deep convective mixing during winter, following brine rejection from sea ice, cools and increases the salt content of the Winter Water (Venables et al. Reference Venables, Clarke and Meredith2013).
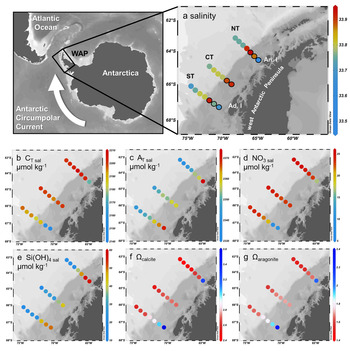
Map of Antarctica and the Southern Ocean showing the West Antarctic Peninsula (WAP) and general direction of flow of the Antarctic Circumpolar Current. Map sub-plots of the WAP showing sea surface a. salinity, b. salinity-normalized CT (CT sal; μmol kg−1), c. salinity-normalized AT sal (AT sal; μmol kg−1), d. salinity-normalized nitrate (NO3 sal; μmol kg−1), e. salinity-normalized silicate (Si(OH)4 sal; μmol kg−1), f. calcite saturation state (Ωcalcite) and g. aragonite saturation state (Ωaragonite). The north (NT), central (CT) and south (ST) transects, shelf stations indicated by black-outlined circles and Anvers Island (An. I) and Adelaide Island (Ad. I) are marked in a.

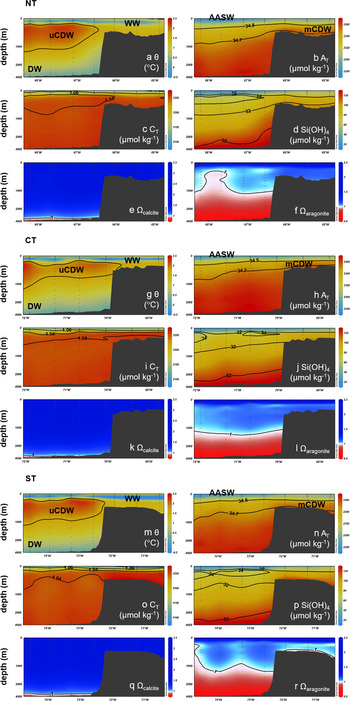
Vertical distribution along the north (NT; a.–f.), central (CT; g.–l.) and south (ST; m.–r.) transects of (a., g., m.) potential temperature (θ, °C), (b., h., n.) AT (μmol kg−1) including salinity contours, (c., i., o.) CT (μmol kg−1) with AT:CT ratio contours, (d., j., p.) Si(OH)4 (μmol kg−1) with NO3 (μmol kg−1) contours, (e., k., q.) calcite saturation state (Ωcalcite) and (f., l., r.) aragonite saturation state (Ωaragonite). Boundaries of Antarctic Surface Water (AASW), Winter Water (WW), upper Circumpolar Deep Water (uCDW), modified Circumpolar Deep Water (mCDW) and Deep Water (DW) are indicated. Contours for the calcium carbonate saturation horizon (Ω = 1) are included in e., f., k., l., q. and r.

The WAP shelf is an ecologically important region (Clarke et al. Reference Clarke, Meredith, Wallace, Brandon and Thomas2008, Ducklow et al. Reference Ducklow, Fraser, Meredith, Stammerjohn, Doney and Martinson2013) with high primary productivity (Schofield et al. Reference Schofield, Saba, Coleman, Carvalho, Couto and Ducklow2017) driving substantial oceanic uptake of carbon dioxide (CO2) from the atmosphere (Arrigo et al. Reference Arrigo, van Dijken and Long2008, Brown et al. Reference Brown, Munro, Feehan, Sweeney, Ducklow and Schofield2019). The inorganic carbon system along the WAP is strongly regulated by meltwater inputs, primary production and respiration, sea-ice processes, mixing of different water masses and carbonate mineral formation and dissolution (e.g. Hauri et al. Reference Hauri, Doney, Takahashi, Erickson, Jiang and Ducklow2015, Tortell et al. Reference Tortell, Bittig, Körtzinger, Jones and Hoppema2015). The seasonal retreat of the ice pack exposes surface waters to increased light levels where freshwater from melting glaciers, sea ice and snow stratifies the upper ocean across the WAP shelf (Meredith et al. Reference Meredith, Venables, Clarke, Ducklow, Erickson and Leng2013, Venables et al. Reference Venables, Clarke and Meredith2013). Release of micronutrients, such as iron, and seeding by sea-ice algae promote the onset of phytoplankton blooms (Clarke et al. Reference Clarke, Meredith, Wallace, Brandon and Thomas2008, Vernet et al. Reference Vernet, Martinson, Iannuzzi, Stammerjohn, Kozlowski and Sines2008, Schofield et al. Reference Schofield, Saba, Coleman, Carvalho, Couto and Ducklow2017), driving intense uptake of inorganic carbon and nutrients. Phytoplankton blooms during spring and summer create hotspots of biological production and drawdown of atmospheric CO2 along the WAP shelf (Hauri et al. Reference Hauri, Doney, Takahashi, Erickson, Jiang and Ducklow2015, Tortell et al. Reference Tortell, Bittig, Körtzinger, Jones and Hoppema2015, Kerr et al. Reference Kerr, Mata, Mendes and Secchi2018). Diatoms are key species in summertime phytoplankton communities, removing silicic acid (silicate) from the surface layer, and the subsequent export and dissolution of biogenic silica in subsurface waters is an important pathway in nutrient cycling in the region (Schofield et al. Reference Schofield, Saba, Coleman, Carvalho, Couto and Ducklow2017, Henley et al. Reference Henley, Jones, Venables, Meredith, Firing and Dittrich2018, Tréguer et al. Reference Tréguer, Bowler, Moriceau, Dutkiewicz, Gehlen and Aumont2018). Coastal and shelf waters are typically iron-replete due to their proximity to glacial and sedimentary sources of iron, in addition to oceanic iron supply with transient periods of iron limitation during the growing season (Dinniman et al. Reference Dinniman, St-Laurent, Arrigo, Hofmann and Van Dijken2020 and references cited therein). Macronutrients are replete over the WAP shelf, apart from exceptional episodic depletion in the surface layer that rarely occurs (and may not be subsequently captured and measured) following intense uptake in the spring and summer blooms (Henley et al. Reference Henley, Jones, Venables, Meredith, Firing and Dittrich2018). Remineralization of exported organic matter from productive surface waters and enrichment of the inorganic carbon and nutrient pools in subsurface waters is pronounced following the highly productive summer period (Jones et al. Reference Jones, Fenton, Meredith, Clargo, Ossebaar and Ducklow2017, Henley et al. Reference Henley, Jones, Venables, Meredith, Firing and Dittrich2018). Phytoplankton productivity decreases offshore as strong winds enhance mixing, removing phytoplankton from the surface layer, and, remote from topographical features, the supply and concentrations of iron can be limiting (e.g. Vernet et al. Reference Vernet, Martinson, Iannuzzi, Stammerjohn, Kozlowski and Sines2008, Trimborn et al. Reference Trimborn, Hoppe, Taylor, Bracher and Hassler2015). Episodic intrusions of CDW enrich the surface layer with inorganic carbon and, in the absence of efficient biological carbon drawdown, drive supersaturation of CO2 with respect to the atmosphere (Hauri et al. Reference Hauri, Doney, Takahashi, Erickson, Jiang and Ducklow2015, Jones et al. Reference Jones, Fenton, Meredith, Clargo, Ossebaar and Ducklow2017, Kerr et al. Reference Kerr, Mata, Mendes and Secchi2018).
Sea-ice processes influence carbon cycling through the formation and dissolution of the abiotic calcium carbonate mineral ikaite (CaCO3⋅6H2O) (Rysgaard et al. Reference Rysgaard, Glud, Sejr, Bendtsen and Christensen2007, Dieckmann et al. Reference Dieckmann, Nehrke, Papadimitriou, Göttlicher, Steininger and Kennedy2008). These processes lead to shifts in dissolved inorganic carbon (CT; Eq. (1)) and total alkalinity (AT; Eq. (2)):
 $${\rm C}_{\rm T} = [ {{\rm H}_2{\rm C}{\rm O}_3 ^ \ast } ] + [ {{\rm HC}{\rm O}_3^{\hbox -} } ] + [ {{\rm C}{\rm O}_3^{2{\hbox -}} } ] $$
 $$\!{\rm A}_{\rm T} = [ {{\rm HC}{\rm O}_3^{\hbox -} } ] + 2[ {{\rm C}{\rm O}_3^{2{\hbox -}} } ] + [ {{\rm B}{( {{\rm OH}} ) }_4^{\hbox -} } ] + [ {{\rm O}{\rm H}^{\hbox -}} ] \,{\hbox -}\, [ {{\rm H}^ + } ] + {\rm proton\ acceptors\ }\!{\hbox -}\,{\rm proton\ donors}$$
where [HCO3−] and [CO32−] are concentrations of bicarbonate and carbonate, respectively, and [H2CO3*] comprises the concentrations of carbonic acid (H2CO3) and aqueous CO2. The H2CO3 content is negligible for practical purposes. The AT is dominated by [HCO3−] and [CO32−] representing ~76% and ~19%, respectively (when pH ≈ 8.1), and describes the capacity of seawater to buffer against acidic inputs (e.g. CO2) (Dickson Reference Dickson1981, Sarmiento & Gruber Reference Sarmiento and Gruber2006). Ikaite crystals precipitate during sea-ice formation in autumn and winter where, due to the incorporation of calcium ions (Ca2+) and CO32−, the AT decreases by 2 for each ikaite molecule that is formed. These processes partition AT within sea ice relative to the surrounding seawater as ikaite is retained within the brine channels and pockets in the sea ice (Dieckmann et al. Reference Dieckmann, Nehrke, Papadimitriou, Göttlicher, Steininger and Kennedy2008) and the CO2-rich brines are rejected and increase the CT content of the ice-covered upper ocean (Rysgaard et al. Reference Rysgaard, Glud, Sejr, Bendtsen and Christensen2007). During sea-ice melt in spring and summer, meltwater inputs dilute AT, hence lowering the buffer capacity of seawater; however, ikaite dissolution creates a small source of AT that slightly counteracts the dilution effects (Hauri et al. Reference Hauri, Doney, Takahashi, Erickson, Jiang and Ducklow2015, Jones et al. Reference Jones, Fenton, Meredith, Clargo, Ossebaar and Ducklow2017, Legge et al. Reference Legge, Bakker, Meredith, Venables, Brown, Jones and Johnson2017).
Since the Industrial Revolution, the concentration of CO2 in the atmosphere has increased from ~280 to ~410 matm in 2019 (https://www.esrl.noaa.gov/gmd/ccgg/trends/gl_data.html), leading to invasion of atmospheric CO2 into the ocean through the solubility carbon pump. Increased oceanic uptake of CO2 increases the CT in surface waters, resulting in increases in hydrogen ion concentrations ([H+]), reductions in [CO32−] and lowering of seawater pH at a rate of ~0.02 pH units per decade since the late 1980s (https://www.ipcc.ch/srocc/chapter/chapter-5). Declining pH and [CO32−] are commonly referred to as ocean acidification (Feely et al. Reference Feely, Sabine, Lee, Berelson, Kleypas, Fabry and Millero2004, Orr et al. Reference Orr, Fabry, Aumont, Bopp, Doney and Feely2005); however, the seawater will remain basic, albeit a bit less basic (i.e. pH < 8.1–8.2), rather than becoming acidic. The lowering of [CO32−] leads to a reduction in the calcium carbonate (CaCO3) saturation states of the biominerals aragonite (Ωaragonite) and calcite (Ωcalcite), defined for aragonite as follows:
 $$\Omega _{{\rm aragonite}} = ( {{[ {{\rm C}{\rm a}^{2 + }} ] }_{{\rm sw}} \times {[ {{\rm C}{\rm O}_3^{2{\hbox -}} } ] }_{{\rm sw}}} ) /{\rm K} ^\ast _{{\rm SP\ aragonite}}$$
where [Ca2+]sw and [CO32−]sw are the concentrations in ambient seawater and K*SP aragonite is the solubility product of aragonite as a function of salinity, temperature and pressure (Broecker & Peng Reference Broecker and Peng1982, Sarmiento & Gruber Reference Sarmiento and Gruber2006). The biotic CaCO3 minerals aragonite and calcite and the abiotic CaCO3 mineral ikaite have their own solubility properties (as a function of seawater temperature, salinity and pressure). Ikaite is extremely unstable and can only exist in crystalline form at low temperatures and high salinities (Dieckmann et al. Reference Dieckmann, Nehrke, Papadimitriou, Göttlicher, Steininger and Kennedy2008 and references cited therein). Aragonite is the less stable biomineral found in marine calcifiers due to its comparatively higher solubility relative to calcite. As such, aragonite is most vulnerable to dissolution and seawater is undersaturated when Ωaragonite < 1, whereby conditions can become energetically costly and potentially even corrosive for calcifiers (Feely et al. Reference Feely, Sabine, Lee, Berelson, Kleypas, Fabry and Millero2004, Orr et al. Reference Orr, Fabry, Aumont, Bopp, Doney and Feely2005).
The WAP marine environment has been routinely monitored through the US Palmer Long-Term Ecological Research (PAL-LTER) programme (Ducklow et al. Reference Ducklow, Fraser, Meredith, Stammerjohn, Doney and Martinson2013) and the British Antarctic Survey Rothera Time Series (RaTS) (Clark et al. Reference Clarke, Meredith, Wallace, Brandon and Thomas2008). High spatial variability and seasonality in inorganic carbon cycling is superimposed on decadal variations in ocean warming, intrusions of carbon-rich CDW onto the shelf, glacial melting and shortening of the sea-ice season (e.g. Vaughan et al. Reference Vaughan, Marshall, Connolley, Parkinson, Mulvaney and Hodgson2003, Martinson et al. Reference Martinson, Stammerjohn, Iannuzzi, Smith and Vernet2008). Increased and more southern upwelling of CDW in response to the El Niño Southern Oscillation and Southern Annular Mode (Hall & Visbeck Reference Hall and Visbeck2002, Stammerjohn et al. Reference Stammerjohn, Martinson, Smith, Yuan and Rind2008) further influences the seasonal sea-ice cover and oceanographic conditions along the WAP. Decadal enrichment of CT and lowering of pH have already been reported in surface and subsurface waters along the WAP (Hauri et al. Reference Hauri, Doney, Takahashi, Erickson, Jiang and Ducklow2015, Kerr et al. Reference Kerr, Mata, Mendes and Secchi2018), and aragonite undersaturation has been found in the shallower water column closer to the coast (Jones et al. Reference Jones, Fenton, Meredith, Clargo, Ossebaar and Ducklow2017). Encroaching CaCO3 undersaturation may have impacts on pelagic and benthic calcifiers such as pteropods that are important links between trophic levels and key contributors to organic and inorganic carbon cycling along the WAP (Feely et al. Reference Feely, Sabine, Lee, Berelson, Kleypas, Fabry and Millero2004, Bednaršek et al. Reference Bednaršek, Tarling, Bakker, Fielding, Jones and Venables2012, Thibodeau et al. Reference Thibodeau, Steinberg, Stammerjohn and Hauri2019). In addition, shifts in the inorganic carbon system may affect phytoplankton productivity and community composition (Trimborn et al. Reference Trimborn, Hoppe, Taylor, Bracher and Hassler2015 and references cited therein), which control the efficiency of atmospheric CO2 uptake, export of organic carbon and biogeochemical cycling (e.g. Arrigo et al. Reference Arrigo, van Dijken and Long2008). Understanding the collective effects of these processes that drive changes in calcium carbonate saturation states is key to better assessing future trends in carbon cycling and potential impacts to the Antarctic ecosystem (Hauri et al. Reference Hauri, Doney, Takahashi, Erickson, Jiang and Ducklow2015, Kerr et al. Reference Kerr, Mata, Mendes and Secchi2018). This study, presenting new water column data along and across the WAP continental shelf, complements those from earlier campaigns with new insights into the role of 1) phytoplankton production, 2) the release of sea-ice and glacial meltwater containing dissolved minerals and 3) freshwater dilution and mixing of CDW, all of which drive spatial variability in calcium carbonate saturation in different water masses across the WAP shelf in summer.
Methods
Sampling and hydrography
Water samples were collected and hydrographic measurements were carried out in summer (9–31 January 2011) along the WAP (Fig. 1) during expedition ANT-XXVII/2 on board FS Polarstern. A total of 19 stations were occupied along three transects extending from the open ocean waters of the ACC (offshore, depth > 1000 m) to nearshore and coastal waters (shelf, depth < 750 m) of the WAP (Fig. 2). The area extended from 65°W (west of Anvers Island) to 75°W (west of Adelaide Island) and 63°S to 67°S. Depth profiles of potential temperature and salinity were obtained using a conductivity-temperature-depth (CTD) instrument (SBE 9/11plus) mounted onto a Seabird Carousel Water Sampler type SBE32 equipped with 12 l Ocean Test Equipment bottles type SBE improved Model 110.
The definition of the mixed-layer depth (MLD) is taken as the depth where the potential density exceeds 0.05 kg m−3 relative to 10 m depth (Venables et al. Reference Venables, Clarke and Meredith2013). The depth of the potential temperature minimum (θmin) is taken to represent the core of the Winter Water (remnant of the winter mixed layer). Salinity is reported on the practical salinity scale. Hydrographic data are available in the PANGAEA database (https://doi.org/10.1594/PANGAEA.772244). Ocean Data View 4 (http://odv.awi.de) was used for data visualization.
Inorganic carbon system
Seawater samples for CT and AT were drawn from the Water Sampler bottles into 500 ml borosilicate glass bottles and analysed within 20 h on a VINDTA 3C instrument (Marianda, Kiel, Germany). Analyses for CT were made through coulometric determination and AT determination was carried out by automated potentiometric titration, following standard procedures (Dickson et al. Reference Dickson, Sabine and Christian2007). Certified Reference Materials (CRM, batches 100 and 105) supplied by A.G. Dickson (Scripps Institution of Oceanography) were analysed to calibrate the measurements; the precision of these analyses was 1.0 μmol kg−1 for CT and 1.5 μmol kg−1 for AT. The ranges of AT (2342–2357 μmol kg−1) and CT (2253–2277 μmol kg−1) in mCDW in this study are consistent with those previously reported for the wider WAP region (2350 μmol AT kg−1 and 2253 μmol CT kg−1; Hauri et al. Reference Hauri, Doney, Takahashi, Erickson, Jiang and Ducklow2015) and coastal waters on Adelaide Island (~2340 μmol AT kg−1 and ~2260 μmol CT kg−1; Jones et al. Reference Jones, Fenton, Meredith, Clargo, Ossebaar and Ducklow2017). The deep water observations correspond very well to previous measurements from the PAL-LTER 1998–2012 cruises (CT = 2261 ± 4 μmol kg−1; AT = 2365 ± 7 μmol kg−1), World Ocean Circulation Experiment (WOCE) and Climate and Ocean - Variability, Predictability, and Change (CLIVAR) cruises (1992, 2006, 2009, 2011) and accompanying calculated variables (CT = 2262 ± 3 μmol kg−1; AT = 2366 ± 9 μmol kg−1), as reported in Hauri et al. (Reference Hauri, Doney, Takahashi, Erickson, Jiang and Ducklow2015).
The Ωaragonite (Eq. (3)) and Ωcalcite were calculated from CT (Eq. (1)), AT (Eq. (2)) and in situ temperature, salinity, pressure and concentrations of phosphate and silicic acid using the CO2SYS program (van Heuven et al. Reference van Heuven, Pierrot, Rae, Lewis and Wallace2011). The carbonic acid dissociation constants K1 and K2 (Eqs (4) & (5)) determined in natural seawater by Mehrbach et al. (Reference Mehrbach, Culberson, Hawley and Pytkowicz1973) as refitted by Dickson & Millero (Reference Dickson and Millero1987) were selected. The constants K1 and K2 are functions of salinity (S) and temperature (T) in natural seawater and are derived from the equilibrium relationships between the inorganic carbon species (Eq. (1)):
 $${\rm K}_1 = [ {{\rm H}^ + } ] [ {{\rm HC}{\rm O}_3^ {\hbox -} } ] /[ {{\rm H}_2{\rm C}{\rm O}_3 ^\ast } ] $$
and
 $${\rm K}_2 = [ {{\rm H}^ + } ] [ {{\rm C}{\rm O}_3^{2 {\hbox -}} } ] /[ {{\rm HC}{\rm O}_3^ {\hbox -} } ] $$
These constants were determined for 19 ≤ S ≤ 43 and 2°C ≤ T ≤ 35°C and have been used in previous studies in the Southern Ocean and WAP regions where temperatures are frequently < 0°C (e.g. Bednaršek et al. Reference Bednaršek, Tarling, Bakker, Fielding, Jones and Venables2012, Hauri et al. Reference Hauri, Doney, Takahashi, Erickson, Jiang and Ducklow2015, Jones et al. Reference Jones, Fenton, Meredith, Clargo, Ossebaar and Ducklow2017). More recent determinations of K1 and K2 in natural seawater by Mojica Prieto & Millero (Reference Mojica Prieto and Millero2002) have been shown to be in excellent agreement with the values of Mehrbach et al. (Reference Mehrbach, Culberson, Hawley and Pytkowicz1973), where the combined data have been fitted as functions of temperature (0–45°C) and salinity (5–42) by Mojica Prieto & Millero (Reference Mojica Prieto and Millero2002). The values of Ωaragonite and Ωcalcite are used as indicators for changes in carbonate chemistry in relation to calcium carbonate saturation states and potential ocean acidification. When Ωaragonite < 1, the seawater is undersaturated with respect to aragonite, such that aragonite minerals become sensitive to dissolution and seawater becomes corrosive to organisms that produce aragonitic shells and skeletons (Feely et al. Reference Feely, Sabine, Lee, Berelson, Kleypas, Fabry and Millero2004, Orr et al. Reference Orr, Fabry, Aumont, Bopp, Doney and Feely2005). The Ωcalcite remained positive (seawater was oversaturated with respect to calcite) in the upper ~2000 m of the water column. Therefore, this study is focused on Ωaragonite and its changes (ΔΩaragonite) with respect to acidification in the contemporary and future marine environment along the WAP. The corresponding values for calcite (Ωcalcite) and its changes (ΔΩcalcite) are included as references.
Inorganic nutrients
For inorganic macronutrients silicic acid (Si(OH)4, commonly referred to as silicate), phosphate (PO4), nitrate + nitrite (NO3 + NO2) and nitrite (NO2), seawater was transferred from sample bottles into pre-rinsed 5 ml polyethylene vials and analysed with a Technicon TRAACS 800 Auto-analyzer. A freshly diluted home-made mixed nutrient standard containing Si(OH)4, PO4 and NO3 was measured daily in triplicate to monitor the performance of the analyser. Also measured was Reference Material for Nutrients in Seawater (RMNS; batch AZ from KANSO; www.kanso.co.jp/eng/production) for international consistency. The reported NO3 may in some samples comprise a very small amount of NO2 that is not distinguished and thus is incorporated into ‘NO3’ when described in the text. The precision values (expressed as the coefficient of variation) for Si(OH)4, PO4 and NO3 are estimated as 0.29%, 0.27% and 0.30%, respectively. The carbon and nutrient data are included in the GLODAPv2 data product (Olsen et al. Reference Olsen, Lange, Key, Tanhua, Álvarez and Becker2019), which, according to stringent GLODAPv2 quality control measures, did not need any adjustments and thus are of high quality.
Seasonal changes
Seasonal changes in CT and AT were estimated from depth profiles (Fig. 3), using the difference between the average summer mixed-layer concentrations and the inferred winter concentrations from the observed concentrations at the depth of the temperature minimum, the latter taken to represent the remnant of the Winter Water (e.g. Jones et al. Reference Jones, Bakker, Venables, Whitehouse, Korb and Watson2011, Tynan et al. Reference Tynan, Clarke, Humphreys, Ribas-Ribas, Esposito and Rérolle2016). The total seasonal change in CT (ΔCT) and AT (ΔAT) results from the influences of the main physical and biological processes, such as salinity changes (ΔCT sal, ΔAT sal) from freshwater inputs and mixing of different water masses, photosynthesis and respiration (ΔCT org, ΔAT org) and the formation and dissolution of biotic (aragonite, calcite) and abiotic (ikaite) calcium carbonate (ΔCT CaCO3, ΔAT*).
 $$\Delta {\rm C}_{\rm T} = \Delta {\rm C}_{{\rm T\ sal}} + \Delta {\rm C}_{{\rm T\ org}} + \Delta {\rm C}_{{\rm T\ CaCO3}}$$
 $$\Delta {\rm A}_{\rm T} = \Delta {\rm A}_{{\rm T\ sal}} + \Delta {\rm A}_{{\rm T\ org}} + \Delta {\rm A}_{\rm T}\ast $$
Salinity normalization of CT and AT (CT sal and AT sal) was carried out using the normalization method that accounts for non-zero CT and AT freshwater endmembers and a reference salinity (34.68; S ref) of uCDW (Friis et al. Reference Friis, Körtzinger and Wallace2003). The freshwater endmember for sea ice (CT = 277 ± 150 μmol kg−1; AT = 328 ± 150 μmol kg−1) from Legge et al. (Reference Legge, Bakker, Meredith, Venables, Brown, Jones and Johnson2017), obtained from land-fast sea ice adjacent to Adelaide Island, was used. The values of ΔCT sal and ΔAT sal are determined from the difference between the total and salinity-normalized changes. It is assumed here that ΔCT sal and ΔAT sal integrate the signal from salinity changes due to freshwater inputs (e.g. meltwater) and advection, mixing and upwelling of different water masses.
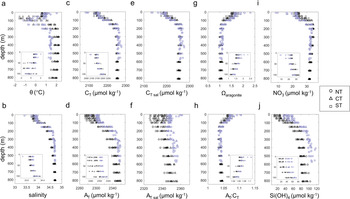
Vertical profiles of a. potential temperature (θ, °C), b. salinity, c. CT (μmol kg−1), d. AT (μmol kg−1), e. CT sal (μmol kg−1), f. AT sal (μmol kg−1), g. aragonite saturation state (Ωaragonite), h. the AT:CT ratio, i. NO3 (μmol kg−1) and j. Si(OH)4 (μmol kg−1) in the upper 850 m (inserts showing upper 120 m) for offshore (black symbols) and shelf (blue symbols) for the north (NT, circles), central (CT, triangles) and south (ST, squares) transects.

Changes in CT due to photosynthetic fixation of CT and production of organic matter (ΔCT org) were determined from changes in salinity-normalized NO3 and the classical C/N Redfield ratio of 106/16 = 6.6 (Redfield Reference Redfield1958), which appears to be valid for the Southern Ocean (Hoppema & Goeyens Reference Hoppema and Goeyens1999). Following Redfield stoichiometry (Redfield Reference Redfield1958), a decrease in CT of 1 μmol kg−1 due to phytoplankton uptake is accompanied by a decrease of 16/106 = ~0.15 μmol kg−1 nitrate, which causes a ~0.15 μmol kg−1 increase in AT (Dickson Reference Dickson1981, Sarmiento & Gruber Reference Sarmiento and Gruber2006). The ΔAT org is therefore estimated from ΔCT org by applying 0.15 μmol AT kg−1 per 1 μmol CT kg−1 removed during photosynthetic production of organic matter. It has been argued that the uptake of the macronutrients of phosphorus (P) and sulphur (S) would also affect AT (Wolf-Gladrow et al. Reference Wolf-Gladrow, Zeebe, Klaas, Körtzinger and Dickson2007). This would lead to a higher uptake ratio of 21.8/106 and an ensuing increase in AT of ~0.21 μmol kg−1 (ΔAT org) per 1 μmol kg−1 ΔCT org. The average difference between ΔAT org determined from ΔCT org using both ratios was 2.7 ± 1.7 μmol kg−1. This would lead to average increases in ΔΩaragonite org of ~0.02, which is ~4% of the total ΔΩaragonite org value and yields negligible difference from the result of this study. This is due to ΔΩaragonite org being dominated by ΔCT org, so fractional adjustments in AT org have a very small effect on ΔΩaragonite org. Thereby, we adhere to the uptake ratio of 16 and the ensuing change of 0.15 μmol AT kg−1 per 1 μmol CT kg−1 removed during photosynthesis.
The ΔCT CaCO3 accounts for any calcium carbonate mineral (biotic aragonite and calcite; abiotic ikaite) formation or dissolution that changes the AT:CT ratio by 2:1 (Dickson Reference Dickson1981, Broecker & Peng Reference Broecker and Peng1982, Sarmiento & Gruber Reference Sarmiento and Gruber2006). This is determined from potential alkalinity (AT*), which is the sum of salinity-normalized AT and NO3 (Goldman & Brewer Reference Goldman and Brewer1980 and references cited therein) following Jones et al. (Reference Jones, Fenton, Meredith, Clargo, Ossebaar and Ducklow2017). The AT* accounts for salinity changes and the increase (decrease) in AT of 1 μmol kg−1 due to the uptake (release) of 1 μmol kg−1 NO3 during photosynthesis (respiration), as described above (Broecker & Peng Reference Broecker and Peng1982, Sarmiento & Gruber Reference Sarmiento and Gruber2006). Thus, ΔCT CaCO3 = 0.5 ΔAT*. It is acknowledged that from the dissolved constituents in seawater, and further calculated seawater tracers, the changes of such variables can be ascribed to the formation/dissolution of carbonate minerals but cannot define specifically which one, two or all three of the relevant minerals (aragonite, calcite or ikaite) is the carbonate source involved without the isolation and identification of such minerals. Hence, the role of other polymorphs, such as high-Mg calcite, and the identification of the carbonate source (e.g. aragonite, calcite or ikaite) with varying elemental ratios in solid CaCO3 is beyond the scope of this work.
The seasonal changes in CT and AT (ΔCT and ΔAT) for each of the key processes were used to determine perturbations in summer mixed-layer Ω (ΔΩaragonite and its partial constituents ΔΩaragonite sal, ΔΩaragonite org and ΔΩaragonite CaCO3) alongside in situ temperature, salinity and macronutrient concentrations with the CO2SYS program. The different process-driven ΔΩ values are used alongside the AT:CT ratio as indicators of the buffering capacity of seawater to estimate the impacts of the changes on the aragonite saturation state.
Uncertainties in analytical and calculation techniques
Uncertainties associated with the analytical measurements of the total ΔCT (Eq. (6)) and ΔAT (Eq. (7)) were based on analytical precision (CT ± 1.0 μmol kg−1; AT ± 1.5 μmol kg−1) and estimated as ± 2 and ± 3 μmol kg−1, respectively. Uncertainties in ΔCT sal and ΔAT sal were estimated, by consideration of the uncertainty in the endmember (± 150 μmol kg−1; Legge et al. Reference Legge, Bakker, Meredith, Venables, Brown, Jones and Johnson2017) and by maximum difference between measured and salinity-normalized values (± 6 μmol kg–1), as ± 8 and ± 9 μmol kg–1, respectively. Uncertainties in ΔCT org and ΔAT org were estimated from the analytical precision of NO3, where an upper bound of the error for ΔNO3 sal was set to ± 0.11 μmol kg−1; thus, the equivalent for CT org was ± 0.7 μmol kg−1 and for AT org was ± 0.1 μmol kg−1. By applying an uncertainty in the C/N ratio, which was set to ± 1 μmol kg−1 to account for deviations in the ratio compared with Redfield stoichiometry (e.g. Hoppema & Goeyens Reference Hoppema and Goeyens1999), the compound upper-bound uncertainty for ΔCT org and ΔAT org was ± 1.7 μmol kg−1 and for AT org was ± 1.1 μmol kg−1. Upper-bound uncertainties in ΔAT* and ΔCT CaCO3 were estimated from the combined uncertainty of salinity-normalized AT (± 6 μmol kg–1) and NO3 (± 0.09 μmol kg–1) as ± 12 μmol kg–1. Using the same approach, uncertainties associated with the ΔΩaragonite partial contributions were estimated from the associated errors for each ΔCT and ΔAT term in CO2SYS: ΔΩaragonite sal ± 0.29, ΔΩaragonite org ± 0.05 and ΔΩaragonite CaCO3 ± 0.41. Uncertainties in Ωaragonite determined from the use of different equilibrium constants (K1 and K2; e.g. Mojica Prieto & Millero Reference Mojica Prieto and Millero2002, relative to those of Mehrbach et al. Reference Mehrbach, Culberson, Hawley and Pytkowicz1973 refit by Dickson & Millero Reference Dickson and Millero1987) were estimated in CO2SYS as ± 0.04, which is of similar magnitude to the range of uncertainties determined above.
Results
Sea surface waters
The summer surface waters in the region were relatively warm and fresh (Fig. 3a & b), with salinities ranging from 33.41 to 33.95 and potential temperatures of 0.56–2.03°C. Warmer and more saline waters were observed on the shelf compared to offshore, with the exception of the freshest surface water that occurred closest to the coast near Anvers Island and Adelaide Island (Fig. 1a). The surface waters exhibited distinct changes in biogeochemical properties from north to south and between offshore and the shelf region (Fig. 1b–g). Values of CT varied between 2080 and 2158 μmol kg−1, with lower concentrations in the south (Fig. 3c). Closest to the coast, lower CT was coincident with low-salinity waters. Congruent with the distribution of salinity, AT increased from 2273 μmol kg−1 offshore to the highest values of 2305 μmol kg−1 over the shelf (Fig. 3d). An exception was lower AT (2287 μmol kg−1) near Anvers Island. Salinity-normalized CT (CT sal) varied by ~60 μmol kg−1 and was lowest (2142 μmol kg−1) on the southernmost transect as an indicator of the larger influence of biological carbon uptake in the south relative to the north (Fig. 1b). In contrast, salinity-normalized AT (AT sal) varied by ~30–40 μmol kg−1 from the lowest values offshore to higher values of 2375 μmol kg−1 over the shelf where the impact of freshwater inputs was greatest in coastal waters (Fig. 1c). Low NO3 sal (< 10 μmol kg−1) occurred in the south and close to the coast as a result of biological drawdown (Fig. 1d), coinciding with low CT. Closely following patterns in AT, values of Si(OH)4 sal increased by > 30 μmol kg−1 from offshore surface waters to the highest value of 59.4 μmol kg−1 over the shelf (Fig. 1e). The highest carbonate mineral saturation states were found over the shelf, with the highest values for Ωcalcite (3.68) and Ωaragonite (2.31) closest to the coast (Fig. 1f & g). The degree of saturation in surface waters increased southwards from the lowest levels of Ωcalcite (2.39) and Ωaragonite (1.50) offshore. The AT:CT ratio (Fig. 3h) ranged from 1.06, implying a reduced buffering capacity where AT was lowest offshore, to 1.11 and an increased buffering capacity with higher AT and lower CT in the shelf region.
Water masses of the West Antarctic Peninsula
The vertical distribution of potential temperature and salinity identified the fresher AASW, cold Winter Water (with winter temperatures closer to freezing point) and warm core of uCDW in the ACC overlying cold, saline deep waters (Fig. 2 & Table I). Projections of uCDW that extended over the shelf mixed with Winter Water and formed the cooler and fresher variety of uCDW (i.e. mCDW). Water column AT, CT and macronutrients showed reductions in the AASW and seasonal mixed layer as compared to the underlying Winter Water for both the shelf and offshore regions. The vertical distribution of AT aligned well with that of salinity (Fig. 2b, h & n). The region was dominated by the CT-rich CDW, with the lowest AT:CT ratios in the uCDW offshore (Fig. 2c, i & o). Macronutrients increased with depth and showed that the shelf region had generally lower NO3 and higher Si(OH)4 compared with offshore waters (Fig. 2d, j & p). The distribution of Ωcalcite (Fig. 2e, k & q) and Ωaragonite (Fig. 2f, l & r) reflected the differences in CT and AT, with higher values (saturation) in the upper layers, especially over the shelf, and the lowest values (undersaturation) in deep waters.
Water mass classification and inorganic carbon system parameters CT (μmol kg−1), AT (μmol kg−1), calcite saturation state (Ωcalcite) and aragonite saturation state (Ωaragonite) along the north transect (NT), central transect (CT) and south transect (ST) for Antarctic Surface Water (AASW), Winter Water (WW), upper Circumpolar Deep Water (uCDW), modified Circumpolar Deep Water (mCDW) and Deep Water (DW). Average values are shown per water mass per transect with the (±) standard deviation in parentheses.

a Martinson et al. (Reference Martinson, Stammerjohn, Iannuzzi, Smith and Vernet2008).
b Smith et al. (Reference Smith, Hofmann, Klinck and Lascara1999).
c Hauri et al. (Reference Hauri, Doney, Takahashi, Erickson, Jiang and Ducklow2015).
'-' indicates no data.
Seasonal mixed layer
The AASW reflected seasonal warming (average θ = 0.30–1.04°C) and freshwater inputs (average S = 33.77–33.92) in the upper part of the water column compared to the Winter Water beneath (Fig. 3a & b & Table I). Summer MLDs (above the seasonal pycnocline) ranged between 7 and 107 m, being shallower and fresher over the shelf compared to offshore. The distribution of CT (Fig. 3c) and NO3 revealed spatial variability with lower values over the shelf and averages of 2136 ± 11 and 19.1 ± 5.2 μmol kg−1, respectively, in the south transect (ST). In contrast, values of AT (Fig. 3d) and Si(OH)4 exhibited notable cross-shelf variability and were higher at 2305 ± 3 and at 54.3 ± 4.6 μmol kg−1, respectively, over the shelf relative to offshore waters. Values of CT sal were distinctly lower over the southern shelf region (ST) and AT sal was elevated over the shelf, particularly in the north transect (NT). The AASW was most saturated with carbonate minerals with Ωcalcite of 2.78 ± 0.48 and Ωaragonite of 1.74 ± 0.30 (Fig. 3g) over the shelf in the south. This was accompanied by the highest AT:CT ratio (Fig. 3h). Conversely, the lowest Ωcalcite, Ωaragonite and low AT:CT ratio values occurred in offshore AASW in the north.
Deeper convective mixing during the previous winter was evident over the shelf as Winter Water depths increased up to 136 m depth compared with offshore waters. This was accompanied by warmer and saltier (-0.65 ± 0.64°C, 34.05 ± 0.08) Winter Water over the shelf (Fig. 3a & b) compared with offshore waters (-1.07 ± 0.42°C, 33.95 ± 0.07). Winter Water values of CT and AT over the shelf were 2195 ± 16 and 2311 ± 5 μmol kg−1, respectively, and there were higher than average offshore Winter Water values of CT and AT of 2184 ± 10 and 2295 ± 8 μmol kg−1, respectively (Fig. 3c & d). Winter Water CT sal and AT sal were slightly lower and higher, respectively, compared to CT and AT (Fig. 3e & f). Concentrations of NO3 were lower over the shelf (27.0 ± 1.9 μmol kg−1) compared to offshore (29.0 ± 1.1 μmol kg−1), and Si(OH)4 was clearly higher over the shelf (68.9 ± 4.8 μmol kg−1) compared to offshore (44.1 ± 7.8 μmol kg−1). A latitudinal gradient showed that the Winter Water potential temperature decreased by ~1°C from the north (NT) to south (ST). Values of Ωaragonite varied between 1.15 and 1.46 (Fig. 3g), with the lowest values close to the coast near Adelaide Island. Values of Ωcalcite varied between 1.83 and 2.33 in the upper mixed layer (not shown). The AT:CT ratio ranged from 1.04 to 1.06 (Fig. 3h).
Circumpolar Deep Water
The subsurface potential temperature maximum (1.70 ≤ θ ≤ 2.13°C; 34.54 ≤ S ≤ 34.75) identified the offshore core of uCDW (Table I) in the ACC, which extended to the shelf break (Fig. 2). Concurrent potential temperature maxima over the shelf were cooler and fresher compared to the ACC-derived uCDW, which distinguished the mCDW (typically 34.6 ≤ S ≤ 34.7). Comparable increasing gradients in CT and AT were seen between the Winter Water and subsurface uCDW and mCDW (Fig. 3c & d). The variability in Si(OH)4 in the water column was similar to that of AT, as shelf waters had higher concentrations, especially in the 400–600 m depth range compared with offshore waters. The average NO3 in both offshore and shelf regions was similar at ~33 μmol kg−1. The mCDW was characterized by signatures of remineralization and upwelled deeper waters across the shelf break with higher CT (2264 ± 7 μmol kg−1), AT (2350 ± 5 μmol kg−1) and Si(OH)4 (102.8 ± 7.8 μmol kg−1) compared with uCDW values of CT (2253 ± 3 μmol kg−1), AT (2347 ± 5 μmol kg−1) and Si(OH)4 (85.0 ± 3.7 μmol kg−1). Within the uCDW and mCDW cores, the AT:CT ratio was lowest with values of 1.03–1.05. Subsurface concentrations of CT sal and AT sal on the shelf were ~5–30 μmol kg−1 higher compared with those offshore (~2253 μmol CT kg−1, ~2347 μmol AT kg−1). The highest CT sal (2276 μmol kg−1) was found at 400 m depth in the south (ST).
Carbonate mineral saturation showed a general latitudinal decrease from north to south with Ωcalcite always above saturation. The Ωaragonite was close to saturation levels in uCDW (1.06 ± 0.04) and mCDW (1.07 ± 0.05). The aragonite saturation horizon (Ωaragonite = 1.0) shoaled over the shelf where Ωaragonite was showing slight undersaturation at 0.97 at 430 m depth in the southern region.
Deep waters offshore
Deep waters (depths > 2000 m) in the ACC in the offshore region (Fig. 2), which included lower CDW, were characterized by CT (2261 ± 2 μmol kg−1), AT (2367 ± 2 μmol kg−1), NO3 (32.3 ± 0.2 μmol kg−1) and Si(OH)4 (131.8 ± 6.5 μmol kg−1). Deep waters were all undersaturated with respect to aragonite (Ωaragonite of 0.54–0.86), and the saturation horizon for calcite (Ωcalcite = 1) was found at ~3000 m depth. The AT:CT ratio ranged between 1.04 and 1.05, showing a slightly higher buffering capacity compared with the overlying uCDW. The latitudinal distribution of deep water revealed variability as the isotherms were more steeply inclined towards the continental slope in the NT region, which is less apparent in the central transect (CT) region and almost absent in the ST region. This resulted in a southwards increase in the average potential temperature of waters in the 2000–2500 m depth range from 0.68°C ± 0.25°C to 0.74°C ± 0.12°C. This was accompanied by a slight increase in salinity and reduction in CT and Si(OH)4.
Inorganic carbon and nutrient cycling
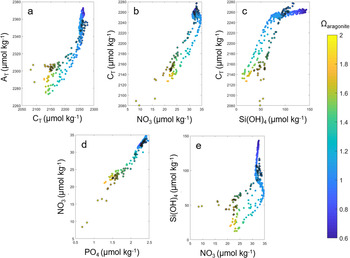
The relationships between AT, CT and macronutrients (Fig. 4) revealed different biogeochemical regimes in the different water masses and offshore and shelf regions. The highest AT, high CT and the lowest Ωaragonite at ~0.5 distinguished the deep and bottom waters offshore (Fig. 4a). The highest CT and near-undersaturation of aragonite (Ωaragonite ≈ 1) defined the shelf region. Aragonite supersaturation (Ωaragonite > 1.8) was associated with the combination of the lowest CT and elevated AT over the shelf. The relationships between CT and NO3 (Fig. 4b) and between CT and Si(OH)4 (Fig. 4c) showed general trends with lowest concentrations co-occurring over the shelf and offshore, respectively, where Ωaragonite was in the 1.6–2.3 range. Regional differences were clearly identified; the highest Si(OH)4 and the highest NO3 occurred in undersaturated (Ωaragonite < 1) deep and bottom waters offshore. The values of NO3 and PO4 (Fig. 4d) were closely coupled with the lowest values over the shelf associated with the highest Ωaragonite of ~2.3. The lowest Si(OH)4 (Fig. 4e) and reduced NO3 concentrations occurred offshore with Ωaragonite at ~1.8.
Relationships between a. AT (μmol kg−1) and CT (μmol kg−1), b. CT (μmol kg−1) and NO3 (μmol kg−1), c. CT (μmol kg−1) and Si(OH)4 (μmol kg−1), d. NO3 (μmol kg−1) and PO4 (μmol kg−1) and e. Si(OH)4 (μmol kg−1) and NO3 (μmol kg−1). Data are colour coded with respect to the aragonite saturation state (Ωaragonite) and shelf waters are identified by black-outlined circles.

Relationships between inorganic carbon and nutrients in the seasonal mixed layer (AASW and Winter Water) for offshore waters were statistically significant and yielded ratio values (estimated from slopes of the linear regression) for C/N of 11.8 ± 0.7 (r 2 = 0.80, P << 0.0001, n = 72), C/Si of 1.0 ± 0.1 (r 2 = 0.76, P << 0.0001, n = 72), N/P of 12.9 ± 0.2 (r 2 = 0.98, P << 0.0001, n = 72) and Si/N of 7.3 ± 1.1 (r 2 = 0.39, P < 0.001, n = 72). For the shelf region, nutrient uptake ratios were also estimated from statistically significant relationships with C/N of 10.6 ± 0.6 (r 2 = 0.89, P << 0.0001, n = 48), C/Si of 1.2 ± 0.1 (r 2 = 0.68, P < 0.0001, n = 48), N/P of 13.8 ± 0.3 (r 2 = 0.98, P << 0.0001, n = 48) and Si/N of 4.8 ± 0.9 (r 2 = 0.40, P < 0.001, n = 48). The carbon and nutrient ratio values in the shelf region were lower for C/N and Si/N and higher for C/Si and N/P compared with the offshore waters.
Seasonal mixed-layer physical and biological processes
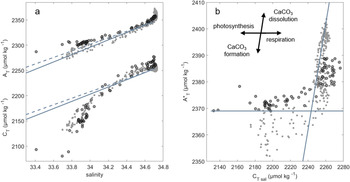
Reductions in CT, AT and macronutrients in surface water and the seasonal mixed layer compared to the Winter Water showed the impact of freshwater inputs in the shelf and offshore regions along the WAP (Fig. 2). Theoretical dilution lines between endmembers for uCDW, determined as average CT and AT in offshore CDW (S = 34.7, CT = 2253 ± 3 μmol kg−1, AT = 2347 ± 3 μmol kg−1) and for sea ice (CT = 277 ± 150 μmol kg−1, AT = 328 ± 150 μmolkg−1) and glacial ice (CT = 16 ± 5 μmol kg−1, AT = 100 ± 5 μmol kg−1) showed the influence of salinity changes on CT and AT in the full water column (Fig. 5a). The relationships between CT and AT with salinity in the seasonal mixed layer (AASW and Winter Water) yielded CT = 168S - 3530 (r 2 = 0.90, SE = 176 μmol kg−1, P << 0.0001, n = 120) and AT = 58S + 333 (r 2 = 0.71, SE = 116 μmol kg−1, P << 0.0001, n = 120). The distribution of AT closely followed the dilution lines, with deviations showing increased AT in some of the fresher, upper-ocean waters and increased AT in salty, deeper waters. Elevated AT in the freshest waters over the shelf indicated an additional AT source to surface waters with respect to sea ice- and glacial ice-derived AT. Values of CT showed greater variability relative to the dilution lines with strong deviations showing reduced CT due to biological carbon uptake in fresher, upper-ocean waters and increased CT largely from respiration in saltier, deeper waters. This is further explored by consideration of CT sal and potential alkalinity (AT*), where the seasonal mixed layer is strongly influenced by CT uptake due to organic matter production with an imprint of CaCO3 formation/dissolution (Fig. 5b). Deep waters are distinguished by elevated AT and CT as a result of CaCO3 dissolution and respiration/remineralization, respectively.
Relationships between a. salinity and AT (μmol kg−1) and salinity and CT (μmol kg−1), and b. potential AT (AT*; μmol kg−1) and salinity-normalized CT (CT sal; μmol kg−1) for all data (grey dots) and the seasonal mixed layer (Antarctic Surface Water and Winter Water, black-outlined circles). Trend lines in a. represent the hypothetical dilution lines between endmembers for upper Circumpolar Deep Water with glacial ice (dashed lines) and sea ice (solid lines). Trend lines in b. represent the influence of photosynthesis/respiration and carbonate mineral formation/dissolution, as indicated by the insert.

The seasonal deficits in CT and AT (AASW vs Winter Water) for offshore and shelf waters were partitioned into the key driving physical and biological processes (Fig. 6). Shelf waters had greater and variable CT deficits with an average ΔCT of -69 ± 35 μmol kg−1 in comparison to offshore waters with an average ΔCT of -44 ± 9 μmol kg−1 (Fig. 6a). The largest ΔCT of -138 μmol kg−1 occurred closest to the coast (Adelaide Island) in the south, which was dominated by ΔCT org of -132 μmol kg−1 (Fig. 6c). Values of ΔAT varied between -1 and -23 μmol kg−1 (average ~ -10 μmol kg−1) across the region (Fig. 6e). Freshwater inputs were greatest in the shelf region with average ΔCT sal and ΔAT sal values of -12 ± 9 and -16 ± 11 μmol kg−1, respectively (Fig. 6b & f). The most notable freshwater impacts were closest to the coast in the north (Anvers Island), driving a maximum ΔCT sal of -34 μmol kg−1 and ΔAT sal of -37 μmol kg−1. This was accompanied by the highest ΔAT* of 6 μmol kg−1 and an associated ΔCT CaCO3 of 3 μmol kg−1 (Fig. 6d & h). The average ΔCT org over the shelf was -58 ± 42 μmol kg−1, which was generally larger and more variable compared with the average ΔCT org of -37 ± 9 μmol kg−1 offshore. The ΔAT org followed similar spatial trends with a maximum ΔAT org of 19 μmol kg−1 coinciding with largest CT deficits over the shelf (Fig. 6g). The ΔAT* and ΔCT CaCO3 were ≤ 0 μmol kg−1 in offshore waters and were lowest at -12 and -6 μmol kg−1, respectively, in the north.
Deficits in CT and AT between the summer mixed layer and Winter Water ascribed to: (a., e.) total change in CT (ΔCT; μmol kg−1) and total change in AT (ΔAT; μmol kg−1); (b., f.) changes due to salinity (ΔCT sal, ΔAT sal; μmol kg−1); (c., g.) changes due to photosynthesis/respiration (ΔCT org, ΔAT org; μmol kg−1); and (d., h.) changes due to calcium carbonate mineral formation/dissolution (ΔCT CaCO3, ΔAT*; μmol kg−1). Mean values with error bars (± 1 SD) are shown for offshore and shelf waters for the north (NT, circles), central (CT, triangles) and south (ST, squares) transect.

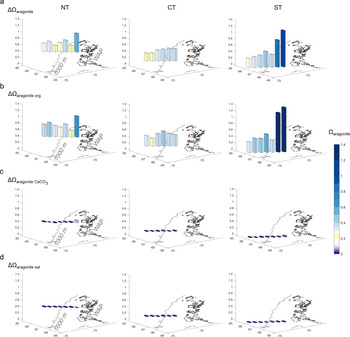
Changes in Ωaragonite between Winter Water and the summer mixed layer (ΔΩaragonite) reflected the combined effects of ΔCT and ΔAT in the offshore and shelf regions and distinct latitudinal variability (Fig. 7). The ΔΩaragonite ranged between 0.20 in offshore waters in the north and as much as 1.15 over the shelf in the south (Fig. 7a). Salinity changes had minor effects on ΔΩaragonite across the region as ΔΩaragonite sal was 0.02 ± 0.01 (Fig. 7b), indicating that dilution effects on AT (reduced Ωaragonite) were counteracted by concomitant reductions in CT (increased Ωaragonite). A higher average ΔΩaragonite (0.54 ± 0.31) in shelf waters was driven by biological carbon uptake, with the highest ΔΩaragonite org of 1.39 near Adelaide Island (Fig. 7c). Offshore waters had a lower average ΔΩaragonite (0.31 ± 0.08) as a result of decreases in mixed-layer carbonate (negative ΔAT*) as ΔΩaragonite CaCO3 (changes in Ωaragonite due to the processes of any CaCO3 mineral) was -0.02 in the north (Fig. 7d). The lowest ΔΩaragonite sal (~0) occurred with the greatest freshening signal in shelf waters near Anvers Island and was accompanied by the highest ΔΩaragonite CaCO3 (0.07). Residual changes in ΔΩaragonite, determined from the difference in the total seasonal change and other contributing factors, were on average -0.12 ± 0.09 and represented a reduction in AASW Ωaragonite relative to Winter Water Ωaragonite. Changes in Ωcalcite (ΔΩcalcite; not shown) exhibited the same spatial variations as ΔΩaragonite with a range of 0.32–1.83 and an average ΔΩcalcite in the shelf (offshore) region of 0.86 ± 0.50 (0.50 ± 0.13).
Changes in the aragonite saturation state (Ωaragonite) between the summer mixed layer and Winter Water along the West Antarctic Peninsula ascribed to a. the total change (ΔΩaragonite), b. changes due to photosynthesis/respiration (ΔΩaragonite org), c. changes due to the formation/dissolution of any calcium carbonate minerals (ΔΩaragonite CaCO3) and d. changes due to salinity (ΔΩaragonite sal) for each hydrographic station in the north transect (NT), central transect (CT) and south transect (ST). Uncertainties are ΔΩaragonite sal ± 0.29, ΔΩaragonite org ± 0.05 and ΔΩaragonite CaCO3 ± 0.41 (not taken into account is the ± 0.04 uncertainty in Ωaragonite from the use of different equilibrium constants K1 and K2).

Discussion
Meltwater influence on carbonate mineral saturation
The seasonal changes in carbonate mineral saturation in the upper ocean reflected the spatial variability in CT and AT that created distinct gradients in Ωaragonite across the shelf from offshore and latitudinally along the WAP. The highest Ωaragonite in fresher surface waters close to the coast (Fig. 1) was accompanied by large salinity-driven seasonal deficits in AT and CT as a result of freshwater dilution of AT and CT over the shelf. The WAP shelf is influenced by numerous marine-terminating glaciers and is located in the seasonal sea-ice zone whereby glacial meltwater, snow and melting sea ice seasonally supply the continental shelf with freshwater (Meredith et al. Reference Meredith, Venables, Clarke, Ducklow, Erickson and Leng2013). The impacts of freshwater on AT and CT are revealed from the close relationships of both with salinity (Fig. 5). The variability of AT was largely controlled by changes in salinity as driven by meltwater inputs (freshwater endmember) and mixing with uCDW (saline endmember). Deviations from theoretical mixing lines were most pronounced towards the two endmembers, where processes of photosynthesis/respiration and CaCO3 precipitation/dissolution were shown to play important roles in controlling AT. The shelf region experienced a greater influence of freshwater as indicated by salinity-driven reductions in CT and particularly AT (ΔCT sal shelf = -12 ± 9 μmol kg−1; ΔAT sal shelf = -16 ± 11 μmol kg−1; Fig. 6) that exceeded those in offshore waters (ΔCT sal offshore and ΔAT sal offshore ≈ -10 μmol kg−1). Mixing of seawater with sea-ice or glacial meltwater leads to a dilution of carbonate ions, with the potential to drive a decrease in Ωaragonite due to the lower AT and CT signatures in the fresh meltwater compared with seawater (Legge et al. Reference Legge, Bakker, Meredith, Venables, Brown, Jones and Johnson2017). However, surface waters were oversaturated with respect to aragonite, whereby reductions in surface-layer salinity actually contributed to an increased mixed-layer Ωaragonite of 0.02 ± 0.01 (Fig. 7). These salinity-driven changes revealed the effects of combined AT and CT variability on Ωaragonite as the dilution and reduction of AT (reducing Ωaragonite) were counteracted by the parallel dilution and reduction of CT (increasing Ωaragonite). The seasonal meltwater release contributed to net increases in Ωaragonite to create spatial gradients in surface water calcium carbonate saturation during summer, which supports previous findings along the WAP (Hauri et al. Reference Hauri, Doney, Takahashi, Erickson, Jiang and Ducklow2015, Jones et al. Reference Jones, Fenton, Meredith, Clargo, Ossebaar and Ducklow2017, Legge et al. Reference Legge, Bakker, Meredith, Venables, Brown, Jones and Johnson2017) and in the Southern Ocean region to the north-east of the WAP (e.g. Jones et al. Reference Jones, Bakker, Venables, Whitehouse, Korb and Watson2011, Tynan et al. Reference Tynan, Clarke, Humphreys, Ribas-Ribas, Esposito and Rérolle2016).
Biological production drives carbonate mineral supersaturation
Reductions in salinity-normalized CT and NO3 occurred along the meltwater-influenced shelf, particularly in the vicinity of Anvers Island and Adelaide Island (Fig. 1), indicating the stronger influence of biological carbon uptake and the production of organic matter in the nearshore region. Biological carbon uptake of up to 132 μmol kg−1 dominated the seasonal changes in Ωaragonite (at least 93% of ΔΩaragonite; Fig. 7) to counteract any meltwater-induced suppression of carbonate mineral saturation states (ΔΩaragonite bio > ΔΩaragonite sal). Large phytoplankton blooms are known to occur along the WAP shelf during spring and summer (Vernet et al. Reference Vernet, Martinson, Iannuzzi, Stammerjohn, Kozlowski and Sines2008, Schofield et al. Reference Schofield, Saba, Coleman, Carvalho, Couto and Ducklow2017), where enhanced productivity characterizes the coastal regions such as near Anvers Island and Adelaide Island (Clarke et al. Reference Clarke, Meredith, Wallace, Brandon and Thomas2008, Trimborn et al. Reference Trimborn, Hoppe, Taylor, Bracher and Hassler2015). The highest chlorophyll a concentrations of up to 30 μg l−1 and elevated rates of primary production of 98–183 mg C m−3 day−1 were found in diatom-dominated blooms that occurred in summer 2011 in the south near Adelaide Island (Trimborn et al. Reference Trimborn, Hoppe, Taylor, Bracher and Hassler2015). The enhanced nearshore phytoplankton production resulted in biologically driven decreases in CT with ΔCT org of -58 ± 42 μmol kg−1 and associated increases in ΔAT org (Fig. 6) and increased Ωaragonite by 1.39 (Fig. 7) despite the influence of freshwater along the shelf. These processes created substantial summertime sinks for atmospheric CO2 of > 40 mmol m−2 day−1 (Tortell et al. Reference Tortell, Bittig, Körtzinger, Jones and Hoppema2015). The shelf and coastal phytoplankton communities typically consist mainly of large diatoms, which was the case in summer 2011 as diatoms were dominant (> 70%) and accounted for most of the phytoplankton biomass and primary production (Trimborn et al. Reference Trimborn, Hoppe, Taylor, Bracher and Hassler2015). Enhanced productivity in this region is associated with glacial, sea-ice and snowmelt plumes that increase water column stratification, create favourable light conditions and supply nutrients to the surface layer (Vernet et al. Reference Vernet, Martinson, Iannuzzi, Stammerjohn, Kozlowski and Sines2008). As such, the combined effect of meltwater release and biological carbon uptake during the seasonal sea-ice melt period generated gradients in Ωaragonite in the AASW across the shelf from offshore (Fig. 1). These findings support previous observations of high CaCO3 saturation states in productive shelf and coastal waters during summer along the WAP (Hauri et al. Reference Hauri, Doney, Takahashi, Erickson, Jiang and Ducklow2015, Jones et al. Reference Jones, Fenton, Meredith, Clargo, Ossebaar and Ducklow2017, Legge et al. Reference Legge, Bakker, Meredith, Venables, Brown, Jones and Johnson2017) and downstream of islands in the Southern Ocean (Tynan et al. Reference Tynan, Clarke, Humphreys, Ribas-Ribas, Esposito and Rérolle2016).
The distribution of ΔΩaragonite org for the shelf region (average ΔΩaragonite org on the shelf was 0.62 ± 0.44) showed latitudinal variability ranging from 0.42 ± 0.22 in the north to 1.00 ± 0.54 in the south (Fig. 7). This reflects a temporal signal of summertime phytoplankton production with an earlier onset of blooms in the north, following increasing light levels at the lower latitude, compared to the south. This probably accounts for the wide range of NO3 concentrations that occurred in AASW (8.1–26.8 μmol kg−1; Fig. 3) in shelf waters, as the lowest concentrations in the south capture the more recent signal of biological drawdown vs the influence of resupply from recycling and mixing with subsurface waters in the north (Henley et al. Reference Henley, Jones, Venables, Meredith, Firing and Dittrich2018). Nutrient concentrations were replete across the region between Anvers Island and Adelaide Island and showed that they were not limiting to primary production, as reported previously (Henley et al. Reference Henley, Jones, Venables, Meredith, Firing and Dittrich2018). Our observations do not preclude limiting conditions later in the austral growing season as the latter has not finished by the end of January.
The statistically significant correlation between inorganic carbon and nutrients in the seasonal mixed layer indicated that drawdown during primary production was a key process controlling concentrations during summer (Fig. 4). The observed C/N ratios of 11.8 ± 0.7 and 10.6 ± 0.6 for offshore and shelf waters, respectively, were higher than the Redfield ratios, probably due to the effect of air-sea CO2 uptake and subsequent influx of CT in surface waters from strong summertime CO2 sinks (Hauri et al. Reference Hauri, Doney, Takahashi, Erickson, Jiang and Ducklow2015, Tortell et al. Reference Tortell, Bittig, Körtzinger, Jones and Hoppema2015). The cycling of NO3 and PO4 was closely coupled with the lowest macronutrient concentrations over the shelf associated with a biologically driven high Ωaragonite value of ~2.3 (Fig. 1). The observed N/P ratios of 12.9 ± 0.2 for offshore waters and 13.8 ± 0.3 for the shelf region indicate that the inorganic carbon and nutrient cycles depart from the Redfield stoichiometric value of 16 mol N (1 mol P)−1 (Redfield Reference Redfield1958). The seasonal seawater N/P uptake ratios of ~13–14 probably result from the prevalence of diatoms along the WAP in summer 2011, which are known to exhibit lower N/P ratios compared with Redfield ratios and are consistent with previous findings (Clarke et al. Reference Clarke, Meredith, Wallace, Brandon and Thomas2008, Trimborn et al. Reference Trimborn, Hoppe, Taylor, Bracher and Hassler2015). The N/P uptake ratio values are within the range of those previously reported for the WAP region (N/P of 11.7–14.6; Hauri et al. Reference Hauri, Doney, Takahashi, Erickson, Jiang and Ducklow2015, Henley et al. Reference Henley, Jones, Venables, Meredith, Firing and Dittrich2018) and for the coastal waters of Adelaide Island (N/P of 11.1–15.3; Clarke et al. Reference Clarke, Meredith, Wallace, Brandon and Thomas2008).
Substantial decreases in concentrations of chlorophyll a to < 1 μg l−1 and lower rates of primary production of 3–9 mg C m−3 day−1 were observed in offshore waters (Trimborn et al. Reference Trimborn, Hoppe, Taylor, Bracher and Hassler2015). As for the shelf and coastal regions, diatoms were predominant in offshore waters (> 60%), whereas Phaeocystis accounted for ~20–40% of the biomass (Trimborn et al. Reference Trimborn, Hoppe, Taylor, Bracher and Hassler2015). The negative biological gradients across the WAP shelf are driven by concentrations of dissolved iron and reduced light levels from wind-driven deep mixing and the interaction between these two controlling factors (Dinniman et al. Reference Dinniman, St-Laurent, Arrigo, Hofmann and Van Dijken2020 and references therein). The offshore phytoplankton communities during summer 2011 were exposed to lower dissolved iron concentrations compared with nearshore communities and exhibited physiological traits that indicate iron stress, perhaps coupled with light limitation in mixed layers up to 80 m deep (Trimborn et al. Reference Trimborn, Hoppe, Taylor, Bracher and Hassler2015). For this depth limit of offshore mixed layers, seawater N/P uptake ratios were reduced to 9.6 ± 0.4 (r 2 = 0.94, P << 0.0001, n = 48) and provided a further indication of impeded nitrate assimilation induced by iron limitation during blooms of large diatoms in the Southern Ocean.
The Si/N uptake ratios that were greater than 1Si:1N are indicative of large bloom-forming Antarctic diatoms that tend to be very heavily silicified (e.g. Tréguer et al. Reference Tréguer, Bowler, Moriceau, Dutkiewicz, Gehlen and Aumont2018). The Si/N uptake ratios were much higher than expected for diatom production alone, reflecting the presence of other phytoplankton species (e.g. Phaeocystis) and that additional processes (e.g. terrestrial and sediment/porewater fluxes) had occurred and increased Si(OH)4 relative to NO3. Lower dissolved Si(OH)4 in the water column offshore is further evidence for strong biological drawdown in diatom blooms where assimilation processes exceeded Si(OH)4 resupply processes, in contrast to conditions of elevated Si(OH)4 in parallel to diatom-dominated production on the shelf (Fig. 3). The close coupling of CT and Si(OH)4 (Fig. 4) indicates the key role of diatoms that drive intense oceanic CO2 uptake in offshore and coastal areas of the WAP.
Remineralization and lowering of carbonate mineral saturation in subsurface waters
Subsurface values of CT, AT, Si(OH)4 and, to a lesser extent, NO3 increased across the shelf from offshore waters, which was most pronounced in the south (Fig. 2 & Table I). These features coincided with the steepest vertical gradients between productive surface waters to the underlying mCDW over the southern shelf (Fig. 3). Enhanced concentrations of macronutrients and CT in cross-shelf CDW has been previously reported for the southern WAP and attributed to organic matter remineralization and biogenic silica dissolution in the productive and diatom-dominated waters of the shelf and coastal areas (Jones et al. Reference Jones, Fenton, Meredith, Clargo, Ossebaar and Ducklow2017, Henley et al. Reference Henley, Jones, Venables, Meredith, Firing and Dittrich2018). Enriched CT and low Ωaragonite distinguished the mCDW of the shelf region, resulting in a shoaling of the aragonite saturation horizon across the shelf break and aragonite undersaturation in the mCDW in the south (Fig. 2r). Compared with offshore waters, Winter Water on the shelf was generally located at greater depths, was more saline and was characterized by higher AT and Si(OH)4 and generally higher CT concentrations. The elevated AT, Si(OH)4 and CT of the Winter Water were indicative of mixing with underlying mCDW, where greater exchange between water masses probably takes place over the shallower shelf relative to offshore. This indicates that the upward mixing of mCDW into the seasonal mixed layer could also provide a supply of AT into the Winter Water layer. The concentrations of Si(OH)4 also increased in the uCDW-mCDW layer across the shelf break (Fig. 2), indicating that upwelling and mixing of saline, AT-rich deeper waters may contribute to this signal (higher AT:CT ratios). Therefore, the values of AT in AASW and Winter Water may become decoupled from CT concentrations (Fig. 4) through mixing of AT-rich water into surface waters where biological CT uptake occurs.
The relationship between salinity and AT shows a mixing trend between AT-rich subsurface waters and the fresher surface waters (Fig. 5), where the highest AT at high salinities originates from the influence of CaCO3 dissolution in the deep and offshore bottom waters. Increases in potential AT for a smaller range of CT sal revealed the influence of CaCO3 dissolution in enriching AT in subsurface waters overlying the shelf (Fig. 5b). For CT, the mixing trend shows increasing subsurface CT concentrations over the shelf as a result of remineralization and a contribution from CaCO3 mineral dissolution. The greater increase in subsurface CT relative to increases in AT with the cross-shelf modification of CDW drives lower AT:CT ratios and aragonite undersaturation in mCDW over the shelf (Fig. 2). Decoupling of Winter Water CT and NO3 with more saline waters over the shelf suggests that not solely remineralization but also sea-ice processes contribute, with brine rejection transporting CT into the underlying water column during ice formation. Increasing AT (for a small range of CT) at salinities > 33.7 indicated carbonate mineral dissolution in Winter Water and evidence of a sea-ice carbon pump (Rysgaard et al. Reference Rysgaard, Glud, Sejr, Bendtsen and Christensen2007, Dieckmann et al. Reference Dieckmann, Nehrke, Papadimitriou, Göttlicher, Steininger and Kennedy2008) over the shelf.
The coupling of inorganic carbon and nutrients at high concentrations (Fig. 4) in mCDW is driven by remineralization of organic matter and dissolution of biogenic silica exported from the productive surface layer (Henley et al. Reference Henley, Jones, Venables, Meredith, Firing and Dittrich2018 and references cited therein). Remineralization enriched CT (reduced AT:CT ratios) and suppressed Ωaragonite to yield a biologically induced acidification signal in subsurface water over the shelf (Fig. 2). Natural spatiotemporal variations in carbonate mineral saturation levels suggest that organisms of the WAP marine ecosystem are already exposed to low saturation states and as such may have evolved a degree of resilience to future acidification (Hauri et al. Reference Hauri, Doney, Takahashi, Erickson, Jiang and Ducklow2015, Legge et al. Reference Legge, Bakker, Meredith, Venables, Brown, Jones and Johnson2017). Enrichment of Si(OH)4 in water masses overlying the shelf (Fig. 3j) was probably due to dissolution of biogenic silica from the diatom communities that characterized the summer blooms along the WAP (Trimborn et al. Reference Trimborn, Hoppe, Taylor, Bracher and Hassler2015). In addition, dissolved Si(OH)4 from seafloor sediment resuspension and porewaters could contribute to elevated Si(OH)4 concentrations in bottom waters (Henley et al. Reference Henley, Jones, Venables, Meredith, Firing and Dittrich2018). Mechanisms for elevated AT in subsurface waters could also result from seafloor fluxes that provide a source of AT to the deep and bottom waters overlying the shelf. In addition, upwelling of salty, AT-rich deep waters onto the shelf would also increase the AT:CT ratios in upper shelf waters imprinted by the signal of biological CT uptake.
Greater enhancements of the biogeochemical characteristics of mCDW in the southern shelf region relative to the north (Fig. 2) perhaps reflect 1) increases in CT, NO3 and Si(OH)4 as a result of temporal variability in the more recent summer production, organic matter export and subsequent remineralization, 2) greater signals of salt and CT in rejected brine from sea-ice formation during the preceding winter and 3) contributions of AT and Si(OH)4 from entrainment of deep waters, terrestrial minerals (e.g. dissolved minerals delivered in glacial meltwater plumes), porewater and sediment sources. As such, the passage of uCDW from the offshore waters of the ACC across the shelf break enabled enrichment of regenerated CT, thus lowering AT:CT ratios and Ωaragonite in mCDW to drive a signal of biologically induced acidification over the WAP southern shelf.
Buffering against acidification on the freshwater-influenced shelf
Aragonite supersaturation (Ωaragonite > 1.8) occurred as a result of low CT sal and elevated AT sal in fresher surface waters over the shelf (Fig. 1). The AT-salinity relationship (Fig. 5a) indicated that freshwater in the region contained a minor source of AT, the value of which agreed very well with sea-ice AT from fast ice at Rothera Research Station, Adelaide Island (Legge et al. Reference Legge, Bakker, Meredith, Venables, Brown, Jones and Johnson2017). Glacial ice was found to contain very low concentrations of macronutrients, CT and AT in the southern WAP region (Legge et al. Reference Legge, Bakker, Meredith, Venables, Brown, Jones and Johnson2017). The freshwater-derived AT would be supplied to surface seawater from sea-ice and glacial melt along the coast and, coupled with biological uptake of CT, would act to increase the AT:CT ratio. Meltwater plumes have been identified as sources of dissolved iron (e.g. Dinniman et al. Reference Dinniman, St-Laurent, Arrigo, Hofmann and Van Dijken2020) to coastal waters due to dissolution and transport of minerals from the surrounding bedrock. This geochemical meltwater enrichment is considered a main source of iron to the WAP shelf region (Dinniman et al. Reference Dinniman, St-Laurent, Arrigo, Hofmann and Van Dijken2020 and references cited therein) and may be subsequently important for the Antarctic coastal marine environment (Trimborn et al. Reference Trimborn, Hoppe, Taylor, Bracher and Hassler2015). Particulate and dissolved minerals incorporated into meltwater probably enrich the plumes with AT relative to CT, and they also become transport mechanisms of terrestrially derived organic matter that yields CT upon remineralization. These land-meltwater-ocean processes lead to variations in the AT:CT ratio in the meltwater and upper ocean (Fig. 3h) upon mixing with the plume.
Sea ice near Adelaide Island contained varying concentrations of macronutrients, CT and AT (Legge et al. Reference Legge, Bakker, Meredith, Venables, Brown, Jones and Johnson2017) that are delivered to surface waters during the melt period, often with varying elemental stoichiometry compared with the source and surrounding seawater. Sea-ice processes play a key role in partitioning AT and CT differently within the ice and underlying water (Rysgaard et al. Reference Rysgaard, Glud, Sejr, Bendtsen and Christensen2007, Dieckmann et al. Reference Dieckmann, Nehrke, Papadimitriou, Göttlicher, Steininger and Kennedy2008), and the variations in the AT:CT ratios exert geochemical control on Ωaragonite in the winter and summer mixed layers in the seasonally ice-covered regions. During sea-ice formation, CO2-rich brines are rejected, reducing the AT:CT ratio in the underlying Winter Water. Upon sea-ice melt, any ikaite minerals that were formed are released and, upon dissolution, provide a source of AT in the meltwater and increase the AT:CT ratio in the surrounding surface seawater during spring and summer (Rysgaard et al. Reference Rysgaard, Glud, Sejr, Bendtsen and Christensen2007, Dieckmann et al. Reference Dieckmann, Nehrke, Papadimitriou, Göttlicher, Steininger and Kennedy2008). Dissolution of ikaite during sea-ice melt has also been suggested as a mechanism contributing to AT variability in summer surface waters in Southern Ocean regions north of the WAP (Jones et al. Reference Jones, Bakker, Venables, Whitehouse, Korb and Watson2011, Tynan et al. Reference Tynan, Clarke, Humphreys, Ribas-Ribas, Esposito and Rérolle2016).
As for biogeochemical modifications to uCDW, strong cross-shelf gradients relative to offshore in terms of AT in AASW and Winter Water were observed as a result of mixing of low-AT meltwater and AT-rich deep water (Fig. 2). The AASW with salinity of ~33.8 found offshore is characteristic of ACC water and is accompanied by an AT sal value of ~2345 μmol kg−1, which was typically compared to shelf waters (Fig. 3). Cross-shelf increases in AASW salinity, indicative of upwelling and mixing with subsurface mCDW, was evident in the vicinity of the shelf break and coincided with a higher AT sal value of ~2355 μmol kg−1 (Fig. 2). Exceptions were an elevated AT sal value of ~2370 μmol kg−1 in meltwater-influenced surface waters that became superimposed onto the upwelling signal at coastal locations (Fig. 1). The values of AT sal increased by up to 40 μmol kg−1 in AASW overlying the shelf where the impact of meltwater was largest and dominated the seasonal change in AT (ΔAT; Fig. 6f) near Anvers Island and Adelaide Island. Variations in AT sal can be attributed to carbonate mineral processes in sea ice, terrestrially derived minerals in glacial meltwater plumes and runoff, benthic fluxes and a minor source during photosynthesis. Evaluating potential alkalinity (AT* = AT + NO3; Goldman & Brewer Reference Goldman and Brewer1980) allows the changes in AT due to nitrate assimilation and inorganic nitrogen release to be accounted for, and remaining variations in AT* are due to carbonate mineral formation/dissolution (e.g. Jones et al. Reference Jones, Fenton, Meredith, Clargo, Ossebaar and Ducklow2017). Elevated AT* (up to 10 μmol kg−1; Fig. 5b) and increases in the AT:CT ratio in the coastal AASW (Fig. 3h) are consistent with a freshwater AT source (e.g. terrestrially derived dissolved minerals in glacial meltwater, snowmelt and/or carbonate mineral dissolution in sea-ice meltwater).
Trends in AT* and salinity-normalized CT (Fig. 5b) further indicated the role of carbonate mineral processes in controlling AT in different water masses along the WAP. The shelf waters were biogeochemically distinct compared with offshore waters as a result of the greater contribution from calcium carbonate dissolution. This was reflected in the seasonal changes in calcium carbonate saturation states, with maximum increases in Ωaragonite from CaCO3 dissolution in the meltwater-influenced surface layers relative to Winter Water values (Fig. 7c). As the salinity normalization was carried out by considering the CT and AT signature of sea ice, the estimated increases in AT sal indicated that the contribution of AT from the ice via the sea-ice carbon pump is probably variable within the ice and also varies with location (i.e. greater contributions over the southern shelf) and/or with contributions of AT from terrestrial or benthic origin, as indicated previously by nutrient fluxes in the region (Henley et al. Reference Henley, Jones, Venables, Meredith, Firing and Dittrich2018). These processes make a small contribution to the seasonal changes in CT (Fig. 6d). While surface water CT sal on the shelf was more depleted (higher AT:CT ratio) than in offshore waters (Fig. 1b), the AT sal in shelf waters (Fig. 1c) was elevated (higher AT:CT ratio). Both CO2 drawdown during photosynthesis and the release of excess AT increase the geochemical buffering capacity of seawater and drive calcium carbonate supersaturation (Ωaragonite > 2.1; Ωcalcite > 3.1) in the relatively fresh surface waters on the shelf (Fig. 1). These processes that counteracted any meltwater suppression of saturation states and increased Ωaragonite during the summer are consistent with other summer observations in coastal Antarctic waters (Jones et al. Reference Jones, Fenton, Meredith, Clargo, Ossebaar and Ducklow2017, Legge et al. Reference Legge, Bakker, Meredith, Venables, Brown, Jones and Johnson2017).
Remote from freshwater influences, the lowest Ωaragonite of ~1.5 occurred in AASW offshore north of 64°S (Fig. 1g). Concurrent high CT (> 2140 μmol kg−1), salinity (> 33.7) and temperature (> 1°C) indicated upwelling of uCDW in the region, with subsequent reduction of the AT:CT ratio and lowering of Ωaragonite (Fig. 3). Weaker signals of biological CT uptake relative to coastal and southern waters and the absence of ‘excess’ AT in offshore surface waters would result in comparatively low surface water Ωaragonite. Seasonal differences in AT* revealed an overall loss of AT of up to 10 μmol kg−1 (this being concomitant with decreases in CT) in surface waters relative to the Winter Water. This indicates either the formation of carbonate minerals or another mechanism removing (adding) AT from surface waters (Winter Water) by late summer. Playing a role here may be the aragonitic pteropods, which are prevalent along the WAP and are frequently observed at elevated abundances offshore in the study region (Thibodeau et al. Reference Thibodeau, Steinberg, Stammerjohn and Hauri2019). Pteropods remove AT in the upper water column through the formation of aragonite shells and release carbonate ions upon sinking and dissolution of the shells in deeper waters (Bednaršek et al. Reference Bednaršek, Tarling, Bakker, Fielding, Jones and Venables2012). The 2:1 trend in AT and CT between Winter Water and AASW in the offshore region (Fig. 5b) could be due to the formation of calcium carbonate shells in the upper ocean and/or the supply of carbonates to the Winter Water from upwelling uCDW (with elevated carbonate from the dissolution of exported carbonate shells).
Conclusions and future outlook
This study gives insight into the spatial variability in calcium carbonate saturation states along the WAP, specifically the patterns in different water masses from offshore and across the continental shelf. Biological production in diatom-dominated blooms generated high Ωaragonite and Ωcalcite with respect to the biotic minerals calcite and aragonite, respectively, along the WAP shelf in summer. Glacial meltwater and melting sea ice stratified the water column and facilitated the formation of phytoplankton blooms, accompanied by elevated Ωaragonite and Ωcalcite in surface waters close to the coast. The presence of excess AT in the summer mixed layer indicates that dissolution of abiotic CaCO3 (ikaite) from sea ice and/or terrestrially derived minerals in glacial meltwater has contributed to the surface water variability in Ωaragonite and Ωcalcite during the seasonal thaw. The low AT and CT content of the meltwater dilutes the concentration of carbonate ions, thus tending to lower seawater Ωaragonite and Ωcalcite and inducing a freshwater-driven acidification signal. However, additional dissolved constituents that contribute AT relative to CT slightly counteract the dilution effects by enhancing the AT:CT ratios in the meltwater-influenced seawater. Thus, any meltwater-driven carbonate ion dilution (tending to decrease AT and the seawater buffering capacity) was largely compensated by biologically driven CT uptake and excess AT from dissolved minerals resulting in increases in Ωaragonite and Ωcalcite. These geochemical processes act as minor buffers against acidification and play a key role alongside the biological carbon uptake that drives increases in Ωaragonite and Ωcalcite in coastal waters around Antarctica. Remineralization of organic matter and export of CO2-rich brines from forming winter sea ice drive low Ωaragonite and Ωcalcite in Winter Water and mCDW over the WAP shelf. A strong biological carbon pump in shelf waters and the coastal zone created surface water carbonate mineral supersaturation and biologically induced suppression of calcium carbonate saturation states in subsurface CDW. Mixing of water masses in the upper ocean suppresses surface water Ωaragonite and may enhance the vulnerability of the surface layer to acidification upon further uptake of CO2 and freshwater discharge. Given the increased and southwards shift in the upwelling of CDW, changes in sea-ice cover and oceanographic conditions in response to the El Niño Southern Oscillation and Southern Annular Mode, the WAP marine system will be even more vulnerable in the future.
Enhanced CO2 drawdown in shelf waters may occur by 1) increased meltwater cooling of the surface layer that strengthens the solubility carbon pump, 2) releasing iron-rich terrigenous material in meltwater plumes to stimulate the biological carbon pump and 3) extended ice-free periods, enhanced water column stratification and favourable light environments that enhance the biological carbon pump. These processes have augmented the uptake of atmospheric CO2 and supply of inorganic carbon to surface waters along the WAP in recent decades. However, the future outlook is uncertain as a result of the large variability and shifts in phytoplankton species and primary production, ice-ocean dynamics and freshwater fluxes and biogeochemical cycling, with consequences for the biologically driven and meltwater-driven changes in Ωaragonite and Ωcalcite in the upper ocean. Our findings highlight the impact of high phytoplankton productivity, meltwater-derived mineral inputs and mixing of freshwater and CDW that regulate the spatial variability of calcium carbonate saturation states in the dynamic environment of the WAP. As such, the coastal zones of Antarctica are key regions for studying the response of marine ecosystems to impacts of ocean acidification. Spatiotemporal studies are therefore essential to elucidate the controls on calcium carbonate saturation states and to unravel the natural variability and long-term trends in order to better understand the impacts of future ocean acidification on marine ecosystems in the climatically vulnerable Antarctic coastal waters.
Acknowledgements
The authors gratefully acknowledge the Alfred Wegener Institute Helmholtz Centre for Polar and Marine Research for the opportunity to conduct fieldwork on board FS Polarstern. We acknowledge the leadership of the late E. Fahrbach (AWI) as chief scientist. Extended thanks to G. Rohardt at AWI and P. Laan, L. Salt and S. van Heuven at Royal NIOZ for scientific and logistical support. We thank Dr Matthew Humphreys and an anonymous reviewer for their thorough and insightful comments, which have greatly improved the quality of the manuscript.
Financial support
This work was part of postdoctoral research (E.M. Jones) at the Royal NIOZ supported through EU project CARBOCHANGE ‘Changes in carbon uptake and emissions by oceans in a changing climate’, which received funding from the European Community's Seventh Framework Programme under grant agreement no. 264879.
Author contributions
HJWdB and MH contributed to the conception and design of the study. EMJ, MH and KB contributed to the acquisition, analysis and interpretation of data. All authors drafted and/or revised the manuscript and approved the submitted version for publication.
Details of data deposit
All hydrographical data are publicly available in the Pangaea database (https://doi.org/10.1594/PANGAEA.772244).