I. INTRODUCTION
Externally directed assembly of colloidal suspensions promises to be a key paradigm in the bottom-up fabrication of functional micro- and nanostructures.Reference Grzelczak, Vermant, Furst and Liz-Marzán1 Electric fields generate induced dipolar interactions between particles, which gives rise to a tunable and reversible disorder-to-order transition in the case of model suspensions of spheres.Reference Lumsdon, Kaler and Velev2, Reference Mittal, Lele, Kaler and Furst3 Depending on the electrode geometry and field strength, the induced conservative interactions can further couple to local electrohydrodynamic (EH) flows, yielding a rich array of organized microstructural states.Reference Gong, Wu and Marr4–Reference Fagan, Sides and Prieve7 It is only recently, however, that the directed assembly of other particle shapes and sizes has begun to be explored. Anisotropic shapes, such as ellipsoids, lead to the self-assembly of different symmetries and more open structures,Reference Singh, Lele, Nettesheim, Wagner and Furst8 and imposing externally directed flow fields in addition to polarization forces has recently been used to tailor the optical and mechanical properties of colloidal structures.Reference Ding, Song, Clays and Tung9–Reference Mittal, Niles and Furst11 Nonetheless, a general understanding of the influence of particle shape on the assembly of colloidal particles remains to be developed. With this in mind, in this paper we present the directed assembly of disk-shaped zeolite particles in alternating current (AC) electric fields.
Zeolites are crystalline materials with uniform, nanopore networks. This unique pore structure gives these materials the ability to act as molecular sieves, and the high acidity of zeolite particles also makes them catalytically active.Reference Tosheva and Valtchev12 In addition to naturally occurring zeolites, a large number of zeolites have been fabricated with sizes ranging from nanometer to micrometer dimensions and with both isotropic and anisotropic shapes.Reference Lin and Yates13, Reference Roeffaers, Ameloot, Baruah, Uji-i, Bulut, Cremer, Mller, Jacobs, Hofkens, Sels and Vos14 In most applications zeolites are employed as films, pellets, or powders. In the resulting macrostructure the pores are oriented randomly and a continuous pore network is not preserved. It was recently shown, however, that zeolite particles packed in an ordered structure in which the pores are oriented in one direction have a higher selectivity in the separation of xylene isomers.Reference Lai, Bonilla, Diaz, Nery, Sujaoti, Amat, Kokkoli, Terasaki, Thompson, Tsapatsis and Vlachos15 Furthermore, because of a wide range of shape and sizes, colloidal zeolites also serve as precursors for the self-assembly of functional materials.Reference Davis16, Reference Holland, Blanford and Stein17 Oriented zeolite crystals have been obtained by growing zeolite particles in ordered arrays on a chemically modified substrate,Reference Feng and Bein18, Reference Lee, Lee, Tae, Park and Yoon19 and presynthesized particles have been assembled on a substrate by means of covalentReference Ha, Lee, Lee and Yoon20, Reference Lee, Ha, Lee and Yoon21 and ionicReference Boudreau, Kuck and Tsapatsis22, Reference Lee, Lee and Yoon23 linkages or by physical adsorption.Reference Ban, Ohwaki, Ohya and Takahashi24, Reference Lee, Meng, Norris, Scriven and Tsapatsis25
This article is organized as follows: we first describe the particle preparation and the experimental setup used for the assembly of zeolite disks. We then discuss the AC electroosmotic (ACEO) flows that originate at the edge of the electrode and characterize the flow velocity as a function of field strength and the distance from the electrode. We show that far from the electrode edge, where the ACEO flow is negligible and the suspension quiescent, the particles form a hexagonal packing. The induced dipole moment orients the particles with their major axis parallel to the field direction. At the electrode edge, where ACEO flows are strong, zeolite particles form a “brushlike” structure that has a microstructure similar to that observed in the absence of ACEO flows. Finally, we show that the thickness of this particle brush results from an interplay between interparticle dipolar forces and the drag force that the particles experience in the ACEO flow.
II. EXPERIMENTAL
A. Particle preparation
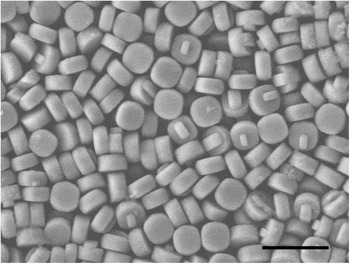
Suspensions of disk-shaped ZSM-5 zeolite particles with diameters of 453 ± 11 nm and thicknesses of 209 ± 10 nm were synthesized according to a previously published procedure.Reference Kragten, Fedeyko, Rimer, Vlachos, Lobo and Tsapatsis26, Reference Rimer, Fedeyko, Vlachos and Lobo27 Figure 1 shows a scanning electron microscope image of the zeolite particles. The colloidal suspension of the zeolite particles was stabilized by suspending them in 1 mM sodium dodecyl sulfate (SDS) solution. The particles were washed with SDS solution by gently centrifuging the sample, removing the supernatant, and then redispersing the particles in SDS solution. The optical microscopy image and the electrophoretic mobility of the particles as a function of medium pH and SDS concentration is shown in the supplementary information. In the SDS solution the particles are negatively charged. The Debye length,  is approximately 10 nm, where εm is the permittivity of the medium, c is the salt concentration of the z:z electrolyte (assuming complete dissociation of the SDS), k is the Boltzmann constant, T is the absolute temperature, NA is the Avagadro numbers and e is the electronic charge.
Scanning electron microscopy image of ZSM-5 zeolite particles. The particles are disk shaped with a diameter of 453 ± 11 nm and a thickness of 209 ± 10 nm. Scale bar = 1 μm.

B. Electrode geometry and geometries of electric fields
Electric fields were generated using a high voltage power amplifier (model 2340, TEGAM, www.tegam.com) and a sine wave signal from a function generator (model 33220A, Agilent Technologies, www.ugilent.com) A 1-μF capacitor was used in series to remove the direct current component in the signal. All field strengths reported are root mean squared (rms) values. The sample cell fabricated for electric field experiments consisted of a glass slide coated with two parallel coplanar stripes of gold approximately 1–2 mm apart, which served as the electrodes. The particle suspension was placed in the gap between the electrodes and sealed using ultraviolet-cure optical adhesive (NOA 81, Norland Products, www.norlandprod.com). An adhesive spacer and a coverslip were used to create a 30–50 μm thick chamber. A thin spacer was used to minimize (but not completely eliminate) EH flows. The cell was imaged on an inverted microscope using either a 63× water immersion or a 63× oil immersion objective.
C. Particle image velocimetry
EH flows were characterized in the flow cell. We suspended 500-nm diameter fluorescent polystyrene (PS) particles (Polysciences, Inc., www.polysciences.com) in 1 mM SDS solution at a volume fraction ϕ = 1.3 × 10⁻³. The flow near the edge of the electrode was visualized in the presence of an electric field using fluorescent microscopy with a 63× water objective. Images were collected at 30 frames/s and analyzed using the open source MatPIV toolbox.Reference Sveen28 We used an interrogation window of 64 × 128 pixels with 50% overlap to analyze a 1024 × 1024 pixel image. Because of particles sticking to the electrode and the formation of particle chains, we were unable to measure the flow within 10 μm of the electrode edge. To minimize the effect of the tracer particles chaining and assembling near the electrode, the electric field was switched on for a few seconds during each measurement. Recording at 30 frames/s allowed us to obtain a sufficient number of images for particle image velocimetry (PIV) analysis while avoiding the assembly at longer times. The field of view restricted the maximum distance to 100 μm from the edge. Around 30 image pairs were analyzed and averaged to generate one vector map. The vector map was again averaged to obtain the velocity magnitude at a particular distance from the electrode, and the standard deviation was used to calculate the error in the measurement.
III. RESULTS AND DISCUSSION
A. ACEO flow
In addition to induced dipolar force between particles in the bulk suspension, ACEO flows were also present near the edge of the electrodes.Reference Green, Ramos, Gonzalez, Morgan and Castellanos29–Reference Squires31 Green and coworkers studied this fluid motion as a function of field frequency, solution conductivity, and the spatial location in the cell.Reference Green, Ramos, Gonzalez, Morgan and Castellanos29 Using a parallel coplanar electrode geometry, with a 25 μm gap between the electrodes, they observed a fluid velocity from the gap between the electrode to the electrode surface. Bhatt and coworkers patterned conductive regions on a substrate and demonstrated that various types of particles, including latex particles, yeast cells, and microbes, collect on the conductive region because of the ACEO flow.Reference Bhatt, Grego and Velev32 Thus, such flows can be used to direct particles to a particular region, where they can be assembled using the external electric field. Flow from the bulk suspension to the electrode has received the greatest attention because it typically causes particle accumulation over the electrode.Reference Green, Ramos, Gonzalez, Morgan and Castellanos30, Reference Squires31 This flow is also accompanied by a complementary flow that advects the particle away from the electrode.Reference Muller, Gerardino, Schnelle, Shirley, Bordoni, Gasperis, Leoni and Fuhr33
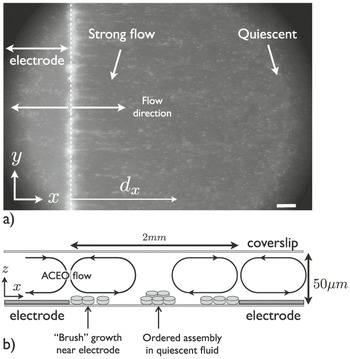
We characterized the ACEO flows using PIV throughout the sample cell. Fig. 2(a) shows a typical fluorescence microscopy image. The electrode is on the left side of the image, and the direction of ACEO flows is marked by arrows. The particles flow from the edge of the electrode toward the bulk suspension and toward the center of the electrode. The flow velocity decays with distance from the electrode edge in both directions. Fig. 2(b) is a schematic that shows the flow near the edge of the electrode. The flow is circulatory in nature and the convection rolls span the entire thickness of the cell. This was determined by observing the direction of the flow of tracer particles at different focal planes. In the plane of the electrodes, tracer particles translate from the electrode edge toward the bulk suspension. As the focal plane was changed we observed a flow in the reverse direction near the coverslip.
(a) Fluorescence microscopy image of 500-nm diameter PS tracer particles in an AC electric field. The bright vertical line is the electrode edge. Scale bar = 10 μm. (b) Schematic showing the flow directions in the cell. The convection rolls because of ACEO flow originate near the electrode edge and recirculate because of the closed sample cell. Brush growth occurs near the electrode edge, where the ACEO flow velocity is strongest. The distance between the electrodes is approximately 2 mm.

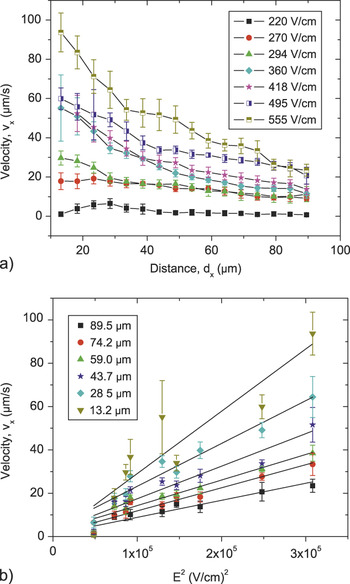
Because we were interested in flow near the electrode, where particle assembly should occur because of the dielectrophoretic force of the field gradient, we characterized the ACEO flow velocity along the x axis, ϑx , as a function of distance from the electrode edge for electric field strengths between 220 ≤ E ≤555 V/cm at a fixed frequency of 10 kHz, as shown in Fig. 3(a). The electrode edge is located at x = 0, and the imaging is at the plane of the electrode, i.e., at a height z = 0 μm above the chamber surface. Because particles adhered to the electrode and formed dipolar chains (discussed below), we were unable to measure the flow within 10 μm of the electrode edge. Likewise, the field of view restricted the maximum distance to 100 μm from the edge. The error was estimated from the variation in the velocity along the length of electrode, in the field of view, at a fixed distance from the edge. The error bar in Fig. 3(a) ranges between 9 and 20% of the measured velocity and is higher closer to the electrode. The average velocity parallel to the electrode edge, i.e., along the y axis (cf. Fig. 2), is negligible. The particle velocity decreased with increasing distance from the electrode for all field strengths.
(a) Flow velocity along the x axis measured using PIV as a function of distance from the electrode dx for varying electric field strengths. The field frequency is fixed at 10 kHz. The flow velocity increases with increasing field strength and decays as the distance from the electrode increases. The lines are guides to the eye. (b) Magnitude of ACEO flow velocity as a function of applied field strength E 2 for varying distances from the edge of the electrode. The black lines are the least squared linear fits to the data and the fitted values are summarized in table I of the supporting information.

The flow velocities at six different separations from the electrode as a function of the applied field strength squared, E 2, are shown in Fig. 3(b) Linear least square fits are indicated by the black lines and are summarized in table I in the supplementary information. The linear trend demonstrates that the magnitude of the ACEO flow scales with the square of the field strength, as expected.Reference Bhatt, Grego and Velev32 In an AC field, as the potential switches from positive to negative during each cycle, the double layer reforms with counterions of the corresponding opposite charge near the electrode. The characteristic time scale for the double layer to form is on the order of τD ∼ κ−2 /Di, where Di is the counterion self-diffusivity.Reference Mittal, Lele, Kaler and Furst3 Because Di ≈ 10−9 m2/s, the charge near the electrode equilibrates within on the order of τD ≈ 10−8s. This is much faster than the period of the AC electric field. The flow occurs because of the action of the local field on the charge near the electrode, because the direction of the field also changes, the net result is a flow in the same direction. Moreover, the ACEO flow depends on the charge buildup in the double layer formed at the electrode and the tangential field strength on the resulting charge buildup. Because both of these quantities are proportional to the applied field strength E, the observed E 2 dependence was expected.
B. Assembly in the quiescent fluid
The ACEO flow decayed with increasing distance from the electrode. This flow pattern resulted in a stagnation point far from the edge of the electrode and near the coverslip. In these regions the zeolite particles interacted solely via the induced dipolar interactions, generated by the external electric field, which were because of a difference in the conductivity and dielectric constant between the particle and the medium. It was demonstrated previously that double layer polarization plays a central role in this process.Reference Mittal, Lele, Kaler and Furst3 Induced dipole moments in spherical particles lead to a dipole–dipole attraction that results in the formation of pearl chains followed by a two-dimensional (2D) crystal with a hexagonal close-packed structure.Reference Lumsdon, Kaler and Velev2
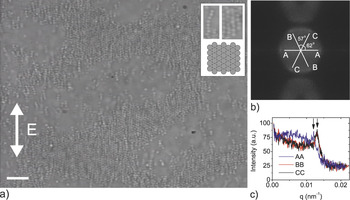
Similar to spherical particles, disk-shaped zeolite particles also form a hexagonal structure. Figure 4(a) shows a sparse 2D array formed at a field strength of 650 V/cm and a frequency of 10 kHz. The field frequency of 10 kHz was chosen to avoid the formation of bands and vortices that occur at frequencies around 1 kHz and lower. These patterns prevent chaining and the subsequent 2D assembly of the particles. The critical field strength at which these patterns are formed increases as the frequency is increased.Reference Lele, Mittal and Furst34 Furthermore, as the frequency is increased the polarizability of the particles decreases and higher field strength is required for assembly.Reference Mittal, Lele, Kaler and Furst3 The particle volume fraction in the suspension is approximately ϕ = 6 × 10⁻³. The inset at the top right corner of Fig. 4(a) is a digitally magnified section along with a schematic that shows the side to side alignment of particles resulting in a hexagonal close-packed structure. A Fourier transform [Fig. 4(b)] of the image shows a six spot pattern. The hexagonal symmetry is confirmed by measuring the angles between the diagonals of the hexagon, which are close to 60°, although there is a slight distortion, with particles somewhat closer along the field direction than perpendicular to it. Throughout the remainder of the article, we refer to the structure as hexagonal. We calculated the separation between the particles in the hexagonal close-packed structure by plotting the intensity along each of diagonals as a function of the scattering vector q, defined as q = 2π / r. Figure 4(c) shows that the peaks are located at a distance of 498 ± 19 nm from the center that is a larger than the particle diameter, indicating that the particle surfaces do not touch because of electrostatic repulsion between them. The slight anisotropy in the hexagonal packing is also apparent in the intensity plot. Again, the hexagonal structure is distorted because the average separation between the chains is greater than the average spacing between the particles in a single chain. The thermal fluctuations of the dipolar chains led to a slightly larger excluded volume around them and thus increased the interchain spacing. On increasing the particle volume fraction, the coverage of the 2D crystal increased and eventually we obtained multiple layers of particles.
(a) Optical microscopy image of 2D assembly of zeolite particles in an AC electric field of strength 650 V/cm and frequency 10 kHz. Inset shows digitally magnified sections of the pearl chains and hexagonal close-packed structure along with a schematic of the assembled structure. Scale bar = 5μm. (b) Fourier transform of the image shown in 4(a). The six spot pattern confirms hexagonal packing. (c) Intensity plot along the diagonal lines, shown in 4(b), as a function of the scattering vector q. The different lines represent the three diagonals and the peak position along each diagonal is marked by an arrow.

In an electric field, the disk-shaped zeolite particles orient such that the major axis of the particles is either oriented along the field direction or perpendicular to the field. If the particles orient perpendicular to the field direction, then the dipolar interaction would lead to a face-to-face stacking of particles, whereas a particle orientation parallel to the field direction leads to a side-by-side packing of the initial pearl chain structures. Because the longer axis of the particles is expected to have a larger induced dipole moment, the side to side assembly with the longer axis of the particles oriented with the field direction was not surprising.
C. Assembly near the electrode
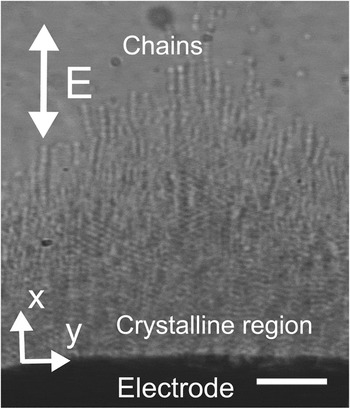
In addition to the assembly in quiescent liquid, the zeolite particles also assemble and form a particle brush at the edge of the electrode. Figure 5 displays an optical microscope image of the particle brush. The particle brush formed because of dipolar interactions between the particles, and therefore it had the same side to side packing we observed in the bulk suspension. However, the relatively strong ACEO flow caused some dipolar chains to extend out from the particle brush. At higher concentrations of particles, the brush was also multilayered. However, because of limited optical resolution, the packing of the subsequent layers could not be imaged. As described previously, the ACEO flow advected particles away the electrode edge and into the bulk solution. Because of the high field strength region near the electrode, the particles were attracted to the neighboring particles through dipolar interactions, which led to the formation of a particle brush growing from the electrode. The electric field strength affected both the magnitude of the dipolar force and the velocity of the ACEO flow. The flow exerted a Stokes drag on the particles and the particle brush grew when the attractive dipolar force exceeded the drag force.
Optical microscope image of the particle brush. The black region at the bottom of the image is the electrode. The dipolar interactions result in the growth of a crystalline brush with individual chains sticking out at the end. Scale bar = 5 μm.

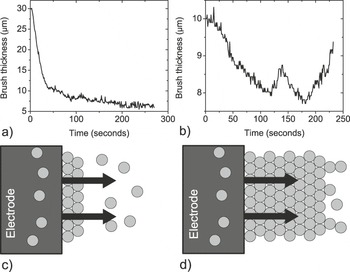
To understand the mechanism of the formation of the particle brush, we studied the change in the brush thickness for a step change in the field strength. The thickness of the particle brush was determined by measuring the intensity variation across the image. The particle brush was allowed to grow for a few minutes at a fixed field strength and frequency. At time t = 0 the field strength was changed stepwise to a lower value and the thickness of the brush was measured as a function of time. Figure 6(a) is a plot of the brush thickness as a function of time when the electric field is reduced in a single, immediate step from 480 to 290 V/cm. The fluctuations in the plot reflect the limited accuracy with which we could determine the brush thickness by analyzing the intensity differences.
Brush thickness as a function of time. At time t = 0 the electric field is reduced stepwise from (a) 480 to 290 V/cm and (b) 480 to 440 V/cm. (c) Schematic showing the brush growth mechanism at low field strength. The arrow signifies the direction of EH flow near the electrode. The flow is strong enough to advect particles with it. (d) Schematic showing the brush growth mechanism at high field strength. The dipolar force is strong enough to promote particle growth farther away from the electrode.

When the electric field was reduced from high to low field strength, the brush thickness decreased and plateaued to a constant value. However, the brush thickness was dynamic when the electric field was reduced, but the field strength was still high enough for the growth to occur [Fig. 6(b)]. As the electric field was reduced, the brush started to melt, but the melting of the brush was also reversed and the brush started to grow again. This was in sharp contrast to the steady melting and an equilibrium brush thickness that we had observed when the field strength was reduced to a low value. From these observations we conclude that at high field strengths the brush growth is a kinetically limited process. As long as the field strength is high enough so that the particles, advected because of ACEO flow, can be captured into the structure, the brush will continue to grow. We observed that the fluctuations in the flow also caused the spatial particle concentration to vary, which resulted in the intermittent melting of the brush. At low field strength the dipolar force was not high enough to trap the particles, and therefore the brush thickness decreased to a constant value.
On the basis of our observations, we now summarize the brush growth mechanism. The schematic in Fig. 6(c) represents low field strength conditions, in which the dipolar force led to the formation of a thin particle brush but the ACEO flow was strong enough to advect the particles past the brush. In contrast, at high field strengths [Fig. 6(d)] the dipolar force was strong enough so that a large number of particles were captured in the growing structure. The magnitude of the electric field decayed with distance from the electrode. Therefore, beyond a critical distance from the electrode, the dipolar force became comparable to the drag force and the brush growth did not proceed any further. As long as the thickness of the brush was below a critical thickness, the brush would continue to grow as the ACEO flow advects the particles to the edge of the brush. However, the presence of the brush also altered the hydrodynamic flow, which can lead to temporal fluctuations in the magnitude of the velocity. This sometimes leads to breakage of the brush, and it thus becomes a dynamic process.
Because the brush growth is a competition between dipolar force and the drag force, we therefore compared the magnitude of dipolar force that the particles experience close to the electrode and the drag force on the particles in the flow field. The electric field strength close to the electrode was calculated using COMSOL, and the vector plot of the electric field strength is shown in the figure 3 of the supplementary information. The dielectrophoretic (DEP) force is given by

where λ is a numerical coefficient of the order of unity, a is the particle radius, h is the particle thickness, E is the local electric field strength, C is the polarizability of the particle, and εm is the dielectric permittivity of the medium. The maximum dipolar force is given by

and the drag force on the particle is

where υ is the flow velocity and constant K (=1.41) is the correction for short cylindrical particles with an aspect ratio of 0.5 in transverse flow.Reference Ui, Hussey and Roper35 A closed-form analytical expression for the polarizability of the cylindrical particles does not exist. We therefore used the spheroidal particle shape to approximate the expressions for field induced forces in Eqs, (1) and (2).Reference Venermo and Sihvola36
At a field strength of 500 V/cm we measured a maximum flow velocity of υ = 60 μm/s, which results in a drag force F drag = 0.25 pN. As we move away from the edge of the electrode the dipolar force was reduced because of decreasing field strength. However, even at a distance of 25μm, F dipolar > F drag. Thus, the electric field strength was strong enough to capture particles that were being convected by the ACEO flow. Comparing the DEP force F DEP, was the dipolar force, F dipolar, we found that the field gradient in the parallel co-planar electrode geometry with millimeter-scale separation was not high enough and F DEP was always less than F dipolar. Far from the edge of the electrode the electric field plateaued to a constant value and F DEP ≪ F dipolar. Reducing the field strength decreased the dipolar interaction and consequently the particles were advected away from the brush.
IV. CONCLUSIONS
In summary, we described the assembly of disk-shaped zeolite particles in an external AC electric field. In the presence of an electric field the particles oriented with their major axis along the field direction. The electric field was applied using a parallel coplanar electrode geometry that resulted in an ACEO flow in the suspension. These flows originated at the edge of the electrode, and the self-assembled structure was formed because of an interplay between an induced dipolar interaction and the drag force because of the ACEO flow. Far from the electrode edge, where the fluid was quiescent, the particles self-assembled into a hexagonal close-packed structure. By controlling the orientation of the particles in the final structure, we also simultaneously controlled the resulting nanoporous network in the zeolite film. Thus, creating ordered structures using zeolite particles is an example of a hierarchical assembly in which both the nanostructure and the microstructure can be controlled by different assembly processes.
In this work we also demonstrated that the 2D hexagonal packing that spherical particles produce in an electric field Reference Lumsdon, Kaler and Velev2 can be generalized to disk-shaped particles. This and previous work using ellipsoidalReference Singh, Lele, Nettesheim, Wagner and Furst8 and needlelike particlesReference Mittal and Furst10 points to several generalizations on the effect of particle shape in field-directed assembly. As seen for disk and ellipsoidal particles, anisotropic particles will typically align in the electric field along an axis that minimizes the cross-sectional area perpendicular to the field. Although this depends on the polarization mechanism, field frequencies can be identified for anisotropic particles that violate this heuristic.Reference Mittal and Furst10 Nevertheless, disks orient with their axis parallel to the field, and ellipsoids orient with their major axis in the field direction. The structure then depends on the particle symmetry in the plane of the assembly. Particles with circular cross sections (spheres, cylinders) give rise to hexagonally close-packed structures with plane group p6, and particles with nonspherical cross sections form open, centered rectangular 2D structures with plane group c2mm.Reference Singh, Lele, Nettesheim, Wagner and Furst8 In all, such emerging design rules are a promising advance for tailoring particle synthesis to create specific assembly morphologies using field-directed assembly.Reference Grzelczak, Vermant, Furst and Liz-Marzán1
ACKNOWLEDGMENTS
We thank A.K. Prasad for help with PIV measurements. Funding from NSF-NIRT (CBET-0506701) and Sandia National Laboratories (Contract No. 678286) is gratefully acknowledged.