INTRODUCTION
In large part, the success of conservation biology depends on an effective transfer of scientific knowledge into conservation practice; this in turn requires the application of science-based criteria to connect scientific knowledge to concrete actions in real-world planning (Robinson Reference Robinson2006). ‘Representativeness’ (Austin & Margules Reference Austin and Margules1984; Mackey et al. Reference Mackey, Nix, Stein, Cork and Bullen1989) is one of the most fundamental criteria for assessing how adequately a protected area (PA) or system of PAs captures the range of biological variation in terms of species and ecosystems in a given region (Groves Reference Groves2003).
Representativeness assessment is a relevant tool for setting conservation priorities for PAs management (Davey Reference Davey1998; Margules & Pressey Reference Margules and Pressey2000), accurately evaluating the representation of wildlife and natural communities within PA networks. Those species and communities not represented in PAs are considered to be ‘conservation gap efforts’, as defined through the process of ‘gap analysis’ (Scott et al. Reference Scott, Davis, Csuti, Noss, Butterfield, Groves, Anderson, Caicco, D'Erchia, Edwards, Ulliman and Wright1993; Jennings Reference Jennings2000; Dudley & Parrish Reference Dudley and Parish2006). At an international scale, the representativeness approach has arisen from the need to assess the effectiveness of ecosystem protection, establish conservation priorities and guide investment (Brooks et al. Reference Brooks, Mittermeier, da Fonseca, Gerlach, Hoffmann, Lamoreux, Mittermeier, Pilgrim and Rodrigues2006). Using ecoregions as classification units at the global scale (Dinerstein et al. Reference Dinerstein, Olsen, Graham, Webster, Primm, Book-binder and Ledec1995; Olson & Dinerstein Reference Olson and Dinerstein2002), zones of high biodiversity and endemism have been identified globally (Myers et al. Reference Myers, Mittermeier, Mittermeier, da Fonseca and Kent2000; Mittermeier et al. Reference Mittermeier, Robles Gil, Hoffmann, Pilgrim, Brooks, Mittermeier, Lamoreux and da Fonseca2004; Kier et al. Reference Kier, Mutke, Dinerstein, Ricketts, Küper, Kreft and Barthlott2005; Lamoreaux et al. Reference Lamoreux, Morrison, Ricketts, Olson, Dinerstein, McKnight and Shugart2006), and their protected status evaluated (Hoekstra et al. Reference Hoekstra, Boucher, Ricketts and Roberts2005). Several studies have applied representativeness assessment for setting conservation priorities at global (Chape et al. Reference Chape, Blyth, Fish, Fox and Spalding2003, Reference Chape, Harrison, Spalding and Lysenko2005; Rodrigues et al. Reference Rodrigues, Andelman, Bakarr, Boitani, Brooks, Cowling, Fishpool, da Fonseca, Gaston, Hoffmann, Long, Marquet, Pilgrim, Pressey, Schipper, Sechrest, Stuart, Underhill, Waller, Watts and Yan2004a, Jenkins & Joppa Reference Jenkins and Joppa2009) and country or regional scales (Powell et al. Reference Powell, Barborak and Rodriguez2000; Sierra et al. Reference Sierra, Campos and Chamberlin2002; Arango et al. Reference Arango, Armenteras, Castro, Gottsmann, Hernández, Matallana, Morales, Naranjo, Renjifo, Trujillo and Villareal2003; Armenteras et al. Reference Armenteras, Gast and Villareal2003; Oldfield et al. Reference Oldfield, Smith, Harrop and Leader-Williams2004; Dietz & Czech Reference Dietz and Czech2005; López & Zambrana-Torrelio Reference López and Zambrana-Torrelio2006; Soutullo & Gudynas Reference Soutullo and Gudynas2006; Maiorano et al. Reference Maiorano, Falcucci, Garton and Boitani2007; Schulman et al. Reference Schulman, Ruokolainen, Junikka, Saaksjarvi, Salo, Juvonen, Salo and Higgins2007; Brugiere & Kormos Reference Brugiere and Kormos2009; Wiersma & Nudds Reference Wiersma and Nudds2009). Representativeness has also been used as a fundamental criterion for prioritizing areas for systematic conservation planning (Davey Reference Davey1998; Margules & Pressey Reference Margules and Pressey2000; Groves Reference Groves2003; Molnar et al. Reference Molnar, Marver and Karieva2004; Pressey Reference Pressey2004).
The definitions of a set of representative PAs and identification of gaps in the current PA system are both important goals in conservation planning (Moilanen Reference Moilanen2008). Representativeness assessment is becoming increasingly relevant to the design of new PA networks, which deal not only with the representation of biodiversity features at ecosystem and species levels, but also attempt to ensure the conservation of evolutionary and ecological processes (Klein et al. Reference Klein, Wilson, Watts, Stein, Carwardine, Mackey and Possingham2009) and adapt PA networks to climate change (Vos et al. Reference Vos, Berry, Opdam, Baveco, Nijhof, O'Hanley, Bell and Kuipers2008; Willis et al. Reference Willis, Dave, Collingham, Hilton, Rahbek and Huntley2009). When beginning a systematic conservation planning process, if it has been established which biodiversity features are represented, then gap analysis may be appropriate for measuring conservation success (Margules & Pressey Reference Margules and Pressey2000). To date, overall vegetation diversity has been used as the main biodiversity measure in terrestrial representativeness assessment (Groves Reference Groves2003; Josse et al. Reference Josse, Navarro, Comer, Evans, Faber-Langendoen, Fellows, Kittel, Menard, Pyne, Reid, Schulz, Snow and Teague2003). Vegetation is a reasonable surrogate for the ecosystem at a given scale because it includes a high proportion of biomass in the ecosystem and reflects the influence of climate and soil conditions (Leuschner Reference Leuschner and van der Maarel2005).
The National System of Protected Wild Areas (SNASPE for its acronym in Spanish) was the first overarching effort in Chile to establish a conservation plan that defined legal boundaries and management objectives for PAs. Several studies have assessed the representativeness of SNASPE in Chile (Weber Reference Weber1983; Mella & Simonetti Reference Mella and Simonetti1994; Prado & Alvarez Reference Prado, Alvarez, Espinoza, Pisani, Contreras and Camus1994; Benoit Reference Benoit, Muñoz, Nuñez and Yañez1996; Arroyo & Cavieres Reference Arroyo and Cavieres1997; Armesto et al. Reference Armesto, Rozzi, Smith-Ramírez and Arroyo1998; Luebert & Becerra Reference Luebert and Becerra1998; Mardones Reference Mardones1998; Pliscoff Reference Pliscoff2003; Luebert & Pliscoff Reference Luebert and Pliscoff2006; Tognelli et al. Reference Tognelli, Ramirez de Arellano and Marquet2008). These assessments have been applied at different scales and used inconsistent ecosystem classifications to assess representativeness. Nonetheless, SNASPE has been criticized for failing to adequately represent the country's ecosystems (Luebert & Becerra Reference Luebert and Becerra1998; Pauchard & Villarroel Reference Pauchard and Villarroel2002) especially in Mediterranean (Myers et al. Reference Myers, Mittermeier, Mittermeier, da Fonseca and Kent2000; Mittermeier et al. Reference Mittermeier, Robles Gil, Hoffmann, Pilgrim, Brooks, Mittermeier, Lamoreux and da Fonseca2004) and grassland ecosystems (Ceballos et al. Reference Ceballos, Davidson, List, Pacheco, Manzano-Fischer, Santos-Barrera and Cruzado2010). Public debate in Chile has led the government to adopt a new policy calling for an integrated public and private PA system (CONAMA [Comisión Nacional del Medio Ambiente] 2005; CONAMA-PNUD [Comisión Nacional del Medio Ambiente-Programa de las Naciones Unidas para el Desarrollo] 2006). One of the major objectives of this new system should be to achieve the minimum 10% representation targets established in the Convention on Biological Diversity (CBD 2004).
This study is the first assessment of the representativeness of this integrated PA system at the national scale. Older analyses only assessed one PA category, commonly SNASPE, and used broader spatial scale ecosystem classification. Specifically, we seek to evaluate the representation of remaining natural vegetation and the effectiveness of public and private PAs under three protection scenarios. These scenarios attempt to capture the current status and medium-term projections for PAs in order to contribute to the development of conservation targets for terrestrial vegetation in Chile.
METHODS
Protection systems
Five PA categories were selected for representativeness assessment: (1) SNASPE (consisting of 30 national parks, 49 national reserves and five natural monuments), (2) private PAs (292 areas), (3) lands protected by the Chilean Ministry of National Heritage (31 areas), (4) nature sanctuaries (31 areas) and (5) priority sites for biodiversity conservation identified by the National Environmental Commission (CONAMA) (68 areas).
The SNASPE makes up the bulk of traditional public PAs in the country and is administrated by the Chilean National Forestry Corporation (CONAF) (Government of Chile 1984). The Ministry of National Heritage also holds public lands managed for conservation established by decree (No. 1939, Articles 1, 19 and 56; Government of Chile 1977). Nature sanctuaries include both public and private lands and are a category established by Chile's National Environmental Law (Government of Chile 1994) and law No. 17 288 on National Monuments (No. 17 288, Article 10; Government of Chile 1970). Private PAs were also defined by Article 35 of the National Environmental Law. They are portions of private land whose owners have voluntarily established conservation objectives. Finally, priority sites for biodiversity conservation were identified by the National Environmental Commission as part of the country's National Biodiversity Strategy (CONAMA 2003). These last areas have no legal protection status but were established as priorities for protection for government purposes.
Additional categories of protection such as scientific interest areas, patrimonial areas, Biosphere Reserves, Ramsar sites, touristic interest zones (ZOIT) and other types of areas were excluded from the analysis for different reasons, such as incomplete datasets and lack of clear biodiversity conservation objectives.
Protection scenarios
Each scenario represents alternative conservation approaches with different degrees of effectiveness, ranging from an exclusively public scenario to a public-private complementary approach. Scenario 1 centred exclusively on SNASPE areas. Scenario 2 (the current protection system) included all types of public PAs, namely SNASPE areas, Nature Sanctuaries and Ministry of National Heritage lands. Scenario 3 included all items in Scenario 2, but also included private PAs and biodiversity priority sites, and was thus a public-private scenario.
Representativeness analysis
We used Luebert and Pliscoff's (Reference Luebert and Pliscoff2006) definitions of vegetation type as our terrestrial ecosystem descriptors, and this is the most detailed vegetation classification system covering mainland Chile (1: 100 000 scale). This system describes 127 vegetation types, defined by the authors using the ‘vegetation belts’ concept (van der Maarel Reference van der Maarel and van der Maarel2005), within 17 vegetation formations. Its combination of detail and coverage facilitates a national-level representativeness assessment.
For the purposes of this study we identified remnant areas of each vegetation type using a detailed classification of Chilean land uses (CONAF et al. 1999). Anthropogenic land uses (agriculture, forestry, urban and mining areas) were then subtracted from the cartography of vegetation types (see Luebert & Pliscoff Reference Luebert and Pliscoff2006).
For each vegetation type, representativeness was evaluated by the following index:

This index allowed for the quantification of current terrestrial ecosystem representativeness under the three different scenarios.
We overlapped data for the PAs and the vegetation types using GIS (Geographic Information System) software ArcGis 9.3 (ESRI, Inc.). Representativeness was assessed by taking a gap analysis approach (Scott et al. Reference Scott, Davis, Csuti, Noss, Butterfield, Groves, Anderson, Caicco, D'Erchia, Edwards, Ulliman and Wright1993; Rodrigues Reference Rodrigues, Akcakaya, Andelman, Bakarr, Boitani, Brooks, Chanson, Fishpool, da Fonseca, Gaston, Hoffmann, Marquet, Pilgrim, Pressey, Schipper, Sechrest, Stuart, Underhill, Waller, Watts and Yan2004b). Results were analysed in order to assess the geographic distribution of vegetation types meeting a 10% protection goal (CONAMA 2003; CBD 2004; Jenkins & Joppa Reference Jenkins and Joppa2009). We used the following protection levels: 0% = lacking protection, 0.1–10% = low protection, and 10.1–100% = meets protection goal.
Protection scenario data were analysed at national level by geographic zones, the North (tropical), Central (Mediterranean), Central South (temperate) and Austral (temperate antiboreal macrobioclimate) zones representing the macrobioclimate divisions of Chile (Luebert & Pliscoff, Reference Luebert and Pliscoff2006). The last two zones were separated at 44° latitude S, where the Andes approach the Pacific coast, creating a distinct environment on the eastern slopes, the Patagonian steppe.
RESULTS
Geographic zones
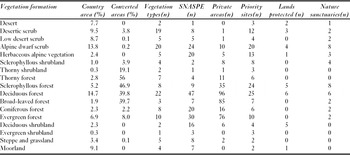
The vegetation formations are not all present in all PA categories (Table 1), and we present our findings on representativeness by geographic zone.
Vegetation formations in Chile, including current areas (excluding water bodies and vegetation-uncovered areas), converted areas and number of units in each category of protected area.

North zone
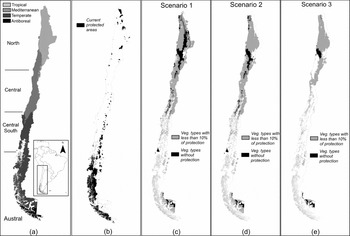
The North zone has six vegetation formations and 39 vegetation types (Fig. 1). Only vegetation types located in the Andean part (east) of the North zone and other inland locations had high vegetation type representativeness in Scenario 1, and these types consisted mainly of Alpine dwarf scrub and thorny forest formations (Table 2). Vegetation types without protection were located in the pre-Andean (low desert scrub formations) and coastal areas (desertic scrub formations). In general, Scenario 2 had low representativeness (< 10%; Table 2), the areas being located mainly in coastal plains, coastal mountains, the central depression and some Andean areas. Vegetation types without protection were located in desertic scrub, absolute desert, low desert scrub and thorny forest formations located in inland and pre-Andean areas, and in valleys. Scenario 3 provided low protection levels for both coastal and interior areas of the North zone, as well as for the desertic scrub formation; almost all the Andean zone had high levels of protection (Table 2).
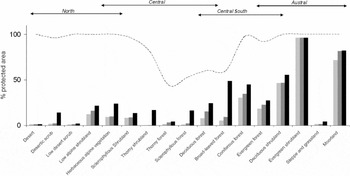
Vegetation formation representativeness in Scenarios 1–3; Scenario 1 = light grey bars, Scenario 2 = dark grey bars and Scenario 3 = black bars. Dashed line indicates the percentage of potential natural vegetation. Arrows indicate latitudinal distribution of each zone.

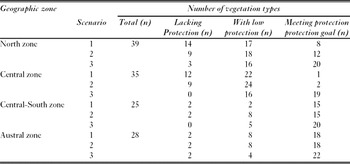
Degree of protection for vegetation types by geographic zone in Chile. Protection levels: 0% = lacking protection, 0.1–10% = low protection and 10.1–100% = meets protection goal.

Central zone
The Central zone has six vegetation formations and 35 vegetation types (Fig. 1). Scenario 1 had low protection levels and protection gaps within the entire zone, and only one vegetation type had more than 10% of its area protected (Table 2). Unprotected vegetation types like thorny forest, thorny shrub, deciduous forest, low scrub and sclerophyllous forest occurred in coastal and southern inland areas of this zone. Scenario 2 was similar to the Scenario 1, but the vegetation belt of coastal areas had a low protection level compared to the gap in Scenario 1. Protection gaps were evident in the southern inland area. In Scenario 3, protection increased throughout the entire area and there were no remaining gaps in vegetation protection. Some Andean areas exceeded the 10% target for all their vegetation types, including sclerophyllous and deciduous forest (Table 2).
Central South zone
The Central South zone had five vegetation formations and 25 vegetation types (Fig. 1). Under Scenario 1, vegetation formations lacking protection, such as deciduous forest, sclerophyllous forest, coniferous forest and thorny forest, were located in northern coastal and inland areas. In contrast, protection levels >10% occurred in both coastal and Andean mountains, the level of protection increasing substantially from north to south. Low levels of protection were evident throughout inland areas, and Scenario 1 did not protect vegetation formations like coniferous forest. In Scenario 2, protection levels of vegetation formations were low (for example in vast areas of the central depression, coastal mountains and coastal plains). In several cases, deciduous forest, sclerophyllous forest, coniferous forest and thorny forest were not protected, while in the coastal mountains, coniferous forest was the only vegetation belt with appropriate protection levels. At the southern limit of this zone, the central depression was a low protection area; higher protection levels were found in the Andes. In Scenario 3, there was an increase in protection compared to the other scenarios, and the increase occurred in both coastal and interior areas. Scenario 3 did not have protection gaps (Table 2).
Austral zone
The Austral zone had five vegetation formations and 28 vegetation types (Fig. 1). In Scenario 1 we observed two distinctive situations: the fjords and coastal channels had a higher level of protection (although this protection varied within the zone) and there was a protection gap in the eastern steppe formations. Under Scenario 2, the protection pattern of Scenario 1 was maintained (Table 2). In Scenario 3, the general pattern of Scenarios 1 and 2 was maintained, but there was an increase in protection levels for the transitional forest-steppe and steppe.
National level
A total of 127 vegetation types were identified for the whole country (Luebert & Pliscoff Reference Luebert and Pliscoff2006), and we compiled a complete list of vegetation types with potential and remnant areas plus protection level in each scenario (Appendix 1, see supplementary material at Journals.cambridge.org/enc).
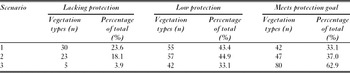
Overall, representation levels relative to the 10% goal varied considerably among vegetation types (Table 3). The North zone contained the largest number of unrepresented vegetation types. This situation improved with Scenarios 2 and 3, but there remained a high proportion of types that had less than 10% of their area protected. Under Scenarios 1 and 2, almost all the vegetation types in the Central zone had <10% of their area protected. Under Scenario 3, the addition of new areas eliminated unrepresented vegetation types and thus the number of vegetation types with >10% of their area protected increased. The Central South and Austral zones had the largest number of vegetation types with the highest level of protection (Fig. 2).
Protection gaps and 10% of representativeness in Chilean terrestrial ecosystems. (a) Macrobioclimate zones of continental Chile, (b) current official PAs. (c) Scenario 1, (d) Scenario 2 and (e) Scenario 3, where vegetation types with no protection are shown in black and vegetation types with some but <10% protection are shown in grey.

Protection for vegetation types at national level: 0% = lacking protection, 0.1–10% = low protection, and 10.1–100% = meets protection goal.

Unprotected and underprotected vegetation types indicated an unbalanced distribution of PAs throughout Chile. High representativeness was found only in the Andean areas of the North and Central South zones, and at the coast in the Austral zones. Vegetation types with low protection were located in the scrub formations of coastal and inland areas of the North zone, in sclerophyllous and thorny forest of the Central zone, and in steppe vegetation in the Austral zone (Fig. 2).
DISCUSSION
Our ecosystem representativeness assessment has identified key gaps in the current system of PAs in relation to the 10% protection target, and shows the extent of representation if priority sites and private PAs were formally incorporated into the Chilean PA system.
Consistent with previous studies (Arroyo & Cavieres Reference Arroyo and Cavieres1997; Armesto et al. Reference Armesto, Rozzi, Smith-Ramírez and Arroyo1998; Luebert & Becerra, Reference Luebert and Becerra1998; Pauchard & Villarroel, Reference Pauchard and Villarroel2002; Arroyo et al. Reference Arroyo, Marquet, Marticorena, Simonetti, Cavieres, Squeo, Rozzi, Mittermeier, Robles-Gil, Hoffmann, Pilgrim, Brooks, Goettsch-Mittermeier, Lamoreux and Fonseca2004; Tognelli et al. Reference Tognelli, Ramirez de Arellano and Marquet2008), we found the SNASPE (Scenario 1) failed to represent the range of Chilean terrestrial ecosystems. In particular, Scenario 1 has low levels of protection in the Chilean Central zone, where no ecosystem exceeds the minimum 10% target of protection of the Chilean National Biodiversity Strategy (CONAMA 2003). In contrast, some areas with high levels of protection are observed in the Southern zone, principally in the coastal range, but steppe ecosystems in the east inland area had low protection levels (Fig. 2). Scenario 2, which represents the current PA system, did not substantially improve the situation; 23 vegetation types and nine vegetation formations were unprotected (Appendix 1, see supplementary material at Journals.cambridge.org/enc). Those vegetation units need to be given top priority if the government is to achieve its goal of minimally representing all the country's ecosystems in PAs. Public-private Scenario 3 highlighted the importance of private PAs for improving the current degree of representativeness (Jackson & Gaston Reference Jackson and Gaston2008; Gallo et al. Reference Gallo, Pasquini, Reyers and Cowling2009). Despite the lack of formal protection and the uncertainty surrounding the conservation objectives of private owners, the inclusion of private PAs has high potential to enhance the representation of unprotected vegetation units, especially in the Central South zone (Fig. 2).
In Chile, the highest land-use conversion for agriculture, forestry and urban uses has occurred between 30°S and 40°S (Arroyo et al. Reference Arroyo, Marquet, Marticorena, Simonetti, Cavieres, Squeo, Rozzi, Mittermeier, Robles-Gil, Hoffmann, Pilgrim, Brooks, Goettsch-Mittermeier, Lamoreux and Fonseca2004). This area includes the Central and Central South zones, and has the lowest number of PAs, which moreover have a geographically unbalanced distribution. As a consequence of land use change, native vegetation has been heavily replaced (Aronson et al. Reference Aronson, Del Pozo, Ovalle, Avendano, Lavín, Etienne, Rundel, Montenegro and Jaksic1998; Pauchard et al. Reference Pauchard, Aguayo, Peña and Urrutia2006; Echeverria et al. Reference Echeverría, Coomes, Hall and Newton2008). Most unprotected ecosystems in the SNASPE are located in the Chilean Matorral ecoregion (Appendix 2, see supplementary material at Journals.cambridge.org/enc), where the lowest protection levels occur and greatest loss of natural vegetation has taken place. The Chilean Matorral ecoregion has been identified as a ‘hotspot’ of global biodiversity (Myers et al. Reference Myers, Mittermeier, Mittermeier, da Fonseca and Kent2000; Mittermeier et al. Reference Mittermeier, Robles Gil, Hoffmann, Pilgrim, Brooks, Mittermeier, Lamoreux and da Fonseca2004), as one of the Global 200 priority ecoregions for global conservation (Olson & Dinerstein Reference Olson and Dinerstein2002), and posited as one of the most endangered ecoregions within the Mediterranean-type areas of the world (Underwood et al. Reference Underwood, Klausmeyer, Cox, Busby, Morrison and Shaw2009).
Novel approaches in systematic conservation planning bring new challenges to representativeness assessment (Hodgson et al. Reference Hodgson, Thomas, Wintle and Moilanen2009). The static analysis of current vegetation types could become redundant in the future, because the rise of new species assemblages under novel climate combinations. Analysis of connectivity appears crucial to address this issue (Rose & Burton Reference Rose and Burton2009). Furthermore, the emergence of ecosystems under novel climate conditions raises questions for representativeness assessment (Williams et al. Reference Williams, Jackson and Kutzbacht2007; Keith et al. Reference Keith, Newton, Herbert, Morecroft and Bealey2009). New methodologies should be developed to address such dynamic landscapes (Beaumont et al. Reference Beaumont, Gallagher, Downey, Thuiller, Leishman and Hughes2009; Marini et al. Reference Marini, Barbet-Massin, Lopes and Jiguet2009; Carroll et al. Reference Carroll, Dunk and Moilanen2010), current representativeness assessments updated and PA systems designed to address climate change (Hannah Reference Hannah2010). These new directions need to be considered for the PA network in Chile. The country's narrow shape could also be useful in the design of corridors of natural vegetation. The adoption of conservation compatible practices outside the PA system could enhance the surrounding natural ecosystems located outside PAs.
CONCLUSION
Gap analysis in the current PA system could be useful for the definition of novel conservation policies and in the identification of priorities for the establishment of new PAs. A new national system of protected areas should be based on representativeness criteria and verifiable objectives. The underrepresentation of vegetation types in Chile's PAs needs correction, starting with the inclusion of vegetation types that currently lack any type of protection.
ACKNOWLEDGEMENTS
This research was conducted within the UNDP-GEF project ‘Building a comprehensive National Protected Area System for Chile: a financial and operational framework’. We thank: Viviana Avalos, John Dwyer, Sebastian Fuentes, Federico Luebert, Andrés Moreira-Muñoz, David Tecklin and two anonymous reviewers for their comments.