This article examines turnout in recent British elections as a function of the closeness of elections, party policy polarization, changes in voting eligibility, the role of new voters and generational differences in behavior, following in the steps of Franklin (Reference Franklin2004). It reasserts and amplifies the relevance of the closeness of the electoral race, the effects of which have been recently questioned or sidelined in favor of other explanations such as delayed transitions to adulthood (Smets Reference Smets2012), declining party identification (Heath Reference Heath2007) or generational value changes and declining civic duty (Blais and Rubenson Reference Blais and Rubenson2013). It does so using improved methods and improved measures that focus predominantly on seat shares and constituency competitiveness, both lagged to the previous election.
We argue that the weak or null findings recently reported for electoral competitiveness are partly a consequence of failure to operationalize its dimensions appropriately, and partly a result of less-than-optimal modeling strategies. We find that closeness of elections at the national level matters mainly for new voters; the competitive environment at the beginning of citizens’ political lives, measured by the closeness of elections at the national level, has a longstanding and palpable effect on turnout. Constituency-level closeness estimated from the previous election, on the other hand, matters to everyone, not only to new voters.
Britain is an ideal case for this analysis. A key advantage is the continuity of the British Election Study (BES), mounted at every parliamentary election since 1964. Minimizing confounding factors, Britain maintains an institutional framework assumed to maximize election effects on choice of government and policy outcomes, potentially enhancing participation. Yet, British voters today are much less likely to show up at the polls than in the past: average turnout rates have dropped from >80 percent in the 1950s to slightly above 60 percent in the first decade of the 21st century. As we demonstrate in this paper, the decline in the competitiveness of general elections has played a major part in explaining this trend.
Related Literature
Research on electoral turnout over the last ten years has been greatly shaped by the work of Franklin (Reference Franklin2004). Using Downsian theory as a starting point, Franklin assumes citizens are rational in the sense that they will be more likely to vote when elections “matter”: when there are potential benefits on offer from one party or another, in the form of party policies, and when there is uncertainty about what candidate would win a constituency or what party would win a majority of seats and thus form a government.
Building on the idea that the competitiveness of elections has a key influence on participation, Franklin argues that much turnout change is driven by changes in the competitive environment. His competitiveness model encompasses various aspects of the context or the salience of elections: the closeness of the outcome, the differences in parties’ policy positions and the rules under which elections are held. All these aspects of competitiveness may interact with the entry of new voters into the electorate. While turnout behavior has rational foundations, it is “sticky:” people acquire habits of voting (or not) during the first few elections in which they have the opportunity to participate. New voters will therefore be more responsive to variations in the competitiveness and salience of elections than older voters who are already “set in their ways.” The characteristics of these initial elections will thus leave a footprint over the course of individuals’ political lives. Having entered the electorate in an environment of low competition and narrow party differences, individuals who learned that elections are a foregone conclusion with few policy consequences may be less inclined to show up at the polls in the future. Similarly, those enfranchised at an earlier age are expected to have a lower turnout profile throughout their lives because their first opportunity to vote in late adolescence was when they were less likely to be primed to do so.
Despite the fact that Franklin points out that close contests between candidates offering distinct policies will tend to boost turnout, his individual-level analysis (Franklin Reference Franklin2004, Chapter 6) treats competitiveness as a short-term factor only. Thus, he fails to estimate the extent to which the competitiveness of elections might socialize younger cohorts into habits of low or high participation, focusing instead on the long-run influence of more structural aspects of the electoral and political environment and on institutional changes such as the lowering of the voting age and the enfranchisement of women.
For researchers following in Franklin’s wake, the influence of the closeness of elections has been confirmed at the aggregate level in time series analysis of British turnout between 1945 and 2005 (Clarke et al. Reference Clarke, Stewart, Sanders and Whiteley2004; Clarke et al. Reference Clarke, Stewart, Sanders and Whiteley2006). But in the most recent contribution to the scholarly debate using pooled time series cross-sectional survey data, Blais and Rubenson (Reference Blais and Rubenson2013) find little evidence that electoral closeness matters, placing their emphasis instead on declining civic duty and political efficacy across successive generations. While in their British analysis, Blais and Rubenson examine the impact of constituency-level margins of victory on turnout since 1974, they operationalize it as shaped by the election in question, effectively assuming that voters can anticipate the results before the ballots are cast.
Meanwhile Heath (Reference Heath2007) contends that, as the closeness of elections has not diminished overtime, this factor can only account for fluctuations in turnout from election to election. He concludes that Franklin’s thesis fails to explain the protracted fall of turnout in Britain, and alternatively pinpoints declining party identification as the key long-term factor. Similarly, transformations in the attitudes and values of younger cohorts and delayed transitions to adulthood figure more prominently than competition in the work of other scholars seeking to explain downturn in participation rates in Britain and elsewhere (e.g., Dalton Reference Dalton2007; Smets Reference Smets2012).
Thus, the importance of close elections as a determinant of turnout change is questioned, with some authors arguing for short-term effects only and others identifying either no effects or negligible ones. Our contention that competitiveness matters is based partly on a more appropriate measurement and estimation approach, but also begs the question of the micro-level processes that lead us to expect competition not only to boost turnout, but also to have long-term effects.
We begin with the commonly accepted notion that there are direct and indirect influences of competition on individuals. The direct influences pertain to the relationships between closeness, pivotality and the consumption benefits that motivate participation (Riker and Ordeshook Reference Riker and Ordeshook1968). Even though the probability of casting the decisive vote remains remote, individuals tend to overestimate their chances of doing so (Duffy and Tavits Reference Duffy and Tavits2008; Dittmann et al. Reference Dittmann, Kubler, Maug and Mecthenberg2014), such that they perceive the benefits of voting to outweigh the costs. Moreover, models that incorporate additional considerations, such as uncertainty about the relative popularity of the candidates—which is likely to be greater in close races—or the payoffs that voting can bring to groups, predict sizable turnout among instrumental voters (Myatt Reference Myatt2012; Smith, Bueno de Mesquita and LaGatta Reference Smith, de Mesquita and LaGatta2012). Indirect effects of competition occur via its influence on intensified party and group mobilization efforts, as well as intensified media coverage of elections, with these in turn enhancing political efficacy, knowledge, interest, discussion and social pressure, all of which ultimately spur an individual’s likelihood of voting (Cox and Munger Reference Cox and Munger1989; Leighley and Nager Reference Leighley and Nagler2007; Gerber, Green and Larimer Reference Gerber, Green and Larimer2008). Furthermore, there is evidence both of the socializing influence of competition on the participation of adolescents in subsequent elections (Pacheco Reference Pacheco2008), suggesting the possibility of long-term effects, as well as of enduring effects of competition in adulthood (Evans, Ensley and Carmines Reference Evans, Ensley and Carmines2014).
Studies vary, however, in the ways in which they operationalize competitiveness: whether based on local or national indicators, on subjective versus objective measures, and even about whether “actual competitiveness” should be represented by the closeness of the outcome or from polls taken before the election (McDonald and Tolbert Reference McDonald and Tolbert2012; Evans, Ensley and Carmines Reference Evans, Ensley and Carmines2014). This suggests that there might be important differences regarding the indicators of competition that are salient to voters, although alternative measures are rarely contrasted or tested against each other in the same study.
In the case of single-member plurality systems such as Britain’s, the outcome of the previous general election is predominantly reported in terms of parliamentary seats, not vote shares. The likelihood of a close election is thus shaped by the gap between the numbers of seats held before the election and the shift in the numbers of seats required for a change of government. Winning a general election does not require the largest vote share, but rather capturing a majority of the seats in the House of Commons. Hence, the seat margin at the last election is one indicator of competition. Expectations about the upcoming contest are likely to influence turnout as well, and pre-election poll data have been extensively used along with party seat shares in the electoral forecasting literature attempting to predict the behavior of UK voters and in modeling turnout behavior at the aggregate level (Whiteley Reference Whiteley2005; Whiteley et al. Reference Whiteley, Sanders, Stewart and Clarke2011). Besides general election results, margins of victory at the constituency level have also been shown to influence participation in Britain (Denver and Hands Reference Denver1974; Denver and Hands Reference Denver and Hands1985). At the local level, the outcomes of previous races are arguably more important than the anticipated results for the current election, particularly as these will influence attempts to mobilize voters (Denver, Hands and McAllister Reference Denver and Hands2003; Denver Reference Denver, Hands and McAllister2007).
Building on these arguments, our paper re-examines the impact of competitiveness on turnout based on refined and multiple measures of election closeness and a more appropriate estimation approach. As we show below, these measures reveal that the last 60 years have witnessed a secular trend toward less competitive elections in Britain. Hence, drawing on and extending Franklin’s (Reference Franklin2004) theoretical framework, it becomes important to examine whether and to what extent the closeness of elections might have more persistent effects on turnout than previously thought. This article therefore provides a more comprehensive test of both the short- and long-term impact of competitiveness on the habit of voting at the individual level than prior research in this area.
Data and Methods
Our dependent variable, taken from the 1964–2010 BES, is a dummy indicating whether survey respondents voted or not in the corresponding election. Vote validation has been conducted as part of the BES since 1987. Given the differences typically found between reported turnout and official statistics (Katz and Katz Reference Katz and Katz2010), our baseline analysis uses the validated vote as outcome. However, as a robustness check, and because self-reported vote is available from 1964 onwards, we also present results from models fitted to the non-validated samples.Footnote 1
To operationalize the closeness of elections, we must take into account what information influences voters’ perceptions about the certainty of the outcome. We consider several alternative indicators. As argued above, the most concrete information available to citizens is the result of the most recent general election. Hence, we use Lagged Seat Margin, the seat-share gap between the two major parties at election-year t−1, as one of our measures of competitiveness. Expectations about the upcoming contest are measured by the (natural logarithm of the) difference in public support for the two leading parties in the Last Polls conducted during the campaign. Lagged Constituency Vote Margin, the winning candidate’s margin over the runner up at the previous election, is also incorporated as a measure of local-level competitiveness. Where boundary changes have taken place, estimates of old votes reapportioned into new constituencies have been applied.
The extent of policy difference between British parties—or, in Franklin’s (Reference Franklin2004) terms, the polarization of the party system—is captured through two alternative measures: Right-Left Manifesto Differences, reflecting the extent to which election manifestos offer different policy prescriptions;Footnote 2 and Perceived Party Differences between the Conservatives and Labour, coded from BES participants’ opinions of whether there is “a good deal,” “some” or “not much” difference between them. The latter might be a more useful indicator than the variable constructed from manifesto content, as it is likely to be determined by what voters actually think are the salient policy issues.
Our empirical analysis also accounts for two key institutional variables that are part of Franklin’s (Reference Franklin2004) model and capture the rules under which elections are held: Young Initiation, an indicator for generations entering the electorate after the lowering of the voting age (from 21 to 18) in 1969; and Late Female Franchise, a dummy for women who came of voting age before the introduction of women’s suffrage in 1928. Based on Franklin’s analysis, both variables should be negatively correlated with turnout.
In addition, we control for several socio-demographic variables commonly used as proxies for citizens’ resources and their susceptibility to mobilization (e.g., Rosenstone and Hansen Reference Rosenstone and Hansen1993; Plutzer Reference Plutzer2002): education, gender, marital status, occupation, urban residence, religion, church attendance, union membership and the natural logarithm of age.Footnote 3 Respondents’ turnout in the previous election is added to further control for persistence in voting behavior (Denny and Doyle Reference Denny and Doyle2009). These variables capture relevant characteristics of the individuals, rather than of the election.
We also include in the analysis variables that have been identified as important determinants of turnout change in recent studies in order to test whether our results hold even when taking alternative explanations into consideration. In particular, following Heath (Reference Heath2007) and Blais and Rubenson (Reference Blais and Rubenson2013), we account for the strength of respondents’ Party Identification and for their sense of Civic Duty and Political Efficacy. A description of the coding and sources for all the variables can be found in the Online Appendix.
We fit a series of area-age-period and area-age-period-cohort models (Xu and Hertzberg Reference Xu and Hertzberg2013; Yang and Land Reference Yang and Land2013) to account for micro and macro (constituency-, generation- and election-specific) influences on voting behavior. In order to separate temporal changes in voting patterns into aging, election and cohort components, we adopt the generalized linear mixed modeling framework proposed by Yang and Land (Reference Yang and Land2013). These authors note that, when examining microdata from repeated cross-sectional surveys, individual-level age-specific observations can be seen as simultaneously embedded in two distinct higher-level social contexts defined by time period and cohort. This motivates the use of a hierarchical model in which age is regarded as an individual fixed attribute and cross-classified random intercepts are defined to capture election-year and cohort effects, along with relevant higher-level covariates. This modeling approach thus avoids treating the three temporal variables as additive fixed effects, breaking the perfect linear relationship between them and thereby sidestepping the well-known “identification problem” of conventional age-period-cohort analyses (Yang and Land Reference Yang and Land2013, Chapter 4). In addition, to accommodate unobserved time-invariant heterogeneity in electoral participation, we include constituency-specific random terms in the multilevel specification.
Our basic model is thus:
 $${\rm Pr}(Y_{{ijkt}} =1)=\Phi (\alpha _{{jkt}} {\plus}X'_{{ijkt}} \beta ),$$
 $$\alpha _{{jkt}} =Z_{{jkt}}^{'} \gamma {\plus}{\rvarepsilon}_{j} {\plus}\mu _{k} {\plus}\omega _{t} ,$$
where Y
ijkt
is the turnout decision of individual
 $$i,\,i=1,\:\,\ldots\,\:,\,I_{{jkt}} ,$$
within constituency
 $j=1,\:\,\ldots\,,\:J,$
and cohort
 $k=1,\:\,\ldots\,,\:K,$
at election
 $$t=1,\:\,\ldots\,\:\:,T, \cdot X_{{ijkt}} $$
the vector of individual-level predictors (including the natural logarithm of age); Z
jkt
comprises an overall constant and all the level 2 or contextual predictors (our measures of electoral closeness among them);
 $${\rvarepsilon}_{j} \sim{\ri N}(0,\sigma {}_{{\rvarepsilon}}^{2} ),\mu _{k} \sim {\ri N}(0,\sigma {}_{{\rvarepsilon}}^{2} )\,{\rm and}\,\omega _{t} \sim{\ri N}(0,\sigma {}_{{\rvarepsilon}}^{2} )$$
and
 $\omega _{t} \simN\left( {0,\sigma _{\omega }^{2} } \right)$
are constituency, cohort and election random effects, respectively; and Φ(·) is the standard normal distribution. We apply different versions of this model in the Empirical Analysis section.
This empirical strategy enables us to examine the short- and long-term impact of competitiveness on turnout while simultaneously assessing the influence of life cycle, generational and election-year effects and controlling for a rich set of micro- and macro-level covariates. Our approach also improves on some of the previous work applying age-period-cohort models to analyze participation trends in Britain. For instance, while Blais and Rubenson (Reference Blais and Rubenson2013) contend that their definition of age and cohort allows them to reduce the collinearity between these variables, they do not formally address the structural non-identifiability problem that plagues these models.Footnote 4 Heath (Reference Heath2007), in turn, assumes that all the relevant generational characteristics are captured by a few observables, neglecting unobserved heterogeneity and potential error correlation among citizens who came of age at roughly the same time.
As the number of election-years (13) in our study is probably too small to satisfy the asymptotic criteria required by maximum likelihood estimation, we employ Bayesian inference via Markov chain Monte Carlo (MCMC) simulations.Footnote 5 Recent work (e.g., Gelman Reference Gelman2006; Austin Reference Austin2010) has demonstrated that Bayesian inference yields accurate estimates of the regression parameters and variance components of hierarchical models with fewer than 10 clusters, provided the number of observations per group is reasonably large, as is clearly the case in our study. For comparison, we also report significance levels obtained from likelihood-based methods.Footnote 6
Because the variables obtained from the 1964–2010 BES exhibit a large proportion of missing values, we relied on multiple imputation (Honaker and King Reference Honaker and King2010) to fill those gaps.Footnote 7 For robustness, we report the results of analyses using list-wise deletion in the Online Appendix.
Empirical Analysis
A First Look at the Data
We begin with a simple analysis of the correlations between turnout and our measures of electoral competitiveness: Lagged Seat Margin, Last Polls, Lagged Constituency Vote Margin, Right-Left Manifesto Differences and Perceived Party Differences. For completeness, we also inspect other variables considered in Franklin’s theoretical framework as important determinants of turnout: Majority Status, defined as the absolute percentage distance of the majority party from receiving 50 percent of the vote; Time since Last Election, measured in years; and the Size of the Electorate. The size of the majority party can be seen as mediating the link between voting and policy outcomes, as a party commanding a larger support might be in a better position to get its policies enacted without having to bargain with a coalition partner. The length of time since the previous election, in turn, may affect voters’ eagerness to express their political opinions at the polls, while changes in the number of registered voters can shift the balance between established and new cohorts.
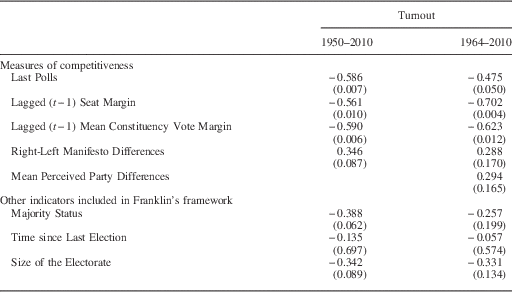
Table 1 reports the correlations between turnout and each of these indicators for all elections between 1950 and 2010, as well as for the restricted 1964–2010 period covered by the BES. Lagged Seat Margin and the mean Lagged Constituency Vote Margin are strongly negatively and significantly associated with turnout: the correlation coefficients range from −0.56 to −0.70 and the p-values for the null hypothesis of no correlation are always about 0.01, suggesting that indicators of both national- and constituency-level closeness should be taken into consideration when modeling electoral participation in Britain.Footnote 8 Moreover, this finding provides preliminary evidence of the potency of between-election variations in the seat (at the national level) and vote (at the constituency level) margins as predictors of turnout in the United Kingdom. The expected national-level vote margin, operationalized by Last Polls, is also systematically and negatively related to turnout (p-values of 0.007 for 1950–2010 and 0.05 for 1964–2010), although the strength of this correlation becomes somewhat weaker for the period covered by the BES.
Correlations Between Turnout and Electoral Competitiveness

Note: Lagged Mean Constituency Vote Margin is the difference in vote shares between the first and second most voted candidates in each constituency in the previous election, averaged across all constituencies. Mean Perceived Party Differences averages the opinions of British Election Study survey respondents regarding the differences between the Conservative and Labour parties. The other variables are defined in the text.
The p-values for the (one-sided) hypothesis tests of no correlation are reported in parentheses.
Among the other indicators in Table 1, the polarization of the party system—as measured by the Right-Left Manifesto Differences—is associated with higher turnout levels between 1950 and 2010 (p-value=0.087), while Majority Status and the Size of the Electorate are negatively correlated with electoral participation (p-values of 0.062 and 0.089, respectively). None of these relationships is significant, though, once we focus on the last 13 general elections. The mean Perceived Party Differences, on the other hand, does correlate positively and significantly with turnout from the late 1970s on (p-value=0.038), a time of great contrasts between Thatcher’s Conservative government implementing neo-liberal economic policies and a Labour opposition that had moved to the left (Heath Reference Heath2007).
The finding of a systematic relationship between the closeness of national and local elections and turnout since the 1950s is surprising, as it seems to contradict the traditional characterization of competition as a short-term force oscillating from election to election. To have a cumulative effect on electoral participation, it has been argued, the fall in competitiveness should last long enough to socialize increasing proportions of the electorate into low turnout habits.
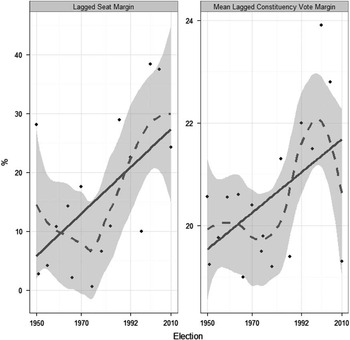
Figure 1 reveals that there is indeed a growing trend in Lagged Seat Margin, especially from 1974 onwards. Lagged seat gaps rose in every election from 1951 to 1964 and from (October) 1974 to 1987, with an almost 50-fold increase across these last four general elections.
Temporal evolution of national- and constituency-level margins 1950 and 2010Note: dots represent lagged seat margins (left panel) and mean constituency vote margins (right panel) for each election between 1950 and 2010. Dashed lines correspond to locally weighted regression curves fitted to the data, with the 90 percent confidence intervals given by the shaded areas. Solid black lines represent linear trends.

The lagged vote margin averaged across constituencies also exhibits an ascending tendency over this period, although here the surge is less pronounced. Still, the correlations between each of these measures and the passage of time are positive, significant and relatively large: 0.55 for Lagged Seat Margin and 0.49 for the average Lagged Constituency Vote Margin, with p-values<0.05 in both cases. These relationships continue to be significant if we restrict attention to elections between 1964 and 2010 (p-values of 0.004 for Lagged Seat Margin and 0.037 for the mean Lagged Constituency Vote Margin).
Hence, we conclude that when properly defined and operationalized, declining competitiveness is a persistent phenomenon in British elections, and not just a short-term factor as postulated by Heath (Reference Heath2007).
The Short- and Long-Run Effects of Electoral Competition
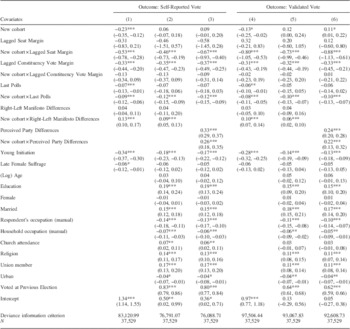
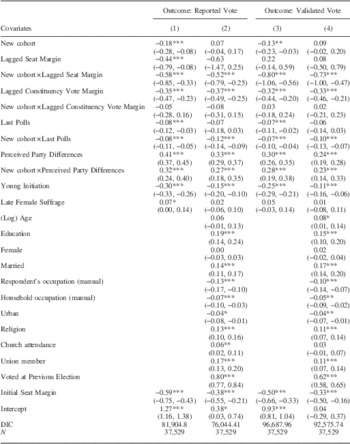
To better estimate the short- and long-term impact of electoral competitiveness on turnout, we move to the individual-level analysis of the 1964–2010 BES. Table 2 reports posterior summaries from alternative hierarchical probit models fit to the survey data, using self-reported (columns 1–3) and validated (columns 4–6) vote as outcomes and including constituency- and election-specific random intercepts to account for unobserved heterogeneity at both levels. All the models are fitted to the data with imputed missing values; the basic results for the complete-case analyses are similar, as shown in Table A1 of the Online Appendix.
Posterior Summaries for the Parameters of Cross-Classified Random Effects Probit Models

Note: The table reports (fixed) coefficient estimates from hierarchical probit models using self-reported (columns 1–3) and validated (columns 4–6) vote as outcome, the latter based on imputation before 1987. The 90 percent highest posterior density credible intervals are reported in parentheses. Figure A1 in the Online Appendix plots the receiver operating characteristic curves for these models, showing that all of them outperform a random prediction null model.
We also report significance levels from the likelihood-based estimation of the models: ***0.01, **0.05, *0.1.
The specifications include the measures of the closeness of national and local races discussed in the Data and Methods section (Lagged Seat Margin, Lagged Constituency Vote Margin and Last Polls) and the two measures of polarization considered: Right-Left Manifesto Differences (columns 1–2 and 4–5) and Perceived Party Differences (columns 3 and 6). To account for differences in the impact of the electoral context among newly enfranchised and “established” generations, each of these variables is interacted with New cohort, a dummy for respondents interviewed in any of the first three general elections for which they were eligible to vote (Butler and Stokes Reference Butler and Stokes1974; Franklin Reference Franklin2004). All the models also incorporate indicators for the two fundamental changes in electoral laws underscored by Franklin (Reference Franklin2004)—Young Initiation and Late Female Suffrage—on the right-hand side, and columns 2–3 and 5–6 add socio-demographic controls as well.Footnote 9
Several conclusions emerge from the table. First, the influence of national-level competitiveness on turnout is markedly stronger for respondents facing one of their first, second or third elections than for more politically experienced individuals. This is illustrated by the significant interactions of Lagged Seat Margin, Last Polls and the two measures of polarization with New cohort.
Furthermore, neither the past nor the expected closeness of the national elections is systematically related to the turnout decision of the average member of established cohorts once we control for individual-level characteristics. Only the perceived ideological differences between the major parties (columns 3 and 6) have a mobilizing effect on experienced voters at the national level, consistent with the view that races that present electors with clear alternatives tend to boost participation in general (Grofman Reference Grofman1993). The fact that the coefficient for Perceived Party Differences is significant even for experienced voters, while that for Right-Left Manifesto Differences is not, suggests that the former may be a better measure of the policy issues that are salient for voters.Footnote 10
These findings indicate that members of incoming cohorts are more responsive to the competitive environment of national elections than members of older generations. By contrast, there are no significant differences in the way in which “new” and “old” voters react to the closeness of local races: larger margins of victory at the constituency level at time t−1 consistently depress turnout among all respondents.
The evidence in Table 2 also supports Franklin’s (Reference Franklin2004) hypothesis that the lowering of the voting age had a persistent influence on participation for those individuals who were exposed to the experience of voting before they were ready to benefit from it. The estimates for Young Initiation indicate that subjects who entered the electorate at 18 are significantly less likely to cast a ballot in subsequent elections than those who gained the right to vote at 21. The coefficient for Late Female Franchise is also negative, suggesting that women who had become set in the habit of abstaining during their formative years remained less inclined to vote than those who reached voting age after the introduction of women’s suffrage. However, this variable is only systematically different from 0 in the complete-case analysis of validated data (Table A1).
As for the role of “resources” and “mobilization” variables, university educated, married, Christian respondents and union members are more likely to vote than other subjects, while manual workers tend to participate less. To the extent that mobilizing efforts are routes by which the electoral environment may influence individuals’ voting decisions (Franklin Reference Franklin2004), including proxies for such efforts—like church attendance or union membership—probably attenuates the effect of competition on turnout. Therefore, the fact that our measures of competitiveness “survive” these controls is indicative of their strength as determinants of electoral participation, especially among new cohorts. The estimates for Voted at Previous Election are also positive and highly significant across all specifications, underlining the force of inertia as a determinant of turnout.
In addition, it is worth noting that the correlation between vote and (the natural logarithm of) age is statistically indistinguishable from 0 in all the specifications. This indicates that the strong positive effects of this variable in conventional turnout models may be capturing the influence of some of the other predictors included in our analysis. In particular, the coefficient for age becomes more than 2 SD greater than 0 once we drop past vote from the controls, suggesting that one of the reasons why older voters turnout at higher rates than younger ones is because they are more likely to have already developed the habit of voting, in line with Plutzer (Reference Plutzer2002) and Franklin (Reference Franklin2004).
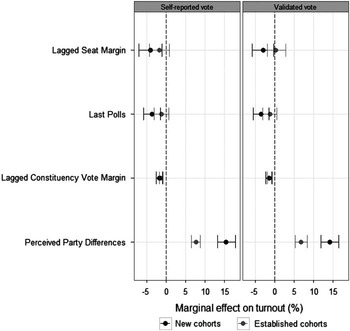
As the parameters of generalized linear regression models are notoriously difficult to interpret, Figure 2 summarizes the average predictive comparisons (Gelman and Hill Reference Gelman and Hill2007) or “marginal effects” for the measures of competitiveness included in our preferred specifications (Table 2, columns 3 and 6).Footnote 11 These can be interpreted as the expected shift in the probability of voting associated with a change in each independent variable, holding all other regressors fixed.
Expected change in the probability of voting associated with a change in the measures of electoral competitivenessNote: the figure plots the expected change in the probability of voting associated with a unit change in each predictor, discriminating between new and established cohorts. Solid circles represent point estimates (in percentage points); horizontal lines give the 90 percent highest posterior density intervals.

Keeping everything else constant, a 1 SD increase (roughly 12.5 percent) in the seat gap between the two major parties at the previous general election reduces the probability that the average member of the incoming cohort votes next time by about 4 percentage points. The drop in the probability of voting associated with a 1 SD increase in the expected vote difference between the two leading parties is also 3–4 points for new electors. The figure highlights that, had we not explicitly accounted for the differential impact of the electoral context on “young” and “old” voters, we would have concluded that neither of these variables has an effect on individual turnout decisions. On the other hand, each percentage point increase in the vote-share gap between the two most popular candidates in an earlier local race is associated with a 0.1 point decline in turnout for the average survey participant, regardless of whether she entered the electorate recently or not.
Perceived policy differences between the major parties also have a systematic influence on the behavior of both “new” and “old” voters, although the effect is twice as large for the former: members of incoming (established) cohorts who believe that there is a good deal of difference between the Conservative and Labour parties are about 0.14 (0.07) more likely to vote than those who feel there is little distinction between them. Altogether, these estimates show that, while the electoral context is not the only factor affecting participation, the character of elections carries considerable influence.
However, the previous analyses underestimate the role of competitiveness, as they only consider its short-term influence. As argued before, the rising seat margins observed in British elections over the last decades could have enduring effects. To explore this possibility, we incorporate a new variable, Initial Seat Margin, recording the average seat margin during the first three elections in which each respondent had the right to vote. If individuals’ political socialization leaves a lasting impression on voting behavior, and given the sizeable negative estimates for the interaction between Lagged Seat Margin and New cohort in Table 2, it is reasonable to expect that respondents whose first electoral experiences took place in less competitive environments should be less likely to vote in the future than those who faced close races.
Table 3 reports posterior summaries from models that add Initial Seat Margin to the specifications in Table 2. The coefficient for this variable is always negative and significant, confirming our expectation.Footnote 12 Each percentage point increase in Initial Seat Margin is associated with a 0.1 point decrease in the likelihood of voting for the average respondent, after controlling for other individual and contextual factors. To put it differently, and holding everything else constant, the probability of voting for someone who could first do so in the early 1970s (the period with the lowest seat gaps in the last 40 years) is about 2 points higher than for a subject entering the electorate from 1997 onwards. The cumulative effect of the rising margins of victory becomes more evident once we notice that the latter group already comprises more than a quarter of the voting-age population, while the former represents <8 percent. Estimates for the other measures of competitiveness remain largely similar to those in Table 2.
Posterior Summaries for the Parameters of the Models Accounting for Long-Term Effects of Rising Seat Margins

Note: the table reports (fixed effects) estimates from hierarchical probit models using self-reported (columns 1–2) and validated vote (columns 3–4) as outcome. The 90 percent highest posterior density intervals are reported in parentheses.
We also report significance levels from the likelihood-based estimation: ***0.01, **0.05, *0.1.
DIC=deviance information criterion.
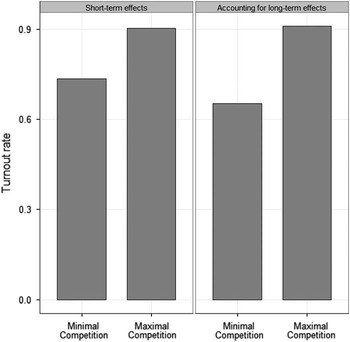
To better illustrate the total impact of electoral competition on turnout, Figure 3 uses posterior draws of the parameters in Table 3 to simulate two alternative competitive scenarios. The left panel shows that, holding everything else constant, shifting the lagged and expected margins of victory from their minimum to their maximum values and simultaneously moving perceived party polarization in the opposite direction would lead to a decline of >15 percentage points in the average turnout rate. Moving Initial Seat Margin from its lowest to its highest value further increases the turnout gap between both scenarios by 10 points (right panel).
Average turnout rates under alternative competitive environmentsNote: the figure plots the average turnout rate for 1964–2010 under two competitive environments. Under the “Minimal Competition” scenario in the left panel, Lagged Seat Margin, Lagged Constituency Vote Margin and Last Polls are fixed at their largest values, and Perceived Party Differences are held at their minimum. In the “Maximal Competition” scenario, local- and national-level margins are set at their lowest values, while Perceived Party Differences are held at their maximum. In the right panel, additionally, Initial Seat Margin changes from its largest to its lowest value.

We also estimated models including other measures of the competitive environment prevailing during each respondent’s first three elections: Initial Constituency Vote Margin, Initial Poll Margin and Initial Level of Polarization. As we show in Figure A4 of the Online Appendix, there is evidence that the expected closeness of national elections at the beginning of respondents’ electoral lives also has a long-lasting influence on their voting behavior. On the other hand, neither Initial Constituency Vote Margin nor the Initial Level of Polarization has a significant impact on future turnout decisions. This suggests that some features of the competitive environment may be too volatile to have a protracted influence on turnout patterns, as argued by Heath (Reference Heath2007) and Blais and Rubenson (Reference Blais and Rubenson2013), or simply made no lasting impression. But our estimates for Initial Seat Margin also reveal that individuals who could first vote in elections that exhibited larger seat gaps are less prone to show up at the polls throughout their adult lives than those who faced closer races in their first few electoral experiences. This is a novel finding that contrasts with previous work assuming that the closeness of elections could only have an ephemeral impact on turnout.
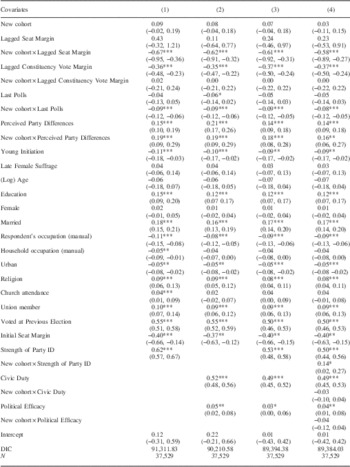
Finally, to account for other possible explanations of turnout decline and for unmeasured formative experiences that may affect generation-specific participation rates, Table 4 reports estimates from different models including cross-classified random effects for cohorts, constituencies and elections. Our definition of cohorts follows Franklin (Reference Franklin2004, 69), discriminating between 13 generational groups according to the election-year in which they became eligible to vote: pre-1955, 1959, 1964, 1966, 1970, 1974, 1979, 1983, 1987, 1992, 1997, 2001 and post-2001.Footnote 13 All the specifications include the same set of covariates as our previous models. In addition, column 1 controls for (the strength of) Party Identification, a key variable for explaining turnout change according to Heath (Reference Heath2007), and column 2 includes respondents’ sense of Civic Duty and Political Efficacy, which feature prominently in Blais and Rubenson’s (Reference Blais and Rubenson2013) work. Both sets of variables are added to the baseline specification in column 3, while column 4 interacts them with New cohort to allow for differences in their effect between new and established voters.Footnote 14 All the models are fitted to the validated data with imputed missing values; results for self-reported vote and complete-case analyses are presented in the Online Appendix.
Hierarchical Models Accounting for Cohort-Specific Heterogeneity and Additional Determinants of Turnout Change

Note: The table reports (fixed) coefficient estimates from hierarchical probit models accounting for unobserved cohort-specific effects. The 90 percent highest posterior density intervals are reported in parentheses.
We also report significance levels from the likelihood-based estimation: ***0.01, **0.05, *0.1.
DIC=deviance information criterion.
The conclusions are similar to those drawn from earlier models: close elections featuring stark policy choices motivate individuals to show up at the polls more than less competitive races. As established before, the effect of the closeness of the general election and the ideological contrast between the contenders is stronger for voters who are not yet set in their ways, and the coefficient for Initial Seat Margin remains always significant. Hence, while partisanship, sense of civic duty and perceived external efficacy are positively correlated with turnout, electoral competition retains a direct and sizeable impact on voting: the difference in the average turnout rates between the “minimal” and “maximal” competition scenarios is still about 25 percentage points.
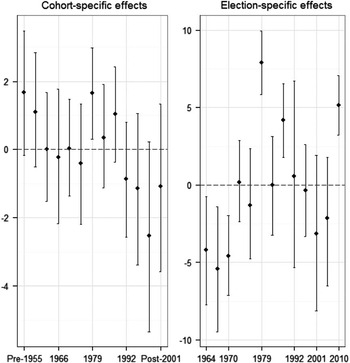
Obviously, other contextual factors may also contribute to explain differences in turnout. As seen in the left panel of Figure 4, which plots the average residual effects of the cohorts across elections, there is in fact some variation in the propensity to vote between generations. Other things equal, entering the electorate just before the 1979 election is associated with a 2 percentage point increase in the probability of showing up at the polls. The figure also reveals that respondents who came of age after 1990 exhibit a negative propensity to vote, although these cohort effects are not significant once we control for individuals’ and elections’ characteristics. The right panel, in turn, indicates that besides the competitiveness of the race, unmeasured election-specific forces also had a notable impact on individuals’ decision to turnout.
Cohort- and election-specific random effectsNote: the figure plots the change in the likelihood of voting across cohorts (left panel) and elections (right panel). Solid circles represent point estimates (in percentage points); vertical lines give the 90 percent highest posterior density intervals.

Nonetheless, even accounting for other observed and unobserved determinants of turnout, the evidence in this paper shows that transformations in the competitive environment—when properly conceptualized, measured and modeled—have substantially contributed to short-run fluctuations as well as to the long-term decline of electoral participation in Britain.
Final Remarks
We have rigorously examined the roles of the different political settings under which new voters are socialized—variations in the closeness of elections, objective and perceived differences between party policies, and generational effects—and how they may have affected turnout in British elections since 1964.
Our analysis has confirmed that the electoral context has a strong impact on turnout and, moreover, that it has contributed to turnout change in British elections over the last 50 years. The closeness of national elections and the policy polarization of the party system have a marked influence on the behavior of new voters, as Franklin has argued. Although lower margins of victory at the constituency level also boost participation, this effect extends to all voters, with little difference between incoming and established cohorts.
Additionally, respondents who faced less competitive environments on the first few occasions they could vote are more likely to abstain than other survey participants. Our work thus stresses and complements Franklin’s arguments about the persistent influence that the first electoral experiences have on citizens’ turnout decisions. Just as the lowering of the voting age had an enduring negative effect among individuals who could first vote under the new rule, those who learned that elections “do not matter” in their formative years continued to be relatively less inclined to vote throughout their adult life. The protracted decline in the competitiveness of British elections has had a cumulative effect on participation, contradicting prior work that ignored the long-term implications of competition for turnout.