

Background
The estimated prevalence of post-traumatic stress disorder (PTSD) in veterans deployed to Afghanistan and Iraq since 2000 has ranged from 2 to 26% (Hoge et al. Reference Hoge, Auchterlonie and Milliken2006; Hotopf et al. Reference Hotopf, Hull, Fear, Browne, Horn, Iversen, Jones, Murphy, Bland, Earnshaw, Greenberg, Hughes, Tate, Dandeker, Rona and Wessely2006; Smith et al. Reference Smith, Ryan, Wingard, Slymen, Sallis and Kritz-Silverstein2008b ; Thomas et al. Reference Thomas, Wilk, Riviere, McGurk, Castro and Hoge2010; Davy et al. Reference Davy, Dobson, Lawrence-Wood, Lorimer, Moores, Lawrence, Horsley, Crockett and McFarlane2012; Dobson et al. Reference Dobson, Treloar, Zheng, Anderson, Bredhauer, Kanesarajah, Loos, Pasmore and Waller2012; Kok et al. Reference Kok, Herrell, Thomas and Hoge2012; Elbogen et al. Reference Elbogen, Johnson, Wagner, Sullivan, Taft and Beckham2014). While a number of studies have shown that events over the life cycle (including adversity in childhood and deployment stressors), are associated with increased rates of PTSD (Brailey et al. Reference Brailey, Vasterling, Proctor, Constans and Friedman2007; Phillips et al. Reference Phillips, Leardmann, Gumbs and Smith2010; Horesh et al. Reference Horesh, Solomon, Zerach and Ein-Dor2011; Jones et al. Reference Jones, Sundin, Goodwin, Hull, Fear, Wessely and Rona2013), fewer studies have focused on the underlying events associated with PTSD diagnoses or the time taken for PTSD symptoms to appear and subside after traumatic events. A greater understanding of the time-course of PTSD may help to identify those at risk and the number of individuals likely to present with PTSD symptoms at different times after exposure to traumatic events.
The psychological impact of war has long been recognised to produce both immediate and long-term psychopathology (Grinker & Spiegel, Reference Grinker and Spiegel1945; Kardiner, Reference Kardiner1947). Delayed-onset PTSD occurs when ‘at least six months have passed between the traumatic event and the onset of the symptoms’ (American Psychiatric Association, 2000). Studies have estimated that this type of presentation may account for between 0 and 68% of PTSD cases (Andrews et al. Reference Andrews, Brewin, Philpott and Stewart2007), while a meta-analysis estimated that proportion of PTSD cases with delayed-onset was 25% (Smid et al. Reference Smid, Mooren, van der Mast, Gersons and Kleber2009). Understanding delayed presentations is important for military populations, given the exceptional circumstances under which they operate and the range of traumatic events they may be exposed to. Further, military personnel may appear healthy at mental health screening soon after deployment, but may not remain mentally healthy over time.
In cases of delayed-onset PTSD, we know little about the mechanisms responsible for the reactivation and exacerbation of symptoms in vulnerable individuals, when initial symptoms are not followed by normal recovery. In some cases of delayed-onset PTSD, the full disorder may only be revealed after experiencing another stressful event, not necessarily related to the original trauma (Brewin et al. Reference Brewin, Andrews, Hejdenberg and Stewart2012). In other cases a trigger reminiscent of the original trauma may prompt a delayed increase in PTSD symptoms (Christenson et al. Reference Christenson, Walker, Ross and Maltbie1981; Andrews et al. Reference Andrews, Brewin, Philpott and Stewart2007).
If PTSD develops over an extended period, it may be possible to identify early signs of the subsequent disorder. Specific risk factors shown to be associated with the development of delayed-onset PTSD in a military population include previous episodes of depression and alcohol misuse (Andrews et al. Reference Andrews, Brewin, Stewart, Philpott and Hejdenberg2009). People may also use alcohol to relieve symptoms of anxiety and depression after traumatic events (Kofoed et al. Reference Kofoed, Friedman and Peck1993; Volpicelli et al. Reference Volpicelli, Balaraman, Hahn, Wallace and Bux1999). The analysis of alcohol use and other psychological measures as risk factors of PTSD, may be particularly informative, as these items are typically collected at post deployment screens or health assessments.
The Centre for Australian Military and Veterans Health has undertaken studies designed to assess the health of Australian Defence Force (ADF) personnel deployed to countries to Australia's Near North Area of Influence (NNAI, e.g., East Timor) and to the Middle East Area of Operations (MEAO, i.e., Afghanistan and Iraq). Linked data from participants of these studies provide the opportunity to assess changes in the reporting of PTSD symptoms over time and the reported events associated with these symptoms among current and ex-serving ADF members.
This study uses a cohort of ADF personnel who deployed to the MEAO, to address the following research questions:
-
• Is there an association between the number of stressful events recorded and the severity of PTSD symptoms?
-
• How consistently do people report stressful events (which could result in PTSD) over time?
-
• Do new stressful events trigger memories of previous events, and does the type of new event influence the type of older event that was recalled?
-
• In a group of personnel who have previously experienced a stressful event, is it possible to identify those most at risk of developing PTSD symptoms, based on their level of alcohol use and psychological distress?
Methods
Data collection
The data were collected as part of two studies of ADF members. The NNAI studies (Survey 1), conducted from 2007 to 2008, included 5911 current or former ADF members deployed to the Solomon Islands (between 2003 and 2005), Bougainville (1997–2003) and East Timor (1999–2005) and comparison groups of non-deployed personnel who were in the ADF at the time of those operations. The deployments to Bougainville and the Solomon Islands were peacekeeping operations, whereas the East Timor deployment included both warlike and non-warlike operations. The MEAO study (Survey 2), conducted in 2010–2011, included 14 032 current or former ADF members who had deployed to Iraq, Afghanistan or supporting areas in the Middle East, between 2001 and 2009. Each of these studies used cross-sectional self-reported surveys, designed to assess the traumatic and environmental exposures and health outcomes associated with deployment to each location. Full details of the personnel invited to take part in each study are documented in the original study reports (McGuire et al. Reference McGuire, Waller, D'Este, McClintock, Treloar and Dobson2009a , Reference McGuire, Waller, Loos, Nielsen, Cosgrove, Bleier, McClintock, Treloar and Dobson b , Reference McGuire, Waller, Bleier, Loos, Nielsen, Cosgrove, McClintock, Nasveld, Treloar and Dobson c ; Dobson et al. Reference Dobson, Treloar, Zheng, Anderson, Bredhauer, Kanesarajah, Loos, Pasmore and Waller2012).
The two data sources were linked to identify responders who were in both the NNAI (Survey 1) and MEAO studies (Survey 2). The resulting dataset of participants who completed both surveys was used to examine changes over time in PTSD Checklist Civilian Version (PCL-C) scores in the same people, and examine the reporting of stressful events. There were 1965 people who completed the NNAI survey and also deployed to the MEAO. The linked dataset of NNAI and MEAO study participants with two completed surveys contained 1351 individuals (69%).
Demographic variables including gender, service (Navy, Army, Air Force), rank (commissioned officer, non-commissioned officer, other ranks) and age (25–34, 35–44, 45+ years) were sourced from the ADFs human resource database (PMKeyS) at the time of data collection for the MEAO survey (Survey 2).
Measures
The PCL-C (Weathers et al. Reference Weathers, Litz, Herman, Huska and Keane1993) is a self-report rating scale for assessing the 17 Diagnostic and Statistical Manual Version-IV (American Psychiatric Association, 1994) symptoms of PTSD. A cut-off of 50 has been used as an indicator of PTSD occurrence in military populations (Forbes et al. Reference Forbes, Creamer and Biddle2001), whereas a cut-off of 30 has been used in civilian settings (Bliese et al. Reference Bliese, Wright, Adler, Cabrera, Castro and Hoge2008).
In the MEAO study (Survey 2), responders were asked to describe any events they were thinking of when completing the PCL-C. They could report up to three events and the year(s) when each event occurred. They were also asked to describe any other event that caused a similar reaction and the year it occurred. The responses from these questions were used to create a count of the number of events (0–4) experienced at the time of each survey. Similar data on stressful events experienced were also collected from the NNAI surveys (Survey 1), where participants were given one (Solomon Islands Health study) or two free text spaces to describe events and the years they occurred (Bougainville and East Timor studies).
The life events checklist (LEC-5) (Gray et al. Reference Gray, Litz, Hsu and Lombardo2004) contains a list of 16 events which could result in PTSD. The list of events included disasters, accidents, assaults, injuries and sudden accidental deaths. In the primary analysis, only stressful events reported that were consistent with those on the LEC-5 were counted. The Kessler Psychological Distress Scale (K10) was used to measure non-specific psychological distress (Andrews & Slade, Reference Andrews and Slade2001). The Alcohol Use Disorder Identification Test (AUDIT) measured alcohol use and screened for alcohol use disorders (Babor et al. Reference Babor, Higgins-Biddle, Saunders and Monteiro2001). The PCL-C, K10 and AUDIT were included in all the NNAI and MEAO surveys.
Statistical analysis
Categorical PCL-C scores (intervals 17–29, 30–49, 50–85) were compared between the two surveys using tests for symmetry and marginal homogeneity. To assess how the PCL-C scores (range 17–85) changed between the two surveys, multilevel modelling was used to account for the correlated repeated measures data for each responder. A compound symmetry covariance structure was assumed. PCL-C score was the outcome measure and the number of events reported at Survey 2 was used to calculate the main explanatory variables. By taking into account the year each of the events occurred a timeline was constructed and the cumulative number of recalled events which occurred before each survey was calculated. The cumulative numbers of events at the time of each survey were fitted as explanatory variables. An interaction term between survey (Survey 1 or 2) and number of events was fitted to assess the extent to which events that occurred between the surveys were associated with increased PCL-C scores.
The stressful events recorded at each survey were compared by assessing the ‘free text’ descriptions of the events provided by the responders and the year the events were reported to have occurred. One author (M. W.) examined each of the free text descriptions of traumatic events, identified those events consistent with the LEC-5 and assessed the consistency of reporting between the surveys (Surveys 1 and 2). Through this process we identified:
-
• people who recorded the same event on each survey (i.e., consistently reporting the same event);
-
• people who did not mention on Survey 2 an event they had previously reported on Survey 1 (i.e., no longer reporting previous event); and
-
• people who recalled at Survey 2, stressful events from before Survey 1, which they had not previously reported (at Survey 1) (i.e., recalling an old event).
To investigate whether those who reported new stressful events between the surveys were more likely to recall these older events, a logistic regression model was used with recall of previously unreported events at Survey 2 as the outcome, and number of events reported in the time period between the two surveys as an explanatory variable. In these cases, where people recalled a previously unreported event at Survey 2, we also examined whether any new events recorded (between the surveys) were similar in nature to the recalled event.
Linear regression models were used to assess in a group without PTSD (PCL-C < 30, at Survey 1), whether factors other than PCL-C score at Survey 1, could be used to predict who would subsequently report more PTSD symptoms (at Survey 2). We assessed whether an association existed between K10 scores at Survey 1 (explanatory variable) and PCL-C scores at Survey 2 (outcome variable). A similar analysis was used to assess the association between AUDIT scores at Survey 1 (explanatory variable) and PLC-C scores at Survey 2 (outcome variable). This analysis was limited to those who had reported at least one stressful event which occurred before Survey 1 (on either survey) and who did not exhibit medium or high levels of PTSD at Survey 1 (PCL-C < 30). The intention of this analysis was to characterise those most at risk of developing PTSD symptoms among responders who reported exposure to a stressful event but who were not initially exhibiting many PTSD symptoms. All models were adjusted for gender, service, rank and age.
A sensitivity analysis was undertaken for each analysis, this time counting all reported events, rather than only those consistent with the LEC-5 checklist (i.e., including other stressful events such as marriage breakdowns and general workplace stressors). The results of these sensitivity analyses are provided as supplementary material.
A further sensitivity analysis assessed to what extent the differences in the number of spaces provided to report traumatic events between the two surveys, could have affected the results. In this analysis, all those who recalled an old event on Survey 2 which they had not mentioned on Survey 1, but who had used all the available spaces on Survey 1, were identified and omitted.
Results
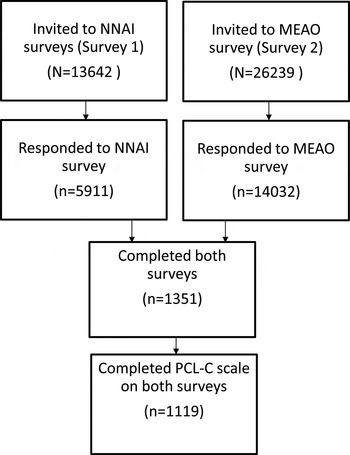
In total 5911 completed one of the NNAI questionnaires (Survey 1, response rate 43%) and 14 032 completed the MEAO survey (Survey 2, response rate 53%). In both surveys, response rates were higher among currently serving personnel compared with ex-serving members, while lower ranks and younger age groups had lower response rates (McGuire et al. Reference McGuire, Waller, D'Este, McClintock, Treloar and Dobson2009a , Reference McGuire, Waller, Loos, Nielsen, Cosgrove, Bleier, McClintock, Treloar and Dobson b ; Dobson et al. Reference Dobson, Treloar, Zheng, Anderson, Bredhauer, Kanesarajah, Loos, Pasmore and Waller2012). After linking the two studies, there were 1351 people who completed both questionnaires and 1119 of these completed the PCL-C on both surveys (Fig. 1).
Response to Australia's Near North Area of Influence (NNAI) and Middle East Area of Operations (MEAO) studies.

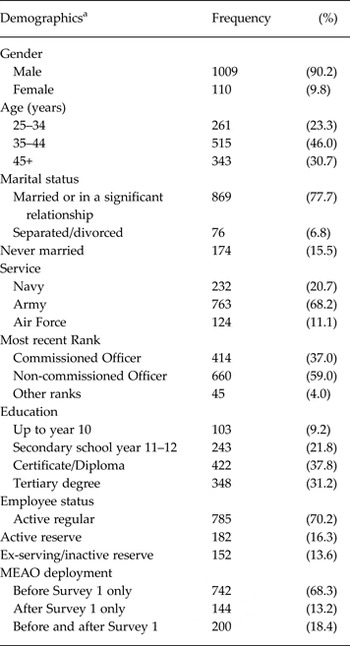
The responders in this analysis sample were predominantly male (90%), married (78%) and serving regular ADF personnel (70%). Army members made up 68% of responders, with 11% from the Air Force (Table 1). All responders had deployed to the MEAO between 2001 and 2009.
Demographic characteristics of ADF personnel who responded to Survey 1 (NNAI, 2007–2008) and Survey 2 (MEAO, 2010–2011) (n = 1119)

ADF, Australian Defence Force; MEAO, Middle East Area of Operations; NNAI, Australia's Near North Area of Influence.
a Status as of 2010 (Survey 2).
Number of stressful events reported and PCL-C score
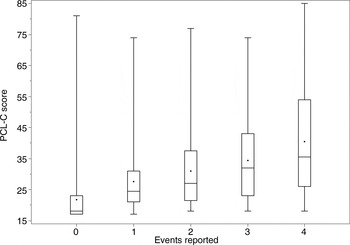
Those who reported more events (consistent with the LEC) at Survey 2 had a higher mean PLC-C score at that survey (Fig. 2). The mean PCL-C score in those who reported no events was 21.8 (Standard Deviation (s.d.) 8.9), whereas those who reported 1, 2, 3 and 4 events had mean PCL-C scores of 27.6 (s.d. 10.0), 31.0 (s.d. 12.1), 34.4 (s.d. 13.1) and 40.5 (s.d. 17.0), respectively. The prevalence of meeting the criteria for probable diagnosis of PTSD (PCL-C ≥ 50) in those who reported 0, 1, 2, 3 and 4 events was 3.0, 4.0, 8.3, 13.9 and 28.0%, respectively.
Distribution of post-traumatic stress disorder Checklist Civilian Version (PCL-C) scores at Survey 2 by the number of stressful events reported at Survey 2 (n = 1119). The minimum and maximum values are shown to be the lowest and highest lines on each diagram. The dot within the box represents the mean. Horizontal lines within each box are the quartiles and the median.

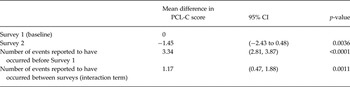
For responders who reported no events at Survey 2, PTSD symptoms declined between the two surveys (mean difference in PCL-C −1.5, 95% CI (−2.4, −0.5)), whereas each event which occurred before Survey 1 was associated with an increase of 3.3 points on the PCL-C, 95% CI (2.8, 3.9). Events which occurred between the two surveys were also associated with a smaller but statistically significant increase of 1.2 points on the PCL-C scale, 95% CI (0.5, 1.9) (Table 2).
Association between stressful events recorded at Survey 2 and change in PCL-C scores, in responders who completed Survey 1 (NNAI) and Survey 2 (MEAO) (n = 1119)*

LEC-5, life events checklist; MEAO, Middle East Area of Operations; NNAI, Australia's Near North Area of Influence; PCL-C, post-traumatic stress disorder Checklist Civilian Version.
* Adjusted for gender, service (Navy, Army, Air Force), Rank (Commissioned Officer, Non-commissioned Officer, Other Ranks) and Age (25–34, 35–44, 45+). Only including stressful events consistent with the LEC-5 checklist.
Changes in PCL-C scores between the surveys
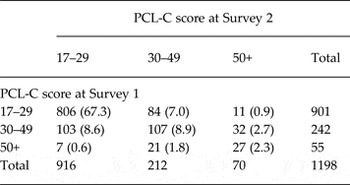
The average time between the surveys was 2.7 years (s.d. 0.6). The mean PCL-C scores were similar between the two surveys (Survey 1: 25.7 (s.d. 10.1), Survey 2: 25.8 (s.d. 11.8)). The PCL-C scale was split into three categories 17–29 (low), 30–49 (subsyndromal) and 50–85 (high), and the score categories at the two time points were cross-tabulated. The majority of responders (78%) remained in the same category (e.g., low on Survey 1 and low on Survey 2), 11% moved down a category (e.g., high to subsyndromal), whereas 11% moved up a category (e.g., subsyndromal to high) (Table 3). The tests for symmetry and marginal homogeneity were not statistically significant (p = 0.16, p = 0.08, respectively), indicating that most people stayed in the same PCL-C category between the two surveys.
Change in PCL-C scores between surveys (n = 1198)

PCL-C, post-traumatic stress disorder Checklist Civilian Version.
A large proportion of the 70 people in the highest PCL-C category (50–85) at Survey 2, were in the high (50–85, n = 27, 38.6%) or subsyndromal (30–49, n = 32, 45.7%) categories on the earlier survey. Fewer people moved from the lowest (17–29) to the highest PTSD categories (50–85) (n = 11, 15.7%) between the surveys.
Types of events recorded
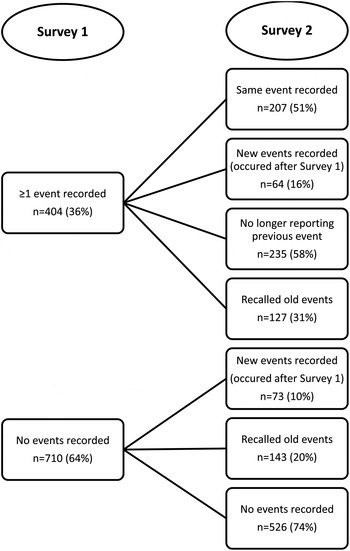
Stressful events recalled at the time of completing the PCL-C scale included traumatic experiences on deployment, workplace stressors and relationship and family issues. Of those who reported an event on Survey 2, 69% recorded something that occurred on an overseas operation. The events recorded at each survey were not always consistent. Examining only those events which correspond to the LEC checklist, 51% of those who reported an event at Survey 1 reported the same event at Survey 2 (Fig. 3).
Reporting of stressful events at each survey (n = 1114). NB: Categories at Survey 2 are not mutually exclusive (person can be in more than one category), so percentages do not add up to 100%.

In those who reported an event at Survey 2, 61% (269 persons) recalled an event that occurred before Survey 1 that they did not mention when completing the first survey (Supplementary Table 1). Of these, 52 persons (19%) reported new events, which had occurred between the surveys. In those who reported new events between the surveys, 26/52 (50%) reported an event which was of a similar type to the one they reported to have occurred before Survey 1.
Results from the logistic regression model which included the number of new events reported between the two surveys as an explanatory variable, showed that those who reported events that occurred between the two surveys were more likely to report events from before the first survey which they had not previously mentioned (OR 1.47, 95% CI (1.16, 1.86), p = 0.0014 for each additional event, Supplementary Table 2).
There were 48 people who reported an older event on Survey 2, which they had not previously mentioned, possibly because of insufficient space on Survey 1. If this were the case for all 48 responders, the percentage who recalled an event at Survey 2 that occurred before Survey 1, which was not previously mentioned, would be reduced to 50% (from 61%, Supplementary Table 1). However, further sensitivity analyses which excluded these responders or recoded their category of response, produced almost identical results to those presented in this results section.
Predicting increases in PCL-C score
In those with low levels of PTSD symptoms (PCL-C ≤ 29) at Survey 1, but who reported (in either survey) a stressful event prior to Survey 1, a higher K10 score at Survey 1 was significantly associated with a higher PCL-C score at Survey 2. An increase of 10 points on the K10 scale at Survey 1 was associated with a mean PCL-C score that was 6.2 points higher at Survey 2 (Table 4). Higher numbers of stressful events occurring before Survey 1 and between surveys were also associated with higher PCL-C scores at Survey 2. Alcohol use at Survey 1 was not associated with a higher PCL-C score at Survey 2, in the same group (Supplementary Table 3).
Association between K10 score at Survey 1 and change in PCL-C score at Survey 2 in those with few symptoms of PTSD (PCL-C ≤ 29) at Survey 1 who recorded at least one stressful event before Survey 1 (n = 338)*

K10, Kessler Psychological Distress Scale; LEC-5, life events checklist; PCL-C, post-traumatic stress disorder Checklist Civilian Version; PTSD, post-traumatic stress disorder.
* Adjusted for gender, service (Navy, Army, Air Force), Rank (Commissioned Officer, Non-commissioned Officer, Other Ranks) and Age (25–34, 35–44, 45+). Only including stressful events consistent with the LEC-5 checklist.
A sensitivity analyses, counting all stressful events recorded instead of only those consistent with the LEC-5 checklist produced similar results. The inclusion of other stressful events (such as marriage breakdown and general workplace stressors) did not alter the interpretation or conclusions from any of the primary analyses (Supplementary Tables 4–8, Supplementary Figures 1 and 2).
Discussion
Overall, the mean PCL-C scores in the two surveys were similar, and 78% of responders stayed in the same PCL-C category. Only a small percentage moved from having few symptoms of PTSD (PCL-C < 30) in Survey 1 to meeting the criteria for PTSD (PCL-C ≥ 50) at Survey 2 (1% of all responders, 16% of those with PCL-C ≥ 50 at Survey 2). Most responders with PTSD at the time of the second survey were people who had exhibited medium or high levels of PTSD (PCL-C ≥ 30) in the previous survey. This group may represent individuals with delayed-onset PTSD, whose symptoms gradually worsened until full PTSD criteria were met (American Psychiatric Association, 2000).
The number of stressful events recorded was significantly associated with more symptoms of PTSD. It is unclear whether earlier or more recent stressful events were more strongly associated with the increase in the PCL-C scores. However, the findings are consistent with the cumulative effect of stressful events being associated with increasing PTSD symptoms (McEwen & Stellar, Reference McEwen and Stellar1993). Our findings suggest that individuals are not necessarily overwhelmed by one single traumatic experience, rather cumulative life events exhaust the coping responses required for readjustment and leave individuals vulnerable to altered psychopathology (Andrews et al. Reference Andrews, Brewin, Stewart, Philpott and Hejdenberg2009; Horesh et al. Reference Horesh, Solomon, Zerach and Ein-Dor2011).
Consistent with previous studies assessing the reporting of traumatic events over time there were some differences in the events recorded by participants on the two surveys (Roemer et al. Reference Roemer, Litz, Orsillo, Ehlich and Friedman1998; Hepp et al. Reference Hepp, Gamma, Milos, Eich, Ajdacic-Gross, Rossler, Angst and Schnyder2006). This inconsistency in reporting suggests that a large proportion of stressful events became less noteworthy, whereas some events gained importance. The recall of older events on the second survey which were not mentioned on the first survey, may be consistent with a delayed-onset of PTSD symptoms. Once individuals begin to re-experience past trauma, as part of their PTSD symptoms, it would be expected that they would identify these events when asked to recall traumas, even if they previously saw them as being of little significance.
Previous research has suggested that delayed-onset PTSD may develop after a new event triggers thoughts of a previous trauma (Brewin et al. Reference Brewin, Andrews, Hejdenberg and Stewart2012), particularly if the nature of the new event is similar to a past stressful experience (Andrews et al. Reference Andrews, Brewin, Philpott and Stewart2007). Consistent with this hypothesis, we found that those who reported recent stressful experiences between the surveys were also more likely to recall older events they had not mentioned previously. Further, among those participants who newly reported a previous stressful event and reported a new stressful event between the surveys, for approximately half, the recent event was similar to the older event they reported.
Among responders who experienced a stressful event but who did not exhibit symptoms of PTSD at the first survey, those who reported more stressful experiences were more likely to develop more symptoms of PTSD by the second survey. Both traumatic events reported to have occurred before Survey 1 and those that occurred between surveys were significantly associated with increased PTSD symptoms. Again this suggests a cumulative effect of stress over time, taking into account precipitating factors (events from before Survey 1) and perpetuating factors (more recent events between Survey 1 and Survey 2).
In persons with few PTSD symptoms (PCL-C < 30) on Survey 1, a higher level of psychological distress, measured by the K10 scale at Survey 1, was significantly associated with more PTSD symptoms a few years later. Consistent with these results, others have reported that a pre-existing diagnosis of anxiety or affective (Breslau et al. Reference Breslau, Davis, Andreski and Peterson1991) or depressive disorder (Andrews et al. Reference Andrews, Brewin, Stewart, Philpott and Hejdenberg2009) are associated with increased risk of PTSD.
In our study, alcohol misuse was not associated with subsequent development of more PTSD symptoms. Although previous research identified alcohol misuse as a marker for those at risk of developing PTSD (Andrews et al. Reference Andrews, Brewin, Stewart, Philpott and Hejdenberg2009) that study did not control for traumatic events. It may be that alcohol misuse alone does not contribute to the development of PTSD; however, in some cases alcohol misuse may be co-morbid with another mental disorder, or a person might drink to control psychological distress (Kofoed et al. Reference Kofoed, Friedman and Peck1993; Volpicelli et al. Reference Volpicelli, Balaraman, Hahn, Wallace and Bux1999).
Previous studies have identified that stressful events such as prior assault (Smith et al. Reference Smith, Wingard, Ryan, Kritz-Silverstein, Slymen and Sallis2008a ), serious accidents and childhood adversity are associated with increased symptoms of PTSD (Jones et al. Reference Jones, Sundin, Goodwin, Hull, Fear, Wessely and Rona2013). Exposure to combat (Booth-Kewley et al. Reference Booth-Kewley, Larson, Highfill-McRoy, Garland and Gaskin2010; Maguen et al. Reference Maguen, Lucenko, Reger, Gahm, Litz, Seal, Knight and Marmar2010; Phillips et al. Reference Phillips, Leardmann, Gumbs and Smith2010) and other stressful experiences on deployment (Waller et al. Reference Waller, Treloar, Sim, McFarlane, McGuire, Bleier and Dobson2012) are also strongly associated with PTSD symptoms. Currently the ADF conducted one post deployment psychological immediately before or after members depart the area of operation, and another 3–6 months after an operation (McFarlane et al. Reference McFarlane, Hodson, Van Hooff and Davies2011). When screening for PTSD, it is important for health professionals to consider both traumatic experiences on deployment and other stressful life events, as well as other mental health problems, even when individuals do not exhibit symptoms of PTSD on initial assessment. Likewise it is important to anticipate future events (e.g., later deployments), which may act as triggers of PTSD.
Limitations
The following limitations should be considered. The survey response rates were between 43 and 53%, so there may be some response bias. There were some differences between the surveys. Survey 1 provided up to two spaces for participants to record events when completing the PCL-C measure, whereas Survey 2 had four spaces. However, a sensitivity analysis showed that this difference between the survey questions was unlikely to have affected the results and conclusions presented. More space to record events on each survey would have been preferable, as would more specific information on the timing of the onset of PTSD symptoms.
Conclusion
This study provides insight into the mechanisms of psychological distress and trauma experienced by ADF personnel as it relates to the time-course of PTSD. More stressful events were associated with increased symptoms of PTSD. The reporting of stressful events varied over time indicating that while the impact of some stressors endure, others may increase or decline in importance. By assessing other measures of psychological distress, it may be possible to identify personnel at greater risk of delayed-onset PTSD after a traumatic event.
Acknowledgements
The authors would like to acknowledge Dr Annabel McGuire and Jeeva Kanesarajah for helpful comments in the paper.
Financial support
The original studies used in this research were funded by Department of Defence under the Deployment Health Surveillance Program (DHSP).
Conflict of interests
None.
Ethical standard
The research undertaken for this paper was approved by the Australian Defence Joint Health Command Low Risk Ethical Review Panel. The original MEAO Census study and NNAI studies from which the data were sourced were approved by the Australian Defence Human Research Ethics Committee, the Department of Veterans’ Affairs Human Research Ethics Committee and The University of Queensland Behavioural and Social Sciences Ethical Review Committee.
Author contributions
M. W., A. D., R. I, F. C. and H. W. developed the original research questions. M. W. undertook the statistical analysis and was responsible for the preparation of the paper. All authors reviewed and contributed to the paper produced.
Supplementary materials and methods
The supplementary material for this article can be found at http://dx.doi.org/10.1017/S2045796015000517