

Introduction
As the baby boomers begin to reach 65 years of age, the demographic distribution of the world's population is changing. The World Health Organization1 estimated that adults over the age of 65 would triple, to nearly 1.5 billion or 16% of the total world population by 2050. This increase is expected to be particularly strong in developing countries such as China and India, with projections of 330 million and 227 million over the age of 65, respectively. Whereas some seniors age successfully and meet or exceed life expectancy, many others experience a lower quality of life and a higher proportion of chronic diseases,Reference Fried, Ferrucci, Darer, Williamson and Anderson2–Reference Ferrucci, Guralnik, Studenski, Fried, Cutler and Walston5 which inhibit their ability to function independently. For many countries, the management of these chronic diseases places a heavy burden on their healthcare systems. Another World Health Organization report concludes that chronic disease is the leading global cause of death.6 The high incidence of chronic diseases and inability to function independently in seniors often arise in settings of high levels of frailty.Reference Fried, Ferrucci, Darer, Williamson and Anderson2,3,Reference Ferrucci, Guralnik, Studenski, Fried, Cutler and Walston5 Frailty is long recognized as representing increased vulnerability to adverse health outcomesReference Rockwood and Theou7,Reference Fried, Tangen, Walston, Newman, Hirsch and Gottdiener8 and has been associated with falls, fractures and disability,Reference Ensrud, Ewing, Taylor, Fink, Cawthon and Stone9 and poor health status;Reference Rockwood, MacDonald, Sutton, Rockwood and Baron10 as such, frailty has been established as a clear risk factor for morbidity and mortality.Reference Zampini11–Reference Garcia-Gonzalez, Garcia-Pena, Franco-Marina and Gutierrez-Robledo13
Reducing or eliminating risks, and increasing protective factors, offer some potential to reduce frailty. Levers et al. Reference Levers, Estabrooks and Ross Kerr14 identified age, sex, disease, social factors, economic factors, malnutrition and poor physical functioning as risk factors in frailty, with physical inactivity also being identified as the fourth leading risk factor for global mortality.6 The association between frailty or adverse health outcomes and physical activity has focused mostly on moderate-vigorous intensity activity (e.g. exercise). Even so, there is increasing evidence of an association between high levels of sedentary behaviour (e.g. watching TV, driving) and increased frailty or adverse outcomes such as cardiovascular problems, metabolism, depression and obesity,Reference Bauman, Ainsworth, Sallis, Hagstromer, Craig and Bull15–Reference Healy, Wijndaele, Dunstan, Shaw, Salmon and Zimmet18 even in individuals who meet the recommended level of moderate-vigorous physical activity.Reference Healy, Dunstan, Salmon, Shaw, Zimmet and Owen19
The purpose of this paper is to review the association between frailty, moderate-vigorous physical activity (MVPA) and sedentary behaviour. We will first examine and compare how frailty has been theoretically and operationally defined, followed by recognized definitions of physical activity and sedentary behaviour. We will then review the association between physical activity and frailty. While increasing moderate-vigorous physical activity appears to reduce frailty in some individuals, the novel association between increased sedentary behaviour and greater levels of frailty also merits discussion. The patterns of inactivity of older adults will be explored and preferred methods to measure both moderate-vigorous physical activity and sedentary behaviour will be summarized. Finally, we will discuss the potential implications of this association, and what future research is needed.
Search methods
For this review we utilized PubMed and MEDLINE as the primary search bases, although World of Science database, the World Health Organization website and a few other reliable websites and books were consulted as well. The initial search terms included a combination of the following terms: ‘frailty’, ‘ageing’, ‘physical activity’, ‘MVPA’, and ‘sedentary behaviour.’ Given the novelty of the topic to be reviewed, we did not limit the initial searches by article type, publication date or species type.
Defining and measuring frailty
Frailty is a term that has seen increasing use over the past two decades. Frail people have an increased vulnerability to adverse health outcomes, which is the result of an age-associated decline in multiple physiological systems.Reference Rockwood and Theou7,Reference Fried, Tangen, Walston, Newman, Hirsch and Gottdiener8,Reference Rockwood20,Reference Xue21 The two most commonly used approaches to frailty differ in that Fried et al. Reference Fried, Tangen, Walston, Newman, Hirsch and Gottdiener8 view frailty as a syndrome, while Rockwood and colleaguesReference Rockwood20–Reference Mitnitski, Graham, Mogilner and Rockwood22 see it as a state.
Fried et al. Reference Fried, Tangen, Walston, Newman, Hirsch and Gottdiener8 propose a continuous cycle of frailty arising with chronic malnutrition, sarcopaenia (the loss of muscle mass and strength), poor resting metabolic rate and poor total energy expenditure. Fried et al. Reference Fried, Tangen, Walston, Newman, Hirsch and Gottdiener8 suggest that there is no single cause, but instead that many different factors play a role in the emergence of each other, so that frailty can arise from any point in the cycle. The accumulation of deficits approachReference Mitnitski, Graham, Mogilner and Rockwood22 sees frailty as a state that arises when damage (either environmental or intrinsic, the latter largely arising as by-products of metabolism) goes either unrepaired or unremoved, resulting in deficits that affect the ability to repair damage.Reference Rockwood20,Reference Mitnitski, Song and Rockwood23 Frailty is thus seen as a dynamic process of deficit accumulation; these deficits arise first at a subcellular level before consequently affecting tissues, organs and function.Reference Howlett and Rockwood24,Reference Kirkwood25 A wide variety of deficits are associated with frailty, so that many different stochastic pathways lead to the multiply determined state of increased vulnerability. The deficit accumulation approach likewise recognizes grades of frailty.
Both approaches recognize that frail individuals are at greater risk of adverse health outcomes such as death, disability and increased healthcare utilization, including both hospitalization and institutionalization.Reference Fried, Tangen, Walston, Newman, Hirsch and Gottdiener8,Reference Rockwood, Stadnyk, MacKnight, McDowell, Hebert and Hogan26,Reference Mitnitski, Song, Skoog, Broe, Cox and Grunfeld27 Being able to identify who is at increased risk of adverse outcomes can be very beneficial; consequently a lot of research has focused on the operational definitions of frailty.Reference Fried, Ferrucci, Darer, Williamson and Anderson2,Reference Hogan, MacKnight and Bergman28–Reference Wells, Seabrook, Stolee, Borrie and Knoefel31 The frailty phenotype and the frailty index are the two that have generated the most consideration,Reference Bouillon, Kivimaki, Hamer, Sabia, Fransson and Singh-Manoux32 and are based on the syndrome versus state models, respectively. Other operational definitions of frailty include the Groningen Frailty Indicator,Reference Baitar, Van Fraeyenhove, Vandebroek, De Droogh, Galdermans and Mebis33 the Tilburg Frailty Indicator,Reference Gobbens, van Assen, Luijkx and Schols34 the Clinical Frailty Scale,Reference Rockwood, Song, MacKnight, Bergman, Hogan and McDowell35 the Edmonton Frailty ScaleReference Rolfson, Majumdar, Tsuyuki, Tahir and Rockwood36 and the FRAIL scale.Reference Abellan van Kan, Rolland, Morley and Vellas37
The most commonly used working definition of frailty was created by Fried et al. Reference Fried, Tangen, Walston, Newman, Hirsch and Gottdiener8 by evaluating the prevalence, correlation and validity of their operational definition in relation to its ability to predict adverse outcomes including worsening mobility, increased disability, increased falls, hospitalization and death. They identified five features that correspond with frailty: unintentional weight loss, low energy, slow gait, reduced grip strength and reduced physical activity. Frailty was defined as being present when any three of the five criteria were met, whereas meeting only one or two of the criteria suggested that the individual was at a higher risk of becoming frail, and was labelled as ‘pre-frail’.Reference Fried, Tangen, Walston, Newman, Hirsch and Gottdiener8 The Fried frailty phenotype, though widely cited, has also been subject to criticism, mainly on grounds of poor generalizability and limited clinical utility.Reference Rockwood38–Reference Whitson, Purser and Cohen41 The phenotype does not include any consideration of cognition, despite a known association with functional decline.Reference Rothman, Leo-Summers and Gill42 An important but somewhat overlooked criticism is that the frailty phenotype may not be applicable to all individuals at increased risk. In the cohort in which the phenotype was determined, Fried et al. Reference Fried, Tangen, Walston, Newman, Hirsch and Gottdiener8 excluded individuals with moderate to severe cognitive impairment, those with a history of Parkinson's disease or stroke as well as those taking anti-depressants; thus there is some uncertainty surrounding the generalizability of the frailty phenotype to those individuals.Reference Clegg and Young43 Although the phenotype can identify those who are at high risk of becoming frail, it discriminates less well between those who are fit and those who are at lower or moderate risk of becoming frailReference Theou, Brothers, Mitnitski and Rockwood44,Reference Malmstrom, Miller and Morley45 and excludes many people who cannot participate in performance testing, but who remain at higher risk.Reference Collerton, Martin-Ruiz, Davies, Hilkens, Isaacs and Kolenda46,Reference Ravindrarajah, Lee, Pye, Gielen, Boonen and Vanderschueren47
In the frailty index, proposed by Rockwood and Mitnitski,Reference Rockwood20,Reference Mitnitski, Graham, Mogilner and Rockwood22,Reference Mitnitski, Mogilner and Rockwood48 health deficits are counted, so that the higher the number of deficits relative to all deficits considered, the more frail the individual.Reference De Lepeleire, Iliffe, Mann and Degryse49,Reference Searle, Mitnitski, Gahbauer, Gill and Rockwood50 Since its introduction in 2001, multiple groups around the world have used frailty indexes, constructed with a variety of different deficitsReference Zampini11,Reference Goggins, Woo, Sham and Ho51–Reference Farhat, Velanovich, Falvo, Horst, Swartz and Patton55 that are counted (and variably include disability items). Notably, the original frailty index meets a number of properties that appear independent of its construction. For example, as long as key criteria are met (see below) the frailty index has a characteristic distribution in community-dwelling samples (skewed, with a long right tail)Reference Rockwood, Song and Mitnitski56 and in clinical samples (closer to a normal distribution).Reference Evans, Sayers, Mitnitski and Rockwood57 Similarly, at any age, the mean values of the frailty index are higher in women than in men, whereas for any given level of the frailty index, mortality is higher in women.Reference Mitnitski, Song, Skoog, Broe, Cox and Grunfeld58 The reproducibility of frailty across different frailty indexes suggests that the number of deficits present, perhaps even more than their nature, is key, at least at the group level. While one study considers 40 variables for a frailty index, a separate study can consider 60 different variables and would yield similar frailty index findings. The frailty index is considered to be both a sensitive measure of frailty as well as a reliable predictor of poor health outcomes.Reference Xue59,Reference de Vries, Staal, van Ravensberg, Hobbelen, Olde Rikkert, Nijhuis-van and Sanden60 The graded frailty index allows for dose–response relationships to be evaluated.Reference Rockwood, Andrew and Mitnitski61,Reference Rockwood and Mitnitski62 The greatest strengths of the frailty index are its ability to be created for nearly any dataset and the mathematical properties. Note that the frailty index has also been used to quantify the health of younger populations as early as 20 years of age.Reference Rockwood, Song and Mitnitski56
Searle et al. Reference Searle, Mitnitski, Gahbauer, Gill and Rockwood50 outlined a standard protocol for creating a frailty index for any dataset. The frailty index is calculated as a ratio of deficits present out of the total number of possible deficits, giving a continuous score from total fitness to total frailty. For example, if 50 deficits are considered in a given frailty index and a patient has 10, the person will have a frailty score of 0.2. Five criteria should be satisfied for a deficit to be included in a frailty index: the deficit should be related with health status, the deficit should become more prevalent with increasing age, the deficit should not saturate too early, the deficits should cover a range of systems and finally if a frailty index is to be compared for the same individual, the deficits used should be the same.
Ideally, a minimum of 30 to 40 variables should be included in the frailty index;Reference Ferrucci, Guralnik, Studenski, Fried, Cutler and Walston5,Reference Mitnitski, Song, Skoog, Broe, Cox and Grunfeld27,Reference Searle, Mitnitski, Gahbauer, Gill and Rockwood50 the more variables included, the more precise the score will be.Reference Searle, Mitnitski, Gahbauer, Gill and Rockwood50 It is not yet known if there is an upper limit or an optimal number of variables to be included. The overall validity and reliability of the frailty index is shown in its ability to predict death, health status, chronic disease outcomes, health decline and healthcare utilization.Reference Rockwood20,Reference Mitnitski, Song, Skoog, Broe, Cox and Grunfeld27,Reference Song, Mitnitski and Rockwood63,Reference Wallace, Theou, Kirkland, Rockwood, Davidson, Shimbo and Rockwood64
Defining physical activity and sedentary behaviour
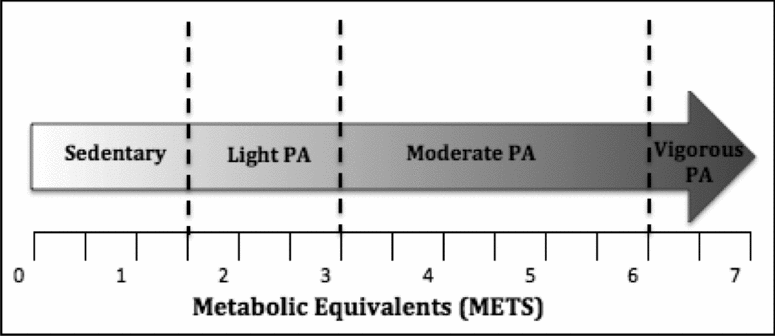
As frailty is often associated with a loss of physical resiliency,Reference Lipsitz29 this is an avenue relevant to prevention that warrants pursuit. Before pursuing this, it is important to define the constructs. Physical activity is defined as ‘any bodily movement produced by skeletal muscles that requires energy expenditure’,6 and can be differentiated by both type and intensity. Exercise, leisure activity and occupational activity are all examples of types of physical activity. Exercise is physical activity that is planned or structured with the objective of increasing or maintaining physical fitness.Reference Caspersen, Powell and Christenson65 Energy expenditure is often measured in METs or metabolic equivalents, as a measure of how hard the body is working. The more strenuous the activity is, the more oxygen the body must use for energy and thus the higher the MET level. A MET level of 1.0 is considered to be the reference level of an individual at rest.Reference Pate, O’Neill and Lobelo66 Vigorous intensity activity refers to physical activity in which the individual exerts 6 METs or more. Vigorous intensity activities include running, swimming, bicycling >10 km/h, and hiking uphill among others.Reference Oga, Nishimura, Tsukino, Sato, Hajiro and Ikeda67,68 Moderate intensity activity refers to physical activities in which the individual exerts between 3 and 6 METs, such as brisk walking, water aerobics, bicycling <10 km/h or gardening.Reference Oga, Nishimura, Tsukino, Sato, Hajiro and Ikeda67,68 Finally, light intensity activity refers to physical activities in which the individual exerts between 1.5 and 3 METs; examples of this are light walking, stretching, fishing or leisurely sports such as table tennis or playing catch.Reference Oga, Nishimura, Tsukino, Sato, Hajiro and Ikeda67,68 Please refer to Figure 1.
The energy expenditure continuum

The definition of sedentary behaviour has been contradictory in the literature and as a result, measurement of sedentary behaviour has been inconsistent. Operationally, sedentary behaviour has been defined as any waking activity characterized by an energy expenditure of less than 1.5 METs in a sitting or reclining position.68–Reference Biddle, Gorely, Marshall, Murdey and Cameron72 Common sedentary behaviours include watching TV, driving, screen time (video games, computers), and reading; essentially, anything done awake while sitting or lying down.68 In the past, a number of studies have misconstrued sedentary behaviour – mostly defining it as a mere lack of moderate to vigorous activity.Reference Pate, O’Neill and Lobelo73,Reference Owen, Healy, Matthews and Dunstan74 For example, past research has defined sedentary behaviour as levels of activity that fail to achieve the levels of moderate or vigorous physical activity,Reference Lowry, Wechsler, Galuska, Fulton and Kann75 or those spending less than 2000 kcal/week through walking, climbing stairs and playing sports.Reference Paffenbarger, Hyde, Wing and Hsieh76
Associations between physical activity and frailty
Physical inactivity was identified by the World Health Organization as the fourth leading risk factor for global mortality, after high blood pressure, tobacco use and high blood glucose.6 There has also been a great deal of evidence surrounding its protective health benefits in the maintenance of physical resiliency.Reference Booth and Chakravarthy4,Reference Blair, Cheng and Holder77–79 Whereas lack of physical activity is known to be one of the major sources that lead to disability,Reference Fried, Ferrucci, Darer, Williamson and Anderson2,Reference Ferrucci, Guralnik, Studenski, Fried, Cutler and Walston5,Reference Singh80,Reference Simonsick, Lafferty, Phillips, Mendes de Leon, Kasl and Seeman81 there is also evidence of an inverse association between physical activity and frailty. Cruz-Jentoft et al. Reference Cruz-Jentoft, Baeyens, Bauer, Boirie, Cederholm and Landi82 demonstrated that physical activity could help slow down the age-related decline of muscle strength and muscle mass associated with frailty. Physical activity was also found to be inversely associated with other components of frailty including physical disability,Reference Leveille, Guralnik, Ferrucci and Langlois83–Reference Landi, Russo, Cesari, Pahor, Liperoti and Danese88 cognitive impairment,Reference Weuve, Kang, Manson, Breteler, Ware and Grodstein89,Reference Podewils, Guallar, Kuller, Fried, Lopez and Carlson90 and depression.Reference Bartholomew, Morrison and Ciccolo91,Reference King, Pruitt, Phillips, Oka, Rodenburg and Haskell92 Peterson et al. Reference Peterson, Giuliani, Morey, Pieper, Evenson and Mercer93 examined the longitudinal relationship between physical activity and frailty, suggesting that physical activity had an independent, preventative effect against frailty as a whole; this effect held true for both sexes and all ages. Despite this evidence on the positive impact of physical activity interventions on frailty, causality has yet to reliably established.Reference Gill, Baker, Gottschalk, Peduzzi, Allore and Byers94–Reference Binder, Schechtman, Ehsani, Steger-May, Brown and Sinacore96
The recommendation that physical activity is beneficial for one's health is not novel; it has been repeatedly suggested for decades.Reference Cress, Buchner, Questad, Esselman, deLateur and Schwartz87,Reference LaCroix, Guralnik, Berkman, Wallace and Satterfield97–Reference Carnethon, Whitsel, Franklin, Kris-Etherton, Milani and Pratt101 The Canadian Physical Activity Guidelines (CPAG) report that health benefits can be achieved by adults, aged 18 and older if they accumulate at least 2.5 hours of moderate to vigorous physical activity each week, in bouts of 10 minutes or more.Reference Tremblay, Kho, Tricco and Duggan102 A study by Hubbard et al. Reference Hubbard, Fallah, Searle, Mitnitski and Rockwood103 found that at 5-year follow-up, older adults who exercised were more likely to improve their health status than those who did not. Hubbard et al. Reference Hubbard, Fallah, Searle, Mitnitski and Rockwood103 also found that the more frail one was at baseline, the more likely they were to yield greater benefits. This relationship remained across all levels of frailty, suggesting the potential impact of exercise at the population level. Although it has been reported that greater health benefits can be obtained if the physical activity is of longer duration or more vigorous intensity,Reference King, Pruitt, Phillips, Oka, Rodenburg and Haskell86,Reference Landi, Russo, Cesari, Pahor, Liperoti and Danese88,Reference LaCroix, Guralnik, Berkman, Wallace and Satterfield97 other studies have demonstrated that benefits can still be elicited with low to moderate activities.Reference Landi, Russo, Cesari, Pahor, Liperoti and Danese88 The benefits of engaging in moderate-vigorous physical activity during daily life are well established, whereas the evidence on the importance of light activities and the harm of sedentary behaviours is limited.
Associations between sedentary behaviour and health
Research studies have examined the effect of sedentary behaviour on a wide range of health domains such as body mass composition, cardiovascular disease, cancer and psychological disorders. Sedentary behaviour is recognized as a risk factor for poor health, morbidity and mortality.Reference Bauman, Ainsworth, Sallis, Hagstromer, Craig and Bull15,Reference Thorp, Owen, Neuhaus and Dunstan17,Reference Healy, Wijndaele, Dunstan, Shaw, Salmon and Zimmet18,Reference Katzmarzyk and Mason104 The odds of weight gain was higher in people whose daily sitting time was 8 hours or more per day compared with those who sat for less than 3 hours.Reference Healy, Wijndaele, Dunstan, Shaw, Salmon and Zimmet105 Similarly, a cross-sectional study demonstrated that the odds of being obese increased as weekly hours of TV viewing time increased.Reference Brownson, Boehmer and Luke106 TV viewing time and objectively measured sedentary behaviour with physical activity monitors were both found to be associated with abnormal glucose tolerance,Reference Healy, Wijndaele, Dunstan, Shaw, Salmon and Zimmet18,Reference Dunstan, Salmon, Owen, Armstrong, Zimmet and Welborn107 increased cardio-metabolic risk,Reference Jakes, Day, Khaw, Luben, Oakes and Welch108,Reference Healy, Matthews, Dunstan, Winkler and Owen109 metabolic syndromeReference Dunstan, Salmon, Owen, Armstrong, Zimmet and Welborn107 and an increased risk of type 2 diabetes.Reference Hu, Leitzmann, Stampfer, Colditz, Willett and Rimm110,Reference Hu, Li, Colditz, Willett and Manson111 Increased risk of endometrial cancer in women and colon cancer in men were associated with high levels of TV watching,Reference Howard, Freedman, Park, Hollenbeck, Schatzkin and Leitzmann112,Reference Gierach, Chang, Brinton, Lacey, Hollenbeck and Schatzkin113 increased daily sitting timeReference Gierach, Chang, Brinton, Lacey, Hollenbeck and Schatzkin113 and self-reported levels of sedentary behavior.Reference Friberg, Mantzoros and Wolk114 Finally, a linear relationship was found between a sedentary index and the risk of developing a mental disorder.Reference Sanchez-Villegas, Ara, Guillen-Grima, Bes-Rastrollo, Varo-Cenarruzabeitia and Martinez-Gonzalez115
The relationship between sedentary behaviour and poor health outcomes persists even after controlling for moderate-vigorous activity. Camhi et al. Reference Camhi, Sisson, Johnson, Katzmarzyk and Tudor-Locke116 suggested that higher levels of sedentary behaviour were associated with increased cardio-metabolic risk factors. Similarly, Healy et al. Reference Healy, Dunstan, Salmon, Shaw, Zimmet and Owen19,Reference Healy, Dunstan, Salmon, Cerin, Shaw and Zimmet117 found an association between high levels of sedentary behaviour and increased waist circumference, metabolic risks and risk for type II diabetes. Sedentary behaviour and all-cause mortality, independent of moderate-vigorous activity, have been found to be significantly associated in a population of men and women aged 45 to 75 years.Reference Kim, Wilkens, Park, Goodman, Monroe and Kolonel118 One study proposed the ‘Active Couch Potato’ phenomenon in which there was a strong, significant dose–response association between TV watching time and waist circumference, systolic blood pressure and diabetes risk in a sample of men and women who reported at least 150 min a week of moderate-to-vigorous intensity physical activity – meeting the suggested guidelines.Reference Healy, Dunstan, Salmon, Shaw, Zimmet and Owen19
Despite an abundance of research evaluating the effect of sedentary behaviour on an array of health outcomes, there is considerably less research on the effect of sedentary behaviour on ageing and especially on frailty. Sedentary behaviours are particularly common in older adults, with evidence that older adults are the most sedentary age group.Reference Matthews, Chen, Freedson, Buchowski, Beech and Pate119,Reference Gennuso, Gangnon, Matthews, Thraen-Borowski and Colbert120 In the 2003–2004 iteration of NHANES, the number of waking hours spent daily in sedentary behaviour increased in each 10-year age group from 7.24 hours at age 30–39, eventually reaching 9.28 hours at age 70–85.Reference Matthews, Chen, Freedson, Buchowski, Beech and Pate119 Dogra and StathokostasReference Dogra and Stathokostas121 suggested that amongst 45- to 64-year-old adults, those who were least sedentary were 43% more likely to age successfully than those who were most sedentary. This association was found to have a dose–response relationship in older adults, aged 65 and above; those who were moderately sedentary were 38% more likely to age successfully and those who were least sedentary were 43% more likely. A short-term association between decreasing sedentary activity and decreasing frailty has been proposed,Reference Theou, Jones, Vandervoort and Jakobi122 with moderate evidence suggesting that exercise interventions and reduced sedentary behaviour can be used to either improve or maintain physical function and independence in frail, older adults.Reference Gill, Baker, Gottschalk, Peduzzi, Allore and Byers94–Reference Binder, Schechtman, Ehsani, Steger-May, Brown and Sinacore96,Reference Paterson, Jones and Rice123,Reference Gill, Gahbauer, Allore and Han124 The American College of Sports Medicine (ACSM) suggest that increasing physical activity may be more beneficial for frail people than any other intervention;Reference Gill, Baker, Gottschalk, Peduzzi, Allore and Byers94,Reference Binder, Schechtman, Ehsani, Steger-May, Brown and Sinacore96,Reference Chin, Paw, de Jong, Schouten, van Staveren and Kok125,126 however, no recommendation currently exists about decreasing sedentary behaviour.
There is little information about the temporal relationship between sedentary behaviour and frailty. The Health, Aging and Body Composition study followed the physical activity of an older cohort for 5 years.Reference Peterson, Giuliani, Morey, Pieper, Evenson and Mercer93 Exercise activities were independently associated with delaying the onset and progression of frailty. Even so, there was no association between differing amounts or intensities of physical activity and the odds of transitioning to frailty,Reference Peterson, Giuliani, Morey, Pieper, Evenson and Mercer93 suggesting that any level of activity and thus reduction of sedentary behaviour could decrease the odds of becoming frail. This finding is particularly important for older and frailer individuals, who might not necessarily be able to participate in vigorous physical activities. Of note, however, the study relied on self-reports of physical activity, which has been criticized.Reference Prince, Adamo, Hamel, Hardt, Connor Gorber and Tremblay127–Reference Sallis and Saelens129 Furthermore, the use of a phenotypic definition of frailty does not allow the degree of frailty to be graded, and thus there was no observation of a dose–response relationship.
Patterns of physical activity
The positive relationship between physical activity and health has resulted in increases in physical activity-related consumerism.130–132 In 2012, the global health and fitness club industry alone generated nearly 76 billion US dollars.132 Global health and wellness sales are expected to reach a record high of US $1 trillion by 2017.Reference Basu, McKee, Galea and Stuckler131 The number of fitness and health clubs in the United States increased from 26,830 in 2005 to 30,500 in 2012. These numbers are expected to rise further as shown by the increase in the number of fitness memberships from 41.3 million in 2005 to 50.2 million in 2012.132
Even so, the relationship between fitness club membership and population physical activity is not clear: the latter appears to have decreased.Reference Stamatakis, Ekelund and Wareham133 The reduction in overall physical activity has been associated with an increased number of health problems and the obesity epidemic.Reference Katzmarzyk and Mason104 For many reasons, the decrease in many types of physical activity has been associated with an increase in sedentary behaviours.Reference Katzmarzyk and Mason104,Reference Sobolski, Kolesar, Kornitzer, Backer, Mikes and Dramaix134,Reference Lanningham-Foster, Nysse and Levine135 This combination is thought to be due to the transition from work-related physical labour to more sedentary, desk-bound jobs,Reference Sobolski, Kolesar, Kornitzer, Backer, Mikes and Dramaix134 the conversion from physical domestic chores to labour-saving technology in the home,Reference Lanningham-Foster, Nysse and Levine135 the availability of motorized travel as opposed to previous non-motorized travelReference Sobolski, Kolesar, Kornitzer, Backer, Mikes and Dramaix134 and finally the shift from physical leisure activities to passive entertainment such as TV, computers or other electronic devices.Reference Katzmarzyk and Mason104 The rate of physical activity in Americans has decreased by approximately 8.5% from 1955 to 2005.Reference Healy, Wijndaele, Dunstan, Shaw, Salmon and Zimmet105 A UK National Travel Survey reported that the average person now walks 304 km each year; this is 106 km less than the average 25 years ago.136 This decrease in walking probably parallels an increase in sedentary behaviour. James et al.Reference James137 reported that urbanization in China has reduced daily energy expenditure by up to 600 calories over the past 40 years.
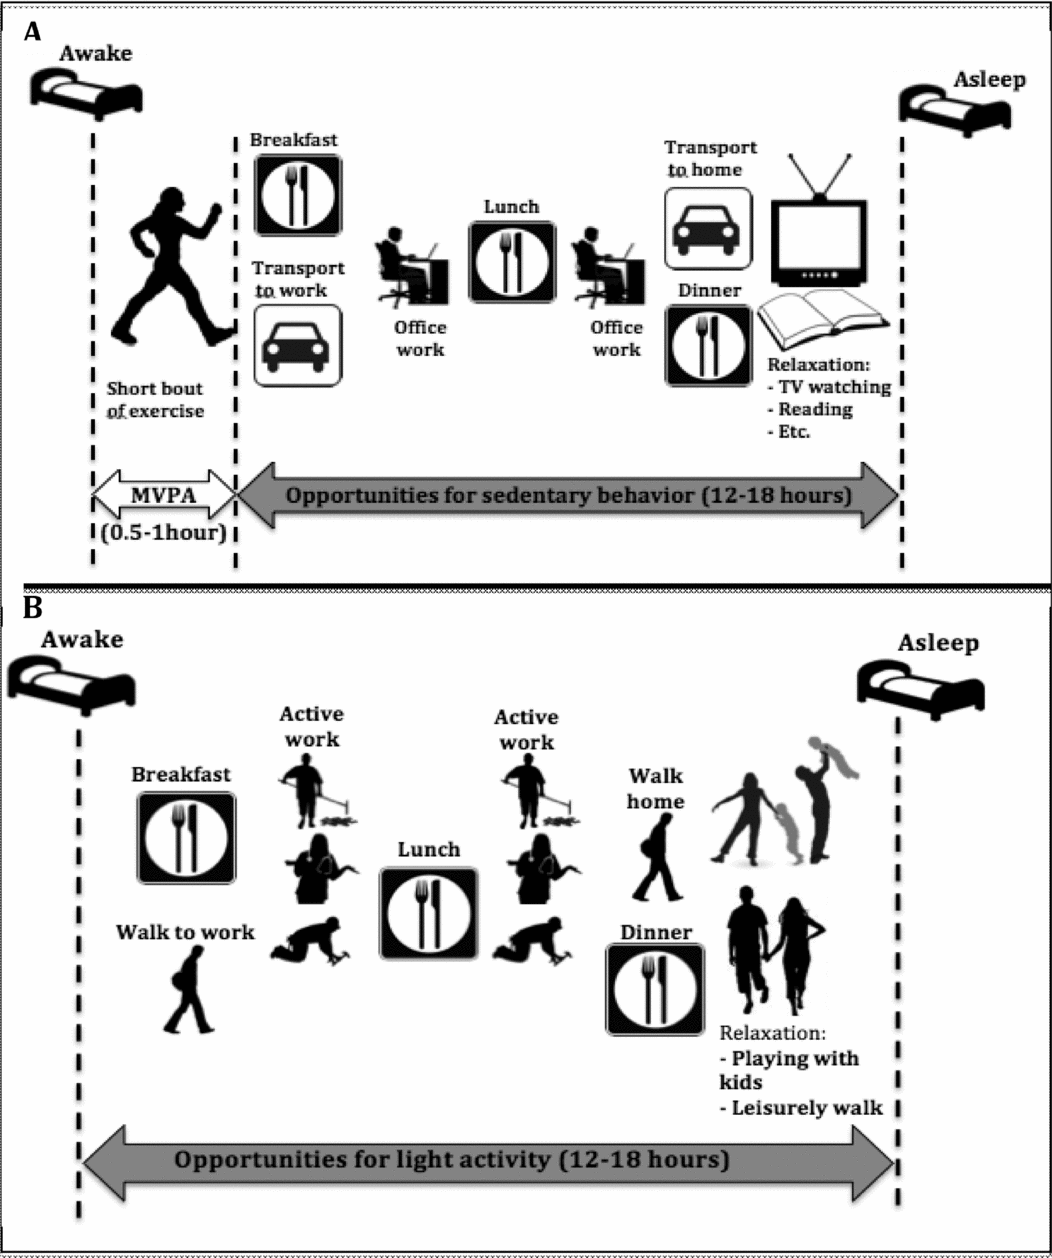
Whereas some individuals participate in very little physical activity overall, others demonstrate both high levels of moderate-vigorous physical activity and high levels of sedentary behavior.Reference Tremblay, Colley, Saunders, Healy and Owen138 Many individuals engage in 30–60 minutes of vigorous physical activity once a day while remaining largely sedentary otherwise.Reference Healy, Wijndaele, Dunstan, Shaw, Salmon and Zimmet18,Reference Hamilton, Healy, Dunstan, Zderic and Owen139 Figure 2A demonstrates a typical daily pattern of sedentary behaviour in which the individual engages in purposeful exercise upon waking before participating in more than 15 hours of sedentary behaviour. This includes sitting for meals, transportation to and from work, sitting at a desk at work and watching TV or some other form of evening relaxation.Reference Tremblay, Colley, Saunders, Healy and Owen69Figure 2B demonstrates a typical daily pattern of an active individual, one who does not participate in moderate-vigorous activity, yet remains active throughout the course of the day by walking to and from work, working an active job such as groundskeeper, nurse or carpenter and through active relaxation-playing with children or going for a light walk.
A, daily pattern of sedentary behaviour opportunities and their distribution over the day; B, daily pattern of light behaviour opportunities and their distribution over the day.
Measuring physical activity and sedentary behaviour
Studies have differed in their measurement of physical activity and sedentary behavior – both objective and subjective measures have been used and there are differences within these two categories as well. Studies that used subjective questionnaires to examine the benefits of physical activity asked individuals to report on their engagement in various activities – mainly higher intensity activities. These questionnaires did not include questions about light activities such as cooking or washing dishes or questions about sedentary behaviours such as watching TV and reading.Reference Pate, O’Neill and Lobelo66 This approach to the measurement of sedentary behaviour and physical activity could lead to misclassification bias. For example, one person could engage in sedentary behaviours for 20% of the day and in light activities for the other 80% (similar to the pattern described in Fig. 2B); whereas another person could engage in sedentary behaviour for 75% of the day, in light activities for 20% of the day and finally in moderate-vigorous physical activity for the remaining 5% (similar to the pattern described in Fig. 2A). A questionnaire that only includes moderate-vigorous activities could wrongly classify the first individual as sedentary and the second as active. Further, if the total METs of these people were calculated, the first person would be likely to have the higher daily energy expenditure.Reference Pate, O’Neill and Lobelo66
To avoid misclassification in the exposure, sedentary behaviour needs to be defined and measured.Reference Healy, Wijndaele, Dunstan, Shaw, Salmon and Zimmet18,Reference Owen, Sugiyama, Eakin, Gardiner, Tremblay and Sallis70,Reference Pate, O’Neill and Lobelo73,Reference Hamilton, Healy, Dunstan, Zderic and Owen139 As detailed above, an individual who is sedentary is not to be confused with an individual who does not meet the physical activity guidelines or more specifically, who performs insufficient amounts of moderate to vigorous activity.68 Self-report of sedentary behaviour has been widely used to measure sedentary behaviour, due to its feasibility and low cost. Some studies simply ask subjects to report the duration of a sedentary behaviour such as watching TV,Reference Healy, Dunstan, Salmon, Shaw, Zimmet and Owen19,Reference Lowry, Wechsler, Galuska, Fulton and Kann75,Reference Jakes, Day, Khaw, Luben, Oakes and Welch108,Reference Dunstan, Salmon, Healy, Shaw, Jolley and Zimmet140 whereas other studies have used questionnaires developed to estimate levels of sedentary behaviours such as the 7-day Sedentary and Light Intensity Physical Activity LogReference Barwais, Cuddihy, Washington, Tomson and Brymer141 or the Sedentary Behaviour Questionnaire.Reference Rosenberg, Norman, Wagner, Patrick, Calfas and Sallis142 Levels of one specific type of sedentary behaviour such as TV watching, talking on the phone, lying on the couch or driving to work are often generalized to represent sedentary behaviour as a whole.Reference Healy, Wijndaele, Dunstan, Shaw, Salmon and Zimmet18,Reference Healy, Dunstan, Salmon, Shaw, Zimmet and Owen19,Reference Healy, Wijndaele, Dunstan, Shaw, Salmon and Zimmet105–Reference Jakes, Day, Khaw, Luben, Oakes and Welch108,Reference Hu, Leitzmann, Stampfer, Colditz, Willett and Rimm110,Reference Hu, Li, Colditz, Willett and Manson111,Reference Gierach, Chang, Brinton, Lacey, Hollenbeck and Schatzkin113,Reference Dunstan, Salmon, Healy, Shaw, Jolley and Zimmet140,Reference Henson, Yates, Biddle, Edwardson, Khunti and Wilmot143–Reference Friberg, Mantzoros and Wolk146 Although sedentary behaviour does encompass these activities, one behavioural measure alone does not comprehensively assess sedentary behaviour throughout the day. Technology-related sedentary behaviours such as TV watching or computer use are the most commonly used measures of sedentary behaviour. Although TV viewing is the most prevalent sedentary behaviour, with the average American watching 2.8 hours per day, this constitutes less than 50%147 of the time spent in a sedentary state. In consequence, more than 50% of sedentary behaviour would not be accurately captured if TV watching were used as a proxy measure for sedentary behaviour.Reference Biddle148 Measures like reading, lying on the couch, driving to work, etc. contribute to total sedentary behaviour even less than TV watching and thus may be even less reliable than TV watching as a proxy for sedentary behaviour.
Using questionnaires to measure physical activity and sedentary behaviours has proven limitations. Klesges et al. Reference Klesges, Eck, Mellon, Fulliton, Somes and Hanson149 discovered that subjects specifically tended to underestimate their level of sedentary behaviour and overestimate their aerobic activities by nearly 300%. In addition, there is not always coherence between self-reported and objectively measured sedentary behaviour using physical activity monitors such as accelerometers. Self-reports of physical activity in the NHANES dataset indicated that 60–63% of US adults between the age of 60 and 69 met the minimum US recommendations of physical activity.Reference Schuna, Johnson and Tudor-Locke150,Reference Evenson, Buchner and Morland151 However, objectively measured physical activity, using accelerometers, in the same dataset, indicated that only 9–26% of the designated population met the recommendations.Reference Evenson, Buchner and Morland151,Reference Tucker, Welk and Beyler152 In short, self-report data may overestimate levels of physical activity; many factors could play a role in this. Self-report bias is thought to contribute,Reference Adams, Matthews, Ebbeling, Moore, Cunningham and Fulton153,Reference Klesges, Baranowski, Beech, Cullen, Murray and Rochon154 as subjects may intentionally provide false reports. There has also been evidence that sexReference Booth, Owen, Bauman and Gore155 and weight can impact self-reporting of physical activity.Reference Buchowski, Townsend, Chen, Acra and Sun156 Difficulty recalling activities, cultural differences in interpretation and human error can influence self-reporting as well.Reference Sallis and Saelens129
Accelerometers have emerged as useful instruments to measure levels of physical activity and sedentary behaviours. They provide an objective, reliable and accurate measure that overcomes many of the limitations of self-reported data.Reference Rowlands157–Reference Trost161 Accelerometers measure the acceleration of an individual in specified planesReference Evenson, Buchner and Morland151 and can be used to describe how often and how long someone is sedentary in addition to the intensity, duration, frequency and patterns of movement.Reference Tremblay, Kho, Tricco and Duggan102,Reference Mathie, Coster, Lovell and Celler162 Accelerometers have been used to measure physical activity and sedentary behaviours in both youngReference Bouten, Verboeket-van, Venne, Westerterp, Verduin and Janssen163 and older adultsReference Meijer, Goris, Wouters and Westerterp164,Reference Kochersberger, McConnell, Kuchibhatla and Pieper165 and have consistently demonstrated a high degree of reliability in their measurement of physical activity, with very little variation over time.Reference Bouten, Verboeket-van, Venne, Westerterp, Verduin and Janssen163,Reference Hansson, Asterland, Holmer and Skerfving166 Gardner and PoehlmanReference Gardner and Poehlman167 compared physical activity assessed by an accelerometer with doubly labelled water, the reference standard measurement of physical activity; the two measurements were highly correlated with an R of 0.83 and a P-value of less than 0.001. Doubly labelled water involves the ingestion of water labelled with isotopes of hydrogen and oxygen; as the body consumes energy, carbon dioxide and water are produced. Measuring these levels allows the exact total energy expenditure to be calculated.168
Compared with other measures of physical activity such as self-reportReference Steele, Holt, Belza, Ferris, Lakshminaryan and Buchner169,Reference Ng and Kent-Braun170 and heart rate measurements,Reference Fehling, Smith, Warner and Dalsky171,Reference Bussmann, Hartgerink, van der Woude and Stam172 accelerometers have been found to be more sensitive to the actual level of physical activity of the individual. The ongoing development of accelerometers has resulted in increased battery life and decreased cost leading to increased feasibility for use in epidemiological studies.Reference Healy, Dunstan, Salmon, Cerin, Shaw and Zimmet117,Reference Matthews, Chen, Freedson, Buchowski, Beech and Pate119 Accelerometers can be worn around the wrist,Reference Rosenberger, Haskell, Albinali, Mota, Nawyn and Intille173 thighReference Cleland, Kikhia, Nugent, Boytsov, Hallberg and Synnes174 or preferably the waist.Reference Tremblay, Kho, Tricco and Duggan102,Reference Rosenberger, Haskell, Albinali, Mota, Nawyn and Intille173 A 7-day accelerometer wear period is recommended in order to obtain reliable estimates of average behavior,Reference Matthews, Ainsworth, Thompson and Bassett175 although others have suggested that a 5-day wear period is sufficient in older adults to obtain an accurate measure of average daily sedentary time.Reference Hart, Swartz, Cashin and Strath176 While accelerometers can capture so many different aspects of physical activity, they remain limited by their inability to capture the full energy expenditure of activities such as walking, lifting weights or walking on an incline, as acceleration does not change under these conditions.
Conclusions and future perspectives
Research on sedentary behaviour and adverse health outcomes is growing, and understanding how these relate to frailty is an emerging area of investigation. The association between frailty and sedentary behaviour needs to be confirmed, and the direction(s) of any temporal relationship should be evaluated. To demonstrate the association between sedentary behaviour and frailty requires first that reliable measures of the two constructs must be used. Measurement of sedentary behaviour is diverse and has not always been reliable, ranging from self-reports of TV watching and physical activities to accelerometer data. Studies that have examined the effect of physical activity or sedentary behaviour on frailty state have yet to use a consistent and reliable measure of frailty; many studies have used non-validated frailty definitions,Reference Binder, Schechtman, Ehsani, Steger-May, Brown and Sinacore96,Reference Chin, Paw, de Jong, Schouten, van Staveren and Kok125,Reference de Jong, Chin, Paw, de Groot, Hiddink and van Staveren177–Reference Villareal, Steger-May and Schechtman179 while others have employed operational definitions of uncertain measurement properties.Reference Boshuizen, Stemmerik, Westhoff and Hopman-Rock180–Reference Seynnes, Singh, Hue, Pras, Legros and Bernard184
Additional research to confirm the effect of sedentary behaviour on frailty, independent of moderate-vigorous physical activity, has the potential for important public health implications. Healthcare professionals, national recommendations and society in general should not just be emphasizing the benefits of exercise (moderate-vigorous physical activity); rather the benefits of light activity should be considered as well. This is of particular importance in the technological age as more and more individuals spend increasing portions of their day and life in a sedentary state. Although the increase in sedentary desk jobs appears to be inevitable, modifications in workplaces and office spaces have the potential to help counter the problem of sedentary behaviour. Despite the dangers of bed rest being long recognized,Reference Asher185 elderly patients are often inadequately mobilized in hospital and long-term care settings. Furthermore, societies should consider various ways in which the environment can support and promote physical activity. Decreasing sedentary behaviour and increasing moderate-vigorous physical activity has the potential to be an easy, cost-effective, feasible lifestyle change that would encourage healthy ageing, decrease frailty, decrease chronic disease and decrease healthcare utilization.
Financial support
KR is supported by an operating grant from the Canadian Institutes of Health Research and receives funding from the Dalhousie Medical Research Foundation as Kathryn Allen Weldon Professor of Alzheimer Research. OT is supported by a Banting Postdoctoral Fellowship.
Conflict of interest
KR is investigating possible avenues to commercialize a version of the Frailty Index based on a Comprehensive Geriatric Assessment.