
I. INTRODUCTION
High nitrogen stainless steels (HNSSs) have stimulated great interest due to their attractive properties,Reference Mudali and Raj1 such as good corrosion resistance,Reference Pujar, Mudali and Singh2,Reference Shi, Tian, Jia, Ye, Qi, Liu and Li3 nonmagnetic susceptibility,Reference Wang, Yang, Shan and Li4 high strength, and excellent ductility.Reference Gu, Michal, Ernst, Kahn and Heuer5,Reference Ha, Lee, Oh and Kim6 Such favorable properties enable the steel to meet requirements for application in extensive fields. Establishment of relations between mechanical properties and microstructures is a key issue in HNSSs. In most cases, the relation between strength and grain size can be described by the original Hall–Petch (H–P) equation:
 $$\sigma = {\sigma _0} + {k_{\rm{d}}}{d^{ - 1{\rm{/}}2}}\quad ,$$
where σ0 is the lattice friction stress required to move individual dislocations, k d is a material-dependent constant known as the H–P slope, and d is the average grain size. This equation shows the importance of grain boundaries (GBs) concerning deformation behavior and is of major importance for the strengthening of materials by grain refinement. Many scientific studies that trying to understand the ongoing mechanisms and create novel materials with advanced mechanical properties by altering grain size were conducted based on this equation.Reference Shaw, Ortiz and Villegas7–Reference Sato, Urata, Kokawa and Ikeda9
Equation (1) is generally used to determine the relation between strength/hardness and grain size of completely recrystallized samples. Two extensive compilationsReference Armstrong, Codd, Douthwaite and Petch10,Reference Masumura, Hazzledine and Pande11 indicate that this relation is fairly well obeyed for large grain size (D ≥ 1 μm) with the grain size exponent close to −1/2 for a wide range of grain size and materials. It should be noted that Eq. (1) may not hold under many conditions. For example, this relation fails and softening occurs at some grain sizes in the nanometer regime for some alloys.Reference Hu, Shi, Sauvage, Sha and Lu12 Nam et al.Reference Nam, Bae and Lee13 proposed a compound H–P relation to estimate the yield stress of drawn pearlitic steel, due to the effect of two phases on strength. A modified H–P relation has been widely used in the steel wire industry in estimating strength of cold drawn eutectoid steels, due to its accuracy and convenience of measuring the initial interlamellar spacing and drawing strain.Reference Kemp14 The steels and alloys processed by large strain deformation are rather difficult to be treated by a simple H–P relation due to its various substructures, such as low-angle boundaries or dislocation walls.Reference Yanushkevich, Dobatkin, Belyakov and Kaibyshev15–Reference Du, Fu, Li, Jing, Wang, Ren and Yang17 A modified H–P equation has been proposed by Hansen,Reference Hansen18 taking into account the effect of low-angle boundaries, as
 $$\sigma = {\sigma _0} + M\alpha G{\left( {1.5b{S_{\rm{V}}}\theta } \right)^{ - 1{\rm{/}}2}} + k{d_{\rm{L}}}^{ - 1{\rm{/}}2}\quad ,$$
where M is the Taylor factor, α is a constant number, G is the shear modulus, b is the Burgers vectors, S V is the area of low-angle boundaries per unit volume, and θ is the average misorientation of low-angle boundaries. This modified equation initially confirmed that low-angle boundaries indeed affect mechanical properties and should be introduced to the H–P relation.
Similar to the low-angle boundaries, twin boundaries (TBs) show similar strengthening behavior.Reference Salem, Kalidindi and Doherty19,Reference Rohatgi, Vecchio and Gray20 The introduction of nanoscale growth twins in electrodeposited Cu allows a high tensile strength while retaining a high tensile ductility.Reference Lu, Shen, Chen, Qian and Lu8,Reference Shen, Lu, Lu, Jin and Lu21 Zhang et al.Reference Zhang, Misra, Wang, Nastasi, Embury, Mitchell, Hoagland and Hirth22 reported similar strengthening effect existed in austenitic stainless steels. Pande et al.Reference Pande, Rath and Imam23 have provided a quantitative relation between twin density, grain size, and yield stress in FCC materials. However, it is difficult to avoid precipitation in HNSS during the mechanical process.Reference Shi, Tian, Jia, Ye, Qi, Liu and Li3 Carbide and nitride precipitations have a significant influence on the performance of HNSS.Reference Hong, Shi, Sheng, Cao, Hui and Dong24 Among all these precipitates, M23C6 carbides play a very important role in affecting the mechanical properties of materials. The formation mechanism and influence of M23C6 precipitates on GBs have been extensively studied. However, the influence of M23C6 carbides at TB on the H–P relation was seldom mentioned in the previous studies. Therefore, it is important to establish a more accurate relation between microstructure and microhardness.
The present study was carried out with an aim to study the effects of twins and precipitates at TB on the traditional H–P relation and to establish a more accurate H–P relation in HNSSs. The steel was annealed and isothermally treated in a wide temperature range to obtain various microstructures and microhardness.
II. EXPERIMENTAL PROCEDURE
A high nitrogen stainless steel, Fe–0.03C–0.75Si–18.2Mn–0.05P–0.20S–17.53Cr–0.46N (all in mass%), was produced by 500 kg multifunction vacuum induction furnace and was converted into a 300 mm-diameter ingot by a multifunctional protective atmosphere electroslag furnace. A section of the billet was forged at approximately 1050 °C to produce a billet with a square cross section of 70 × 70 mm2. Solution treatment was taken under the temperature of 1150 °C for 2 h followed by water quenching. Then the billet was hot-rolled into wire rods, after which the cold-drawing process was applied to obtain HNSS wire with 1.2 mm in diameter. The wire samples were annealed in a muffle furnace to a desired temperature (1050 °C) for 2 min (Type-A) and 60 min (Type-B). Then Type-A and Type-B samples were isothermally treated for 1 h at 100–900 °C, followed by air quenching, to obtain various microstructures.
Electron back-scattered diffraction (EBSD) and transmission electron microscopy (TEM) were used for microstructure investigation. The grain size, morphology, and the frequency of coincidence site lattice (CSL) boundaries were examined by high-resolution EBSD using HKL Technology CHANNEL™ (Oxford Instruments HKL, Hobro, Denmark) acquisition software.Reference Humphreys25 The mean grain size was evaluated on EBSD maps as average distance between ordinary GB with misorientation of θ ≥ 15° by the linear intercept method crosswire to the rolling axis. Prior to EBSD analysis, a standard metallographic preparation process was used to prepare the samples, followed by electropolishing in a mixed solution of 10% perchloric acid and 90% alcohol. The analytic area of the EBSD samples is 500 × 400 μm2 and the step size is 0.4 μm. An EBSD analysis was performed with a step size of 0.1 μm for a clearer observation of the precipitates at TBs. Thin foils for TEM were prepared by mechanical grinding down to 40 μm, and finished by ion beam thinner. The foils were finally observed using a Tecnai F30 (FEI, Portland, Oregon) transmission electron microscope operated at 300 kV. The microhardness of the polished surfaces was measured using a Tukon 2500 Minuteman (Wilson, Norwood, Massachusetts) digital sclerometer with a load of 50 g for 15 s. At least 15 measurements at different points for each sample were taken to obtain an average microhardness value.
III. RESULTS AND DISCUSSION
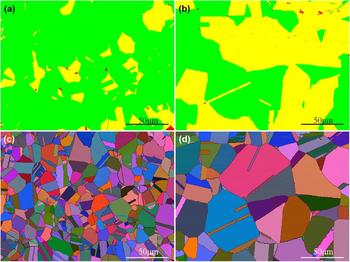
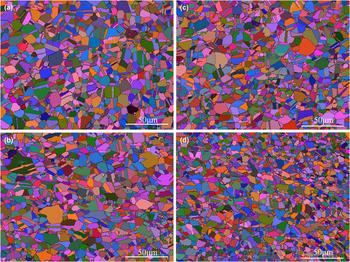
Typical annealing microstructures that evolved in HNSS during annealing treatment at a temperature of 1050 °C are shown in Fig. 1. Figures 1(a) and 1(b) shows the recrystallization distribution of Type-A and Type-B samples after annealing, respectively. The disappearance of the deformed grains in both the samples indicates the full recrystallization. The completion of the recrystallization means that the 2-min annealing time is sufficient. With the further increase of the annealing time, the grains in Fig. 1(d) are significantly larger than those in Fig. 1(c). Figure 1 also shows the equiaxed, random orientation, and heavily twinned microstructure. The microstructure evolutions of Type-A and Type-B samples after isothermal treatment for 1 h at 100–900 °C are shown in Fig. 2. Apparently, compared with Fig. 1, finer grains of the two samples are obtained during isothermal treatment.
EBSD maps about recrystallization distribution of HNSS wire after annealing treatment at 1050 °C for (a) 2 min and (b) 60 min. The grains are color coded as follows: recrystallization grains = green; substructured grains = yellow; deformed grains = red. EBSD maps with all Euler angles of HNSS wire after annealing treatment at 1050 °C for (c) 2 min and (d) 60 min.

EBSD maps with all Euler angles of HNSS wire after isothermal treatment for 1 h under different temperatures: (a) Type-A, 200 °C; (b) Type-A, 900 °C; (c) Type-B, 200 °C; (d) Type-B, 900 °C.

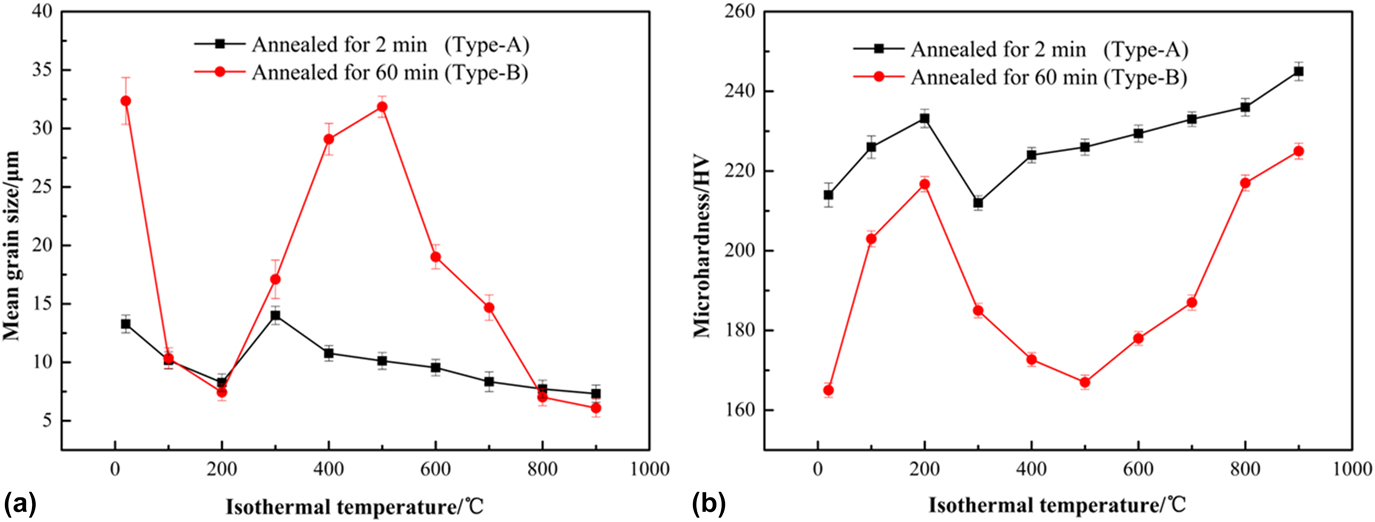
The effect of isothermal temperatures on mean grain size and microhardness of Type-A and Type-B samples is depicted in Figs. 3(a) and 3(b), respectively. With the isothermal temperature increase, the grain size of Type-A and Type-B samples first decreases and reaches a minimum at 200 °C, and then the grains begin to coarse. However, the grain coarsening is inhibited when isothermal temperature reaches a certain value (Type-A = 300 °C and Type-B = 500 °C). Grain refining is commonly known to increase the strength and hardness of polycrystalline materials.Reference Schino and Kenny26 The microhardness of Type-A samples is significantly higher than those of Type-B. With the increase of isothermal temperatures, the microhardness increases to an intermediate maximum at 200 °C. The microhardness of Type-A and Type-B samples reaches to the valley at the temperature of 300 °C and 500 °C, respectively. Further increase of isothermal temperature, the microhardness of Type-A and Type-B samples begins to increase again gradually. This might be related to the changes in grain size and the number of precipitates during the isothermal treatment process.
Effects of isothermal temperatures on mean grain size (a) and microhardness (b) of HNSS wire after annealing treatment at 1050 °C.

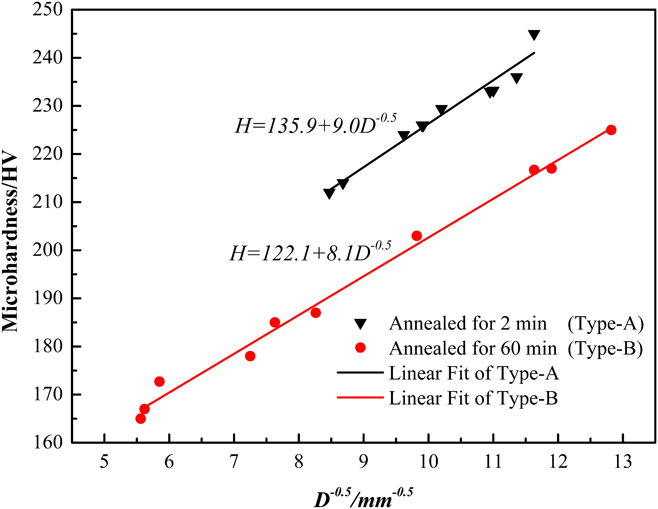
It can be seen from Fig. 3, the microhardness, mean grain size with temperature trends showed a significant inverse relationship. As is commonly known, the H–P equation can express the relation of strength and hardness dependence on grain size. The variation of microhardness with mean grain size is linearly regressed, as shown in Fig. 4. Two linear fittings were obtained by analyzing the data of microhardness and grain size, namely: the linear fitting of Type-A samples (black line), which can be described by H = 135.9 + 9.0D −0.5; the linear fitting of Type-B samples (red line), which can be described by H = 122.1 + 8.1D −0.5. It can be seen that the actual points of Type-A and Type-B samples are distributed in the form of trace deviations near the linear fittings. The parameters of H 0 and k for this alloy are different from the results obtained by Hong et al.Reference Hong, Shi, Sheng, Cao, Hui and Dong24 with H 0 of 247.93 and k of 6.50, as their composition is different. However, the slope k, which is a material-dependent constant, of the two linear fittings is different even if they are the same steel.
Relations between grain size and microhardness of HNSS wire after annealing treatment at 1050 °C.

There are some models, which have been proposed to account for the grain size dependence of hardness, assuming that the GB primarily hinders the motion of lattice dislocation and acts as an obstacle for their slip.Reference Malyar, Micha, Dehm and Kirchlechner27 In one type of models, GB acts as obstacle to pile up dislocations, causing stress concentration and activation of the dislocation source in adjacent grains, thereby initiating slip from grain to grain.Reference Li, Wei, Lu, Lu and Gao28,Reference Kacher, Eftink, Cui and Robertson29 In the other type of models, the GB is regarded as dislocation barriers that limit the mean free path of dislocations, thus increasing strain hardening and resulting in the H–P relation.Reference Lu, Lu and Suresh30 The dislocations cannot simply transmit through a GB, as the Burger’s vector of one grain is generally not a lattice vector in the adjacent grain.Reference Malyar, Micha, Dehm and Kirchlechner31
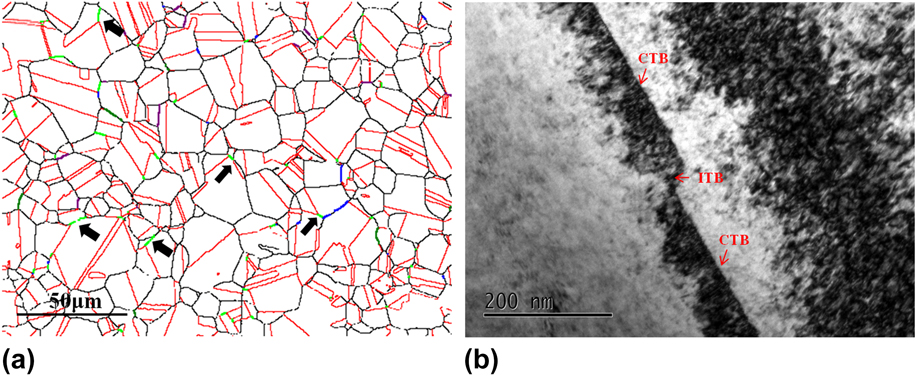
However, due to the low stacking fault energy,Reference Gavriljuk, Petrov and Shanina32,Reference Yonezawa, Suzuki, Ooki and Hashimoto33 a large number of annealing twins exist in the HNSS. The interfaces of annealing twins can also play a similar role as GBs. TBs can be a weak/strong barrier for the dislocation transmission which depends on the type of incoming dislocation.Reference Polcarová, Gemperlová, Jacques, Brádler and George34–Reference Jin, Gumbsch, Albe, Ma, Lu, Gleiter and Hahn36 Therefore, the TB should also be included in calculating the H–P type relation, which is an important reason for the difference of the slope k of the two linear fittings in Fig. 4. The EBSD map of relative spatial distribution of random and special GBs is shown in Fig. 5(a). It is obvious that a large number of CSL boundaries exist in HNSS. Annealing twins are a subset of Σ3 interfaces. The TEM map of the morphologies of coherent twin boundaries (CTBs) and incoherent twin boundaries (ITBs) are shown in Fig. 5(b). Traditionally, the “coherent twin”, a 〈111〉 symmetrical tilt boundary, and the “incoherent twin”, a 〈112〉 symmetrical tilt boundary, were recognized although it should be realized that the Σ3 classification also encompasses a range of asymmetrical tilts, twists, and irrational boundary planes. A high proportion of Σ3 is present in the crystal and Σ9 appears at the intersection of two Σ3, as shown by the black arrows in Fig. 5(a). The interactions are governed by the following rule concerning the joining or dissociation of CSL:
 $$\Sigma A + \Sigma B \mathbin{\lower.3ex\hbox{$\buildrel\textstyle\leftarrow\over{\smash{\rightarrow}\vphantom{_{\vbox to.5ex{\vss}}}}$}} \Sigma \left( {A \times B} \right)\quad ,$$
or
 $$\Sigma A + \Sigma B \mathbin{\lower.3ex\hbox{$\buildrel\textstyle\leftarrow\over{\smash{\rightarrow}\vphantom{_{\vbox to.5ex{\vss}}}}$}} \Sigma \left( {{A / B}} \right)\quad .$$
EBSD map shows the relative spatial distribution of random and special GBs of Type-A, 300 °C (a). The lines are color coded as follows: random boundaries = black; Σ3 = red; Σ5 = green; Σ7 = purple; Σ9 = lime green; Σ27 = blue. TEM map shows the morphologies of coherent twin boundaries and incoherent twin boundaries (b).

[Eq. (3b) applies only if A/B is an integer and A > B.] Hence the meeting of two Σ3 leads to a Σ9.Reference Randle37 One of the characteristics of Fig. 5 also confirms the theory reported by WatanabeReference Watanabe38 that the frequency of CSL boundaries generally increased with the mean grain size decreased.
Taking into account the presence of TBs, the mean grain size D in Eq. (1) should be changed to an effective grain size “D eff”, which contains the barrier effects of GBs and TBs. Since the ratio of TBs, F, and the mean grain size D can be measured by EBSD, the effective grain size D eff can be expressed as
 $${D_{{\rm{eff}}}} = {D / {\left( {1 + pF} \right)}}\quad ,$$
where p is a correction factor and is used to correct the difference in the role of the barrier effect in TBs with GBs. If p < 1, it signifies that the twin interface is less effective as barrier than GB, as is likely to be the case.Reference Imrich, Kirchlechner, Motz and Dehm39 Then the modified H–P relation, Eq. (1), can be expressed as
 $${H_{{\rm{eff}}}} = {H_0} + k{D^{{{ - 1} / 2}}}{\left[ {1 + pF} \right]^{{1 / 2}}}\quad .$$
Equation (5) is similar to the modified H–P relation that reported by Pande et al.Reference Pande, Rath and Imam23 In his study, the ratio of TBs, F, was represented as  $2{K_{\rm{t}}}\ln \hbox( {{D \over {{D_0}}}} \hbox)$, where K t is a constant and D 0 is the grain size at which there were no twins. Since
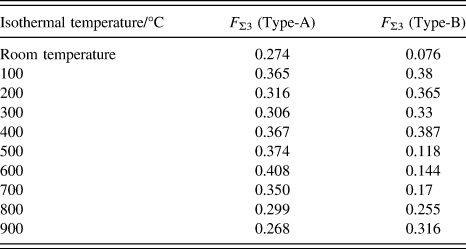
 ${K_{\rm{t}}}\ln \hbox( {{D \over {{D_0}}}} \hbox)$ is an approximate value of the number of twins per grain, it is more appropriate to utilize a carefully measured F. The ratio of TBs, F, in this study is listed in Table I.
The ratio of TBs measured by EBSD in the HNSS after different isothermal temperatures.

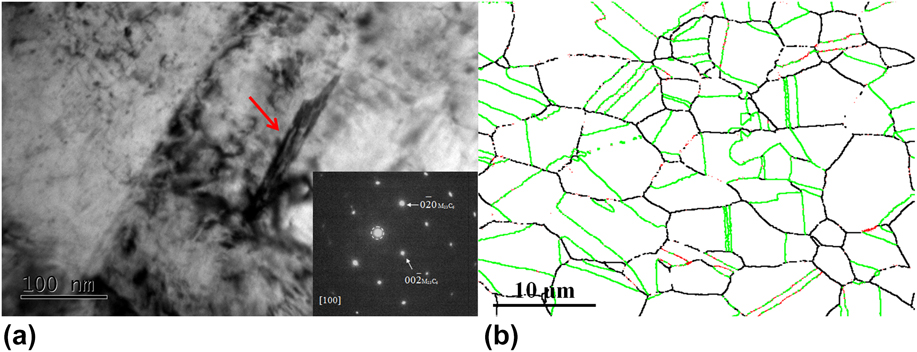
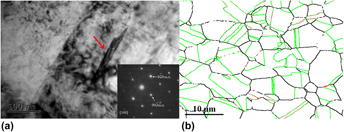
Figure 6(a) shows the bright field images and the corresponding selected area electron diffraction (SAED) of the precipitates at TBs in the HNSS. In Fig. 6(a), the diffraction pattern corresponds to the cubic structure of M23C6, with a lattice parameter of 1.066 nm, which is approximately three times larger than that of the austenite matrix (0.362 nm).Reference Weiss and Stickler40 The cube-on-cube orientation relationship between M23C6 carbides and the matrix is  ${\left[ {001} \right]_\gamma }{\rm{//}}{\left[ {001} \right]_{{{\rm{M}}_{23}}{{\rm{C}}_6}}}$ and
 ${\left( {100} \right)_\gamma }{\rm{//}}{\left( {100} \right)_{{{\rm{M}}_{23}}{{\rm{C}}_6}}}$, which agrees with the report presented by Lewis and Kenji et al.Reference Lewis and Hattersley41,Reference Kaneko, Fukunaga, Yamada, Nakada, Kikuchi, Saghi, Barnard and Midgley42 M23C6 mainly refers to (Cr, Fe)23C6 and the ratio of Cr and Fe depends upon the degree of Fe substitution in the basic carbide Cr23C6. The thin lamellar M23C6 carbides [Fig. 6(a)] precipitate on TBs discontinuously. The size of the discontinuous thin lamellar M23C6 carbides is about 100 nm. The presence of M23C6 carbides on TBs confirms previous TEM observations by Sasmal.Reference Sasmal43 EBSD investigations were carried out to further characterize the precipitation behavior of M23C6 carbides on TBs. The Kikuchi patterns highly match the M23C6 carbides in the EBSD database. In Fig. 6(b), the distributions of TBs and M23C6 carbides on TBs were shown. According to Fig. 6(a), the carbides size was around 100 nm and in the discontinuous thin lamellar structure. Therefore, the carbides appeared as dots on TBs in EBSD maps. The precipitation behavior of M23C6 carbides occurs in part of the TBs, and some of the TBs do not show any carbide precipitation.
TEM images with the precipitation behavior of M23C6 carbides on TBs (a). The inset in (a) shows the corresponding SAED pattern. The EBSD map shows the distributions of TBs and precipitates of M23C6 carbides on TBs (b). The black lines, lime green lines, and red dots represent GB, TB, and M23C6 carbides, respectively.

The precipitation of M23C6 carbides on TBs was associated with the gliding of Shockley partial dislocation and the interactions of dislocations and TBs. As discussed by Mahajan,Reference Mahajan, Pande, Imam and Rath44 annealing twins form by either growth accidents or by nucleation of stacking faults. TBs can be described by the glide of one (111) plane over another to the position defined by the Shockley partial dislocation, 1/6〈211〉 type. These partial dislocations provided favorable sites for the precipitation of M23C6 carbides, while the nucleation driving force of M23C6 carbides varies with the nucleation sites. According to Trillo et al.,Reference Trillo and Murr45 the average GB (γgb), ITB (γIT), and CTB (γCT) free energy at 600 °C are estimated to be 1034 mJ/m2, 259 mJ/m2, and 16 mJ/m2 in 304 stainless steels, respectively. The authors know that the GB/TB free energy is strongly depend on the local chemistry and structure and might be subjected to tremendous variations. However, the GB/TB free energy of the HNSS is difficult to be measured for the authors and only the comparative trends are of interest here which can be well represented by 304 stainless steels. The ITB has nominal energies about four times less than GB over a wide temperature range and the CTB possesses an interfacial free energy that is roughly a factor 60 below that of GB. This energy difference has a definite effect on precipitation behavior, namely, a critical nucleation energy value exists between γCT and γIT. The M23C6 carbides can be nucleated smoothly on ITB, while an extra energy is required to be nucleated on CTB.
For polycrystalline materials, TBs act as obstacles for dislocation motion, although the influence of TBs varies with the sample size, orientation, and dislocation density.Reference Lu, Shen, Chen, Qian and Lu8,Reference Lu, Lu and Suresh30,Reference Imrich, Kirchlechner, Motz and Dehm39,Reference Li, Wang, Misra, Zhang, Huang and Hirth46 An example about dislocation–twin interaction is schematically depicted in Fig. 7. A source (single arm or Frank–Read type) in one grain is activated and then the dislocations appear and pile-up alone TBs. The pile-up can produce high stresses (τ), which is n times that of the global shear stress and n is the number of dislocations in the pile-up.Reference Hull and Bacon47 This stress can be served as a driving force for carbide precipitation. Similar to the barrier effect of TBs, the stress value varies with orientation and dislocation density. However, there is a threshold stress for the driving force. That is the reason why M23C6 carbides only precipitate on part of TBs [Fig. 6(b)]. In addition, there is a critical length (L) corresponding to the threshold stress:
 $$L = {{nGb} \over {\pi \tau }}\quad ,$$
where G = shear modulus; b = Burgers vector. A pile-up length of 0.7 μm can be calculated assuming a pile-up of 10 dislocations, according to Imrich et al.Reference Imrich, Kirchlechner, Motz and Dehm39 If the size of the precipitates on TBs is much smaller than the critical dimension L, the morphology of the precipitates is discontinuous.
Schematic image showing the interaction between dislocations and TBs, resulting in the precipitation of M23C6 carbides on TBs.

In addition, the presence of a residual specific stress field around TB in the quenched samples is also responsible for the formation of M23C6 precipitates on TBs.Reference Sasmal43 The maximum value of residual stress is
 $${\sigma _{\max }} = {{E\alpha \Delta T} \over {1 - \nu }} \cdot {{{S^2}} \over {3a{t_0}}}\quad ,$$
where E = Young’s modulus; α = coefficient of thermal expansion; ΔT = temperature range (T q − T room); ν = Poisson’s ratio (=0.3); 2S = thickness of the plate; a = thermal diffusivity in cm2/s; t 0 = total transient time. For air-cooled samples in this study, t 0 is very high. Therefore, compared with the effect of interaction between dislocations and TBs, the effect of residual stress plays a supporting role in the driving force for carbide precipitation.
There is a good fit between M23C6 carbides and matrix atoms. The atomic volume of M23C6 exceeds that of austenite so stress will be set up by the precipitates at TBs. In general, TBs can be a weak/strong barrier for dislocation transmission or a dislocation sink for absorption.Reference Malyar, Micha, Dehm and Kirchlechner27,Reference Malyar, Micha, Dehm and Kirchlechner31 The appearance of M23C6 precipitates on TBs may in turn affect the interaction between TBs and dislocations, which could eventually have some influence on mechanical properties of HNSS. The TB can be regarded as an array of Shockley partial dislocations and those dislocations may glide out of the boundary under the action of the stresses generated by M23C6 carbides. However, since the Burgers vectors of the boundary dislocations are zero, the glide of additional partials on adjacent planes will restore rather than relieve the stresses set up by the M23C6 carbides. Thus the stresses should be relieved by a flow of vacancies to the precipitates’ interface. The strain energy of the precipitates could therefore acts as the driving force for the migration of the TB if this boundary is able (ITB), as it moves into the grain, to collect the vacancies required to relieve the strain and transfer them to the boundary precipitates. As for the immobile CTB, a stress field could be set up due to the irrelievable stress. This stress field may interact with the stress field generated by the pile-up dislocations in front of TBs, thus affecting the barrier effect of TB on dislocation motion.
Taking into account the presence of M23C6 carbides at TBs, the ratio of the TB F should be modified according to the proportion (M) of M23C6 carbides at TBs. Thus, the modified ratio of TBs, F eff is given by
 $${F_{{\rm{eff}}}} = F\left( {1 + qM} \right)\quad ,$$
where q is a correction factor. If q > 0, it indicates that the M23C6 carbides at TBs play a role in strengthening the barrier effect. If q < 0, it indicates that the M23C6 carbides at TBs play a role in weakening the barrier effect. Substituting F eff into the modified H–P relation, Eq. (5), a more accurate expression should be
 $${H_{{\rm{fin}}}} = {H_0} + k{D^{ - 1{\rm{/}}2}}{\left[ {1 + pF\left( {1 + qM} \right)} \right]^{{1 / 2}}}\quad .$$
Compared with Eq. (1), D is replaced by D fin, which is given by
 $${D_{{\rm{fin}}}} = {D \over {1 + pF\left( {1 + qM} \right)}}\quad ,$$
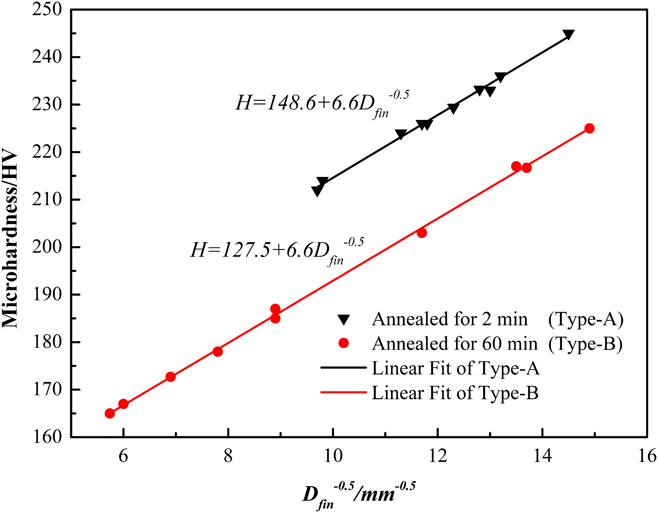
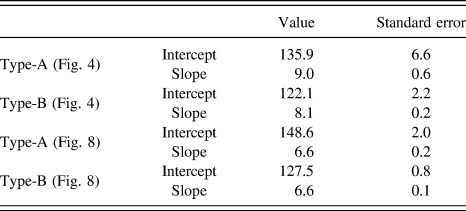
D fin depends on mean grain size, twin density, and the precipitates at TBs. According to Eq. (9), the variation of microhardness with D fin is linearly regressed, as shown in Fig. 8. Two linear fittings were obtained, namely: the linear fitting of Type-A samples (black line), which can be described by H = 148.6 + 6.6D −0.5; the linear fitting of Type-B samples (red line), which can be described by H = 127.5 + 6.6D −0.5. Obviously, the slope k of the two linear fittings has the same value. In addition, the standard error of the intercept and the slope of the two linear fittings is decreased after the correction. The relevant parameters in Figs. 4 and 8 are shown in Table II.
Relations between microhardness and the effective grain size show the effect of TBs and precipitates at TBs in HNSS wire after annealing treatment at 1050 °C.

The values and standard error of the intercept and slope of the two linear fittings before and after correction.

IV. CONCLUSIONS
The relation between microstructures and microhardness of the HNSS subjected to annealing and isothermal treatment was carefully studied. The main results can be summarized as follows.
(1) The deviations in mean grain size of traditional H–P equation are related to the effects of twins and precipitates at TBs. A new H–P relation that connected grain size, twin density, precipitates at TBs, and microhardness in HNSS was established and showed to be in good agreement with the experimental results.
(2) The nanoprecipitates on TBs are indeed M23C6 carbides with a cube (matrix, fcc)–cube (M23C6, fcc) relationship. The driving force of M23C6 precipitates on TBs could be 2-fold. The effect of interaction between dislocations and TBs plays a dominant role while the residual stress effect plays a supporting role.
(3) The precipitation of nano-M23C6 carbides on TBs has an influence on the barrier effect of TBs, thus affecting the mechanical properties of the HNSS.
ACKNOWLEDGMENTS
The authors wish to acknowledge the financial support from Project of Science and Technology Plan of Hebei Province (No. 15211007D). The authors are also appreciative of the facilities and assistance provided by the Electron Microscope Unit at the HBIS research institute.