

Introduction
Many local breeds under low selection pressure maintain large variations in coat colour, which the farmers link to production traits, but a few quantitative analyses have been made to substantiate the effect of coat colour on differences in morphology, production, behaviour and welfare. Chamarita sheep are a breed from La Rioja (Spain), included in the Official Catalogue of Spanish Livestock Breeds under Endangered Native Breeds. The Chamarita population size is about 10 000 sheep and it is officially recognized as an endangered breed to be preserved. The herd book was created in 2007 by the Chamarita Sheep Association of La Rioja (or AROCHA as it is known by its Spanish acronym), which has an official recognition to promote and control the breed. Most herds are found in the mountains of lower La Rioja and in the Cidacos and Linares valleys (Warren, Reference Warren2011). Animals are small in size (adult rams 55–65 kg, ewes 35–40 kg; Barrio, Falceto and Doménech, Reference Barrio, Falceto and Doménech1991), probably as an adaptive response to their hard living conditions and in their extensive and sustainable production system, which uses local resources (Álvarez and Arruga, Reference Álvarez and Arruga2007).
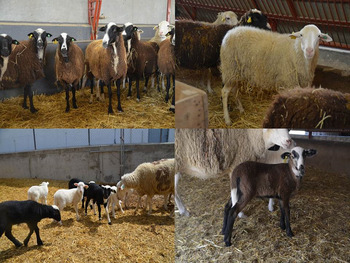
The wool and skin colour of Chamarita sheep are quite variable, with white, black (roya) and rarely galana (a combination of white, black and brown skin with white and black/roya wool) coats (Figure 1). The roya sheep is born black but their wool turns in reddish-black with age, looking like brown. This type of coat is locally called roya. The black skin is mainly located in the face. It is likely that, as with other breeds in the region, breeders have selected for hardiness (through fertility and morphological characteristics) and adaptation to the environment and less for pure white wool. Nowadays there are many black sheep in herds, since it is associated with positive zootechnical traits (Doménech et al., Reference Doménech, Barrio, Falceto and González Jiménez1992). Black animals usually have a white spot on the nape (crowned), and another at the distal end of the tail (puntiblancos). Sometimes, the spot of the neck extends over the head, forehead and nasal area (caretos).
Differences in coat colour in Chamarita sheep.

Currently, Chamarita sheep are mostly used for meat production, both for suckling lamb (12–14 kg live weight) and a weaned lamb with a short indoor fattening period (20–22 kg live weight; Doménech et al., Reference Doménech, Barrio, Falceto and González Jiménez1992). The Chamarito lamb was recognized as a quality brand in April 2010 (PROCORCHA). Thus, farmers now used a production system that ensures compliance with strict animal welfare health programmes, respecting the origin of sheep fed on extensive pastures and lambs produced in La Rioja on their mother's milk. In this study, we describe the morphological, productive and welfare traits of adult female Chamarita sheep and the influence of coat colour on these traits.
Materials and methods
A flock of 50 Chamarita adult ewes were transported from La Rioja to the Animal Experimentation Support Service (SAEA) of the University of Zaragoza, Aragón (41◦41_N). All sheep used were raised, transported and slaughtered according to current regulations of the European Community Commission (1986) for Scientific Procedure Establishments. All the protocols were approved by the Animal Experimentation Ethics Committee of the University of Zaragoza. This study was the collaboration between the Autonomous Regions of Aragon and La Rioja (Spain).
Animals
The adult multiparous ewes were housed in pens during pregnancy and lactation (2 m2 per ewe), fed twice a day (at 08.00 and 15.00) with pellet concentrate (11.5 MJ ME per kg DM and 15.5 percent crude protein; ~0.3 kg per ewe) and ad libitum lucerne chaff (Medicagosativa). The pen was equipped with a metallic water trough (1.5 m × 0.60 m) and two metallic feeders (4.5 m × 0.80 m, 27 cm per ewe) and a lick stone for minerals.
Most ewes were inseminated by controlled natural mating before leaving the source farm and lambed at the University a few weeks after arrival. The lambs were kept together in the same pen with their mothers (2 m2 per sheep and lamb). Flock prolificacy was calculated as the total number of lambs born per total ewes lambing. Lambs were weighed at birth (BW) and at weaning (WW). Pre-weaning average daily gain (ADG) was estimated by the difference WW−BW divided by the total milking period (30 days).
Morphological measurements of ewes
One day before blood sampling, body length (BL), height at withers (HW) and thorax circumference (TC) were measured as in Miranda-de la Lama et al. (Reference Miranda-de la Lama, Sepúlveda, Montaldo, María and Galindo2011), and each ewe was weighed using a portable digital weighing scale.
Social behaviour
Social behaviour was evaluated by direct observation. All ewes were individually identified and marked with 30 cm-high numbers and letters painted on the sides and rump with washable paint for sheep marking (PeintureMarquage Mouton®). A platform with a seat 3 m above the ground was used to observe the flock from a distance. The ewes were observed 6 h daily, from 8:00 to 10:00 h, 12:00 to 14:00 h and 16:00 to 18:00 h for 16 consecutive days (96 h of observation) by the same trained observer. A behaviour sampling technique was used to record all social interactions (agonistic and non-agonistic behaviour). Agonistic interactions with contact included butts (when the ewe used the front of her head to make contact with another ewe), pushes (when a ewe used other parts of her body to make contact with another ewe) and bites (when one ewe bit another ewe's body using her teeth). Agonistic interactions without contact included threats (when a ewe turned towards or approached another individual with her head down and then lunged without making contact), and chase (when a ewe actively moved towards another individual, causing the latter to walk or run away). Non-agonistic interactions with contact included licking (when a ewe passed her tongue over the body of another individual) and grooming (when a ewe groomed another ewe's body using her teeth). Non-agonistic interactions without contact included sniffing (when a ewe sniffed another ewe's body) and the flehmen response (when a ewe retracted the upper lip, wrinkled the nose and bared the gums in the presence of another ewe).
Physiological welfare indicators
Blood samples were taken by jugular venipuncture with vacuum tubes during the dry period to evaluate physiological responses to stress (two 10 ml tubes per animal, with and without anticoagulant, Ethylenediaminetetraacetic acid EDTA-K3). Blood was sampled using the necessary precautions to avoid sampling error on stress indicators. Samples were kept on ice for a maximum of 2 h and taken to the laboratory for routine haematological measurements. EDTA plasma and serum were centrifuged at 3 000 rpm for 10 min and aliquots were frozen and kept at −30 °C until analysed.
An automatic particle counter (Microcell counter F-800 and auto dilutor AD-260, SysmexTM both) was used to count red blood cells (RBC) and white blood cells (WBC) (number per mm3), haemoglobin (g/dl) and haematocrit (percent). The leukocyte formula was estimated from blood swabs on clean slides. Staining was performed by the rapid panoptic method using dyes from QuímicaClinicaAplicada Inc. With an optic immersion microscope we counted and identified 100 leucocytes per sample (neutrophils, lymphocytes, eosinophils, basophils and monocytes). The neutrophil/lymphocyte ratio (N/L) was used an indicator of chronic stress (Lawrence and Rushen, Reference Lawrence and Rushen1993). Serum samples were used to determine the concentration of glucose (mg/dl, Ref. Glucose AE2-17), and the activity of creatine kinase (CK) (UI/L) (Ref. CK.NAC AE1-13) with a multianalyser ACE® (Clinical Chemistry System) and reagents from Alfa Wasserman. Serum concentration of non-esterified fatty acid (NEFA) levels was analysed by a multianalyser ACE® (Clinical Chemistry System of the Alfa Wasserman), with commercial kits (NEFA C Ref. 994-75409 of the Wako). The concentration of cortisol was determined from plasma (EDTA-K3) by enzyme immunoassay using an “in home-kit” (validated by Chacón et al., Reference Chacón, García-Belenguer, Illera and Palacio2004). Each sample was determined in duplicate from 50 µl of plasma and the results were expressed in nmol/l, with the corresponding controls. Variation coefficients of the analysis, inter- and intra-assay, were 7 and 8 percent, respectively. The concentration of lactate was determined using a Sigma Diagnostic kit (lactate no. 735-10) and spectrophotometer (Lambda 5, Perkin Elmer).
Data analysis
Data were analysed using the least squares methods of the GLM procedure using SAS/STAT (9.1 SAS Inst. Inc., Cary, NC, USA) by SAS (1998), fitting a one-way model with a fixed effect of coat colour (two levels) within the ewe data. The general representation of the model used was: y = Xb + e, where y was an N × 1 vector of records, b denoted the fixed effect in the model with the association matrix X and e was the vector of residual effects. A probability of P < 0.05 values was considered statistically significant.
Results and discussion
The proportion of coat colours frequencies, according to the association of breeders statistics, are 45 percent white coat and 55 percent non-white coat (including the minority galana coat). According with the genetic study performed by Álvarez and Arruga (Reference Álvarez and Arruga2007), the Chamarita phenotypes are considered to be as a unique population.
Morphological measurements
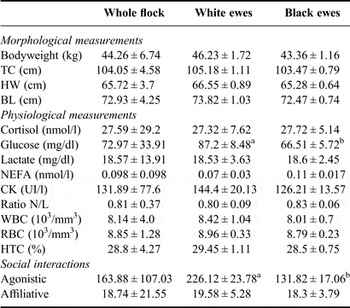
Coat colour had little effect on morphological measurements (Table 1). Live weight of the adult ewes averaged 44.26 (±6.74) kg with no significant differences between white and black sheep. The average TC was 104.05 (±4.58) cm, HW 65.72 (±3.7) cm and BL from chest to tail 72.93 (±4.25) cm. The average live weight and HW were higher than described by Barrio, Falceto and Doménech (Reference Barrio, Falceto and Doménech1991) (live weight 36.6 kg, HW 59.8 cm). Chamarita sheep may have a lower body weight after food shortages in extensive systems, which was not the case in our experimental herd where sheep were fed twice daily with concentrate and had water and straw ad libitum. However, BL was shorter than in Barrio, Falceto and Doménech (Reference Barrio, Falceto and Doménech1991) (90.5 cm), but the latter authors did not find differences between body measurements of white and black sheep. Although body weight was not significantly higher in white ewes, there was a tendency for black sheep to be lighter.
Least-square means (±S.E.) for the effect of coat colour on morphological, physiological and behavioural traits in Chamarita sheep.

Different letters (a, b) represent significant differences (p < 0.05) between groups. NEFA, non-esterified fatty acid; CK, creatine kinase; Ratio N/L, neutrophil/lymphocyte ratio; WBC, white blood cells; RBC, red blood cells; HCT, haematocrit.
The small size of Chamarita ewes compared with more productive breeds (e.g. Rasa aragonesa: 45–50 kg; Manchega: weighing over 45 kg; Merino: 50–70 kg; and Assaf: 60–70 kg) is consistent with the morphology and weights of most breeds considered rustic and well adapted to a harsh environment (Catalogue Livestock Breeds in Spain). Such is the case of Ojalada (between 35 and 45 kg of body weight), Mallorquina (30–40 kg of body weight) or Gallega (25–35 kg in the mountain ecotype). This adaptation is due to food shortages, thereby reducing their energy needs (Álvarez and Arruga, Reference Álvarez and Arruga2007), allowing them to make use the resources at their disposal. In that regard, black sheep that tended to be smaller than white sheep may be more adapted to a harsh environment than white sheep (Álvarez and Arruga, Reference Álvarez and Arruga2007).
Productive traits
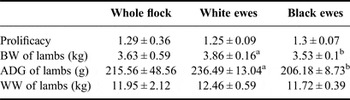
The average litter size of the whole flock was 1.29 (±0.36) lambs born per ewe lambing with no significant differences between coat colours (Table 2). Litter size is slightly higher than in Doménech et al. (Reference Doménech, Barrio, Falceto and González Jiménez1992), who found a tendency for single births (1.1 lambs per ewe). However, the latter authors suggested that an increased food supply could increase prolificacy to 1.5 lambs per ewe and delivery. These data confirm the potential for improvement of the Chamarita sheep when environmental conditions are optimal. The lambs weighed 3.63 (±0.59) kg at birth, and those born to white mothers were significantly (P ≤ 0.05) heavier than these born (+9 percent) black ones. Balda, Chavarri and Doménech (Reference Balda, Chavarri and Doménech1981) reported a birth weight of 2.6 kg in pure lines and 3.6 kg in industrial crossings. In our study, the herd was pure and the crosses were with Chamarito males, so probably the increased birth weight in lambs may be due to higher feeding rate in our experimental group. The fact that lambs from white females weighed more at birth than those from black females is probably due to larger body size of their mothers is associated with higher consumption of concentrate. This hypothesis partially corroborates the data on blood glucose levels and social interactions of the herd, which suggest that white sheep were dominant (see below). Similarly, lambs from white ewes had a higher ADG during the milking period (+14.7 percent, P ≤ 0.05), compared with the ADG of the whole herd 215.56 (±48.56) g. The ADG data support the hypothesis that white females could eat more and therefore produce more milk for their lambs. However, the average weaning weight of the lambs (11.95 ± 2.12 kg) was not significantly different among different coat coloured mothers. That implies that a homogeneous product can be obtained at weaning regardless of coat colour.
Least-square means (±S.E.) for the effect of coat colour on productive traits in Chamarita sheep.

Different letters (a, b) represent significant differences (p < 0.05) between groups. BLW, birth weight; ADG, average daily gain during the milking period; WLW, weaning weight.
Social behaviour
Of the 163.88 (±107.03) aggressive interactions observed (Table 1), most were performed by white sheep (+71.5 percent, P ≤ 0, 05). That suggests a higher dominance status for white sheep (Orgeur, Mimouni and Signoret, Reference Orgeur, Mimouni and Signoret1990; Barroso, Alados and Boza, Reference Barroso, Alados and Boza2000), tied with the fact that they were heavier and larger (Miranda-de Lama et al., Reference Miranda-de la Lama, Sepúlveda, Montaldo, María and Galindo2011). Dominance is a mechanism that regulates social behaviour and priority access to available resources, since high dominance animals have priority access to resources in intensive production conditions (Barroso, Alados and Boza, Reference Barroso, Alados and Boza2000). That coincides with the higher glucose levels in white sheep. The levels of aggressive interactions observed within a stable herd are consistent with the idea of Doménech et al. (Reference Doménech, Barrio, Falceto and González Jiménez1992) that Chamarita behaviour is more like goat behaviour, with a lively temperament and instinct for survival, linked to foraging behaviour and browsing. Affiliative interactions totalled 18.74 (±21.55) for the whole herd, with no significant differences regarding coat colour. Affiliations are a very important part of the social cohesion of a group (Miranda-de la Lama and Mattiello, Reference Miranda-de la Lama and Mattiello2010), but under conditions of social competition for limited resources, animals tend to do without them (Miranda-de la Lama et al., Reference Miranda-de la Lama, Sepúlveda, Montaldo, María and Galindo2011). It is likely that an adaptation to very scarce resources has led to Chamarita to favour aggressive interactions in detriment of affiliative ones in the context of the social group.
Physiological welfare indicators
Physiological and haematological variables can be used to assess the welfare of animals subject to acute and/or chronic stress (Barnett and Hemsworth, Reference Barnett and Hemsworth1990). The results of physiological measurements are presented in Table 1. Cortisol levels averaged 27.59 (±29.2) nmol/l, glucose 72.97 (±33.91) mg/dl, lactate 18.57 (±13.91) mg/dl, NEFA 0.098 (±0.098) nmol/l and CK 131.89 (±77.6) IU/l. The N/L ratio averaged 0.81 (±0.37), which suggests there was no immune suppression (Lawrence and Rushen, Reference Lawrence and Rushen1993). None of the sheep had clinical signs of illness. The WBC count was 8.14 (±4) 103/mm3, RBC count 8.85 (±1.28) 103/mm3, and haematocrit percentage was 28.8 (±4.27). All physiological measures were within normal ranges for sheep during routine handling procedures and do not suggest that welfare was compromised (Hargreaves and Hutson, Reference Hargreaves and Hutson1990). Glucose was the only physiological variable that was significantly higher (P ≤ 0.05) in white sheep (by 31.1 percent) than black sheep. Plasma glucose levels increase after acute stress when adrenaline induces muscle glycogen catabolism for its use in gluconeogenesis in the liver (Apple et al., Reference Apple, Dikeman, Minton, McMurphy, Fedde, Leith and Unruh1995). However, in our case, the higher glucose levels in white sheep could have been the result of their higher feed intake. White sheep tended to be heavier and be the dominant animals in the herd, as reflected in levels of aggressive social interactions, all of which imply higher energy costs. However, we did not find a difference in stress levels between black and white sheep, probably since the group was quite stable and had abundant resources.
Conclusions
White ewes of the Chamarita breed are slightly larger than the black-coated ewes and give birth to larger lambs. They also behaved more aggressively and had higher plasma concentrations of glucose, underlying their more dominant character. Overall, the productive traits of Chamarita ewes and lambs were quite good compared with other sheep and taking into consideration their small size. Owing to their strong adaptation to the harsh environment of La Rioja sierra, using grazing resources within a sustainable production system, Chamarita breed should be preserved. Appropriate selection and conservation practises will help to improve their performance and help contribute to rural development and sustaining the local agro-ecosystem, preserving a valuable cultural and gastronomic heritage of the Community of La Rioja.
Acknowledgements
This study was funded by the Spanish Ministry of Science and Innovation (projects AGL-2009-10794/GAN and AGL2012.37219). Many thanks to the Autonomous Community of La Rioja for the Scholarship PhD Programme (Programa de AyudasPredoctoralesdelGobierno de la Rioja) of M. Pascual-Alonso. Special thanks to AROCHA and PROCORCHA associations for their support and their invaluable help. This appreciation is special for the veterinary responsible of these associations, Don José Antonio González. Thank you very much to the staff of the Animal Research Centre of the University of Zaragoza (SAEA).